

ToolMage
Anmelden
GraphMaker
Business Intelligence · 17.5K monatliche besuche

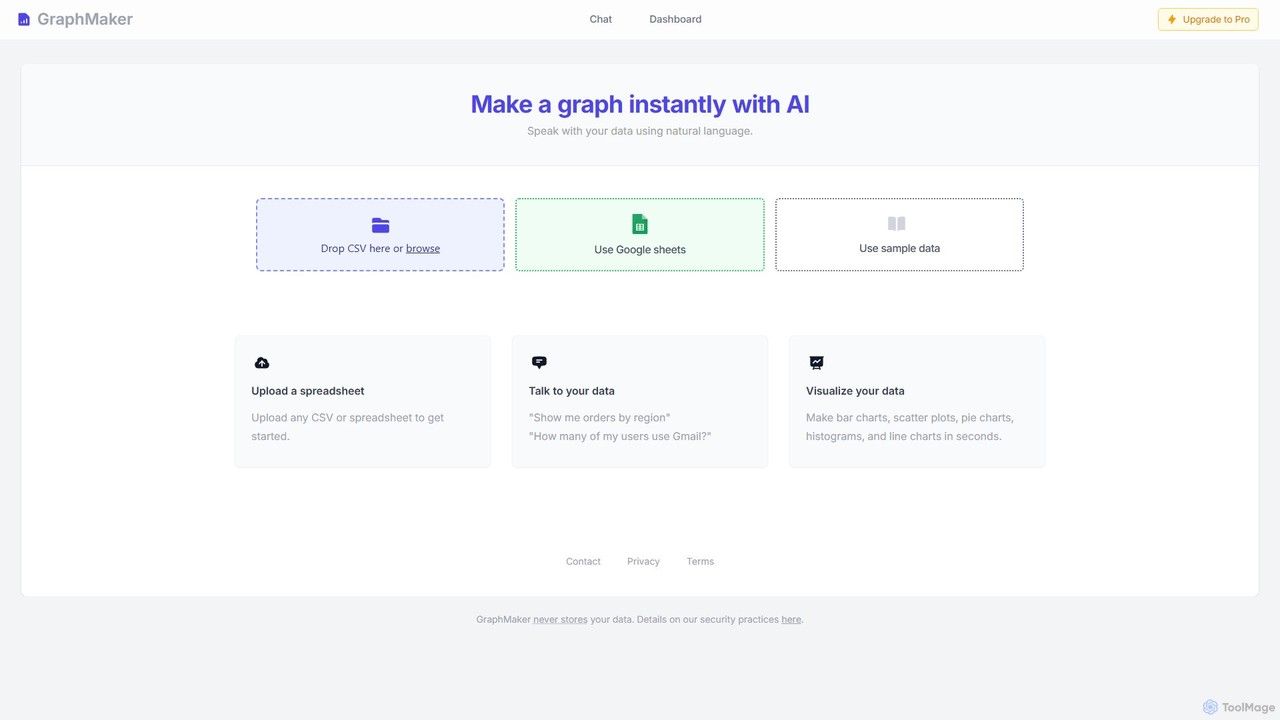
GraphMaker ist ein KI-gestütztes Datenvisualisierungstool, mit dem Sie in Sekundenschnelle verschiedene Diagramme und Grafiken erstellen können. Laden Sie einfach Ihre Daten aus einer CSV-Datei oder Google Sheets hoch und verwenden Sie Befehle in natürlicher Sprache, um aufschlussreiche Visualisierungen wie Balkendiagramme, Kuchendiagramme und Histogramme zu generieren. Es ist auf Geschwindigkeit, Einfachheit und Sicherheit ausgelegt, da es Ihre Daten niemals speichert.

VS
Kanaries
3D · 155.1K monatliche besuche

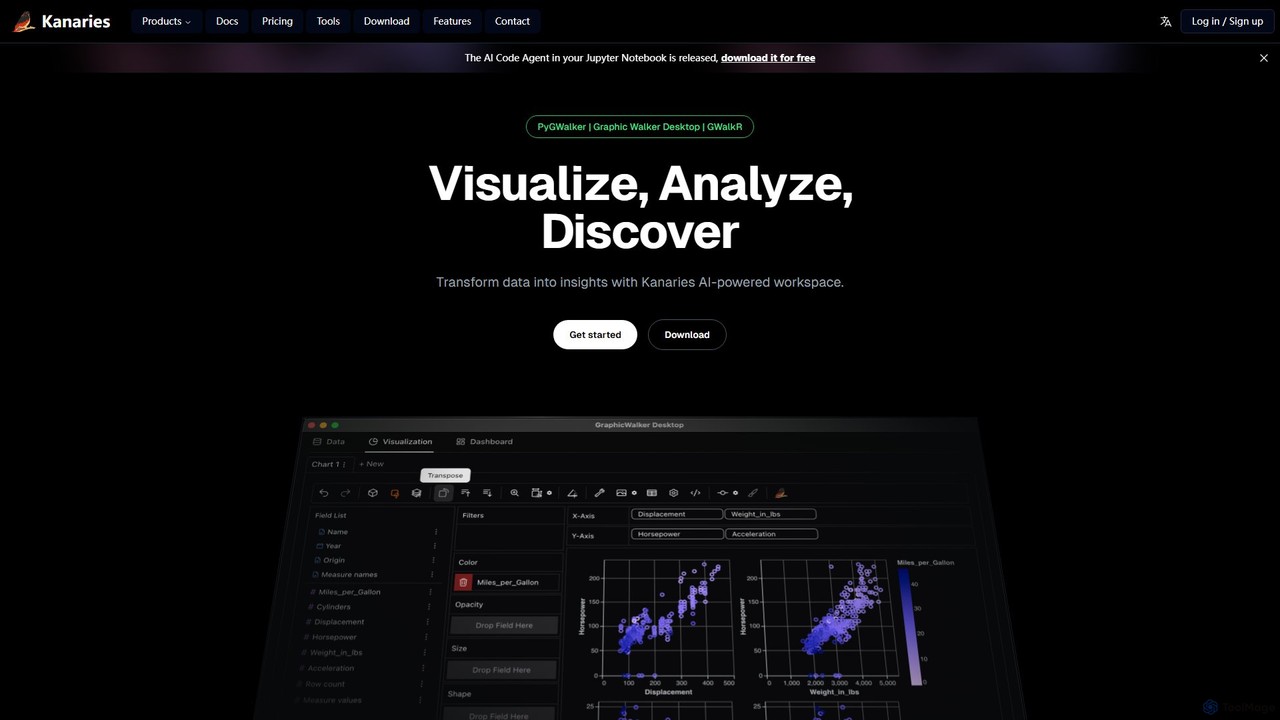
Kanaries ist ein KI-gestützter Arbeitsbereich für explorative Datenanalyse (EDA) und Visualisierung. Es bietet eine Reihe von Tools, darunter PyGWalker für Python und GWalkR für R, die DataFrames mit einer einzigen Codezeile in interaktive visuelle Analyseanwendungen umwandeln. Es verfügt über eine Drag-and-Drop-Oberfläche, einen KI-gestützten Chat für Datenabfragen und Kollaborationsfunktionen, die den gesamten Workflow von Daten zu Erkenntnissen für Analysten, Datenwissenschaftler und Entwickler optimieren.

GraphMaker vs Kanaries: Preise, Funktionen und Traffic

Vergleiche GraphMaker und Kanaries nach Positionierung, Preis, Funktionen, Traffic und Nutzerfeedback.

Aktualisiert 05.08.2026

Produktübersicht

GraphMaker Produktübersicht

GraphMaker ist ein KI-gestütztes Datenvisualisierungstool, mit dem Sie in Sekundenschnelle verschiedene Diagramme und Grafiken erstellen können. Laden Sie einfach Ihre Daten aus einer CSV-Datei oder Google Sheets hoch und verwenden Sie Befehle in natürlicher Sprache, um aufschlussreiche Visualisierungen wie Balkendiagramme, Kuchendiagramme und Histogramme zu generieren. Es ist auf Geschwindigkeit, Einfachheit und Sicherheit ausgelegt, da es Ihre Daten niemals speichert.
Preview

Kanaries Produktübersicht

Kanaries ist ein KI-gestützter Arbeitsbereich für explorative Datenanalyse (EDA) und Visualisierung. Es bietet eine Reihe von Tools, darunter PyGWalker für Python und GWalkR für R, die DataFrames mit einer einzigen Codezeile in interaktive visuelle Analyseanwendungen umwandeln. Es verfügt über eine Drag-and-Drop-Oberfläche, einen KI-gestützten Chat für Datenabfragen und Kollaborationsfunktionen, die den gesamten Workflow von Daten zu Erkenntnissen für Analysten, Datenwissenschaftler und Entwickler optimieren.

Preview

Detailed feature comparison

FeatureGraphMakerKanaries
HauptkategorieBusiness Intelligence3D
Hinzugefügt2025-08-152025-08-11
PreismodellFreemiumFreemium
Offizielle Websitewww.graphmaker.aikanaries.net
ProdukttypWebsiteWebsite
Performance data
NutzerbewertungNicht verifiziertNicht verifiziert
Kommentare00
Monatliche Besuche17.5K155.1K
Monatliches Wachstum-23.4%-2.3%
Favoriten105140
DetailsDetails ansehenDetails ansehen

GraphMaker vs Kanaries monthly traffic

Compare GraphMaker and Kanaries by monthly reach, traffic trend, visit depth, top regions, and acquisition sources.

How to interpret the traffic data

In the GraphMaker vs Kanaries monthly traffic comparison, GraphMaker currently shows 17.5K visits and Kanaries shows 155.1K; Kanaries has about 8.9 times the visible traffic of GraphMaker, an absolute difference of about 137.6K visits. This reflects visible reach, not feature quality or paid users.

Both tools provide verified traffic details, so monthly trends, visit depth, regions, and acquisition sources can be compared on the same basis.

GraphMaker monthly traffic:

Latest traffic

Monatliche Besuche
17.5K
Ø Besuchsdauer
0:07
Seiten pro Besuch
1.56
Absprungrate
40.1%
Data updated 2026-06-15

Monthly traffic trend

  • 2025/9: 109.9K Monatliche Besuche
  • 2026/1: 41.1K Monatliche Besuche
  • 2026/2: 29.5K Monatliche Besuche
  • 2026/3: 34.7K Monatliche Besuche
  • 2026/4: 22.9K Monatliche Besuche
  • 2026/5: 17.5K Monatliche Besuche

Top-Regionen

Top 5 countries/regions
Country/regionPercentageTraffic
🇺🇸United States44.07%7.7K
🇧🇷Brazil19.78%3.5K
🇬🇧United Kingdom14.08%2.5K
🇮🇳India11.85%2.1K
🇩🇪Germany10.22%1.8K

Suchbegriffe

ai tool for bar chartexcel to graph aigraph chart maker aigraph makergraph maker ai

Kanaries monthly traffic:

Latest traffic

Monatliche Besuche
155.1K
Ø Besuchsdauer
0:45
Seiten pro Besuch
1.54
Absprungrate
52.2%
Data updated 2026-06-15

Monthly traffic trend

  • 2025/9: 286.7K Monatliche Besuche
  • 2026/1: 197.8K Monatliche Besuche
  • 2026/2: 144.5K Monatliche Besuche
  • 2026/3: 152.6K Monatliche Besuche
  • 2026/4: 158.7K Monatliche Besuche
  • 2026/5: 155.1K Monatliche Besuche

Top-Regionen

Top 5 countries/regions
Country/regionPercentageTraffic
🇨🇳China25.12%39K
🇰🇷Korea, Republic of22.09%34.3K
🇺🇸United States19.23%29.8K
🇯🇵Japan18.33%28.4K
🇩🇪Germany15.23%23.6K

Traffic-Quellen

Source typePercentageTraffic
Direkt50.41%78.2K
Verweis48.97%75.9K
E-Mail0.62%962

Suchbegriffe

chatgpt jailbreak promptgemini和chatgpt区别gemini和gpt订阅哪一个pygwalker在线 地图气泡图
Traffic-based selection guidance: If public market visibility is an important first-pass criterion, investigate Kanaries first. The final choice should still follow taxonomy, use case, and a real trial because higher traffic does not prove broader capabilities or better workflow fit.

Usage comparison

Compare the core capabilities of GraphMaker and Kanaries

GraphMaker Core features

Business Intelligence
Visualisierung
Datenanalyse

Kanaries Core features

Business Intelligence
3D
Entwickler-Tools

Use cases

GraphMaker Use cases

Business Intelligence
Diagramm-Ersteller
Datenanalyse
Datenvisualisierung
KI-Datenanalyse
CSV zu Diagramm
Google Tabellen
Graphengenerator
natürliche Sprachverarbeitung
No-Code

Kanaries Use cases

Business Intelligence
Diagramm-Ersteller
Datenanalyse
Datenvisualisierung
KI-Code-Agent
Drag & Drop
EDA
Explorative Datenanalyse
Jupyter Notebook
pandas
Python
R

GraphMaker vs Kanaries:In-depth comparison and selection guidance

First decide whether the products solve the same kind of need

This in-depth GraphMaker vs Kanaries comparison uses only the product records, taxonomy, audience, traffic, and community signals available on this page. GraphMaker is primarily listed under “Business Intelligence”, while Kanaries is primarily listed under “3D”, so the first decision is whether your actual task matches their recorded scope.

The structured fields currently show these decision-relevant differences: Primary category (GraphMaker: Business Intelligence; Kanaries: 3D); Monthly visits (GraphMaker: 17.5K; Kanaries: 155.1K); Monthly growth (GraphMaker: -23.4%; Kanaries: -2.3%); Favorites (GraphMaker: 105; Kanaries: 140); Website (GraphMaker: www.graphmaker.ai; Kanaries: kanaries.net). These facts are more useful for selection than brand visibility alone.

What market visibility and monthly traffic mean

In the GraphMaker vs Kanaries monthly traffic comparison, GraphMaker currently shows 17.5K visits and Kanaries shows 155.1K; Kanaries has about 8.9 times the visible traffic of GraphMaker, an absolute difference of about 137.6K visits. This reflects visible reach, not feature quality or paid users.

Both tools provide verified traffic details, so monthly trends, visit depth, regions, and acquisition sources can be compared on the same basis.

If public market visibility is an important first-pass criterion, investigate Kanaries first. The final choice should still follow taxonomy, use case, and a real trial because higher traffic does not prove broader capabilities or better workflow fit.

Product positioning, use cases, and roles

GraphMaker and Kanaries currently overlap in shared categories: Business Intelligence; shared tags: Business Intelligence, Diagramm-Ersteller, Datenanalyse und Datenvisualisierung. This can place both on the same shortlist, but it does not prove equal implementation, depth, or cost.

GraphMaker's unique categories/tags are Visualisierung, Datenanalyse, KI-Datenanalyse, CSV zu Diagramm, Google Tabellen, Graphengenerator, natürliche Sprachverarbeitung und No-Code; Kanaries's are 3D, Entwickler-Tools, KI-Code-Agent, Drag & Drop, EDA, Explorative Datenanalyse, Jupyter Notebook und pandas. These unique fields are the strongest differentiators: validate the product whose recorded scope matches the task instead of following traffic alone.

What ratings, comments, and favorites can tell you

GraphMaker has no verified rating, 0 comments, 105 favorites, and 125 likes;Kanaries has no verified rating, 0 comments, 140 favorites, and 141 likes。

Neither product has enough rating or comment samples for a credible reputation ranking.

Selection guidance by actual need

When to evaluate GraphMaker first

Put GraphMaker on the priority trial list when the task aligns with “Business Intelligence” and especially Visualisierung, Datenanalyse, KI-Datenanalyse, CSV zu Diagramm, Google Tabellen und Graphengenerator. This follows recorded positioning and does not imply unlisted capabilities are absent.

GraphMaker also currently records: pricing is freemium, product type is website, 17.5K verified monthly visits, no verified user rating. Verify any hard requirement around price, platform, or reach before trial, and do not let sparse review data substitute for testing.

When to evaluate Kanaries first

Put Kanaries on the priority trial list when the task aligns with “3D” and especially 3D, Entwickler-Tools, KI-Code-Agent, Drag & Drop, EDA und Explorative Datenanalyse. This follows recorded positioning and does not imply unlisted capabilities are absent.

Kanaries also currently records: pricing is freemium, product type is website, 155.1K verified monthly visits, no verified user rating. Verify any hard requirement around price, platform, or reach before trial, and do not let sparse review data substitute for testing.

How to validate the recommendation before deciding

The available data describes positioning, public visibility, and community signals, but it cannot prove output quality, speed, integration effort, privacy, or long-term cost in your workflow. Before deciding, run the same representative tasks in GraphMaker and Kanaries, then record completion time, accuracy, manual corrections, and the real paid threshold. A like-for-like trial turns this comparison into a defensible adoption decision.

Vergleichs-FAQ

How should I choose between GraphMaker and Kanaries?
Compare positioning, pricing, taxonomy, and traffic maturity, then verify the latest details on each official website.
Where does this comparison data come from?
The factual baseline is derived from product, taxonomy, traffic, and community data. Reviewed editorial conclusions show their source and verification date.
What do unknown fields mean?
Unknown means there is not enough reliable evidence; the page does not fill gaps with assumptions.