ToolMage
Anmelden
infographics.so
Infografiken · 4K monatliche besuche

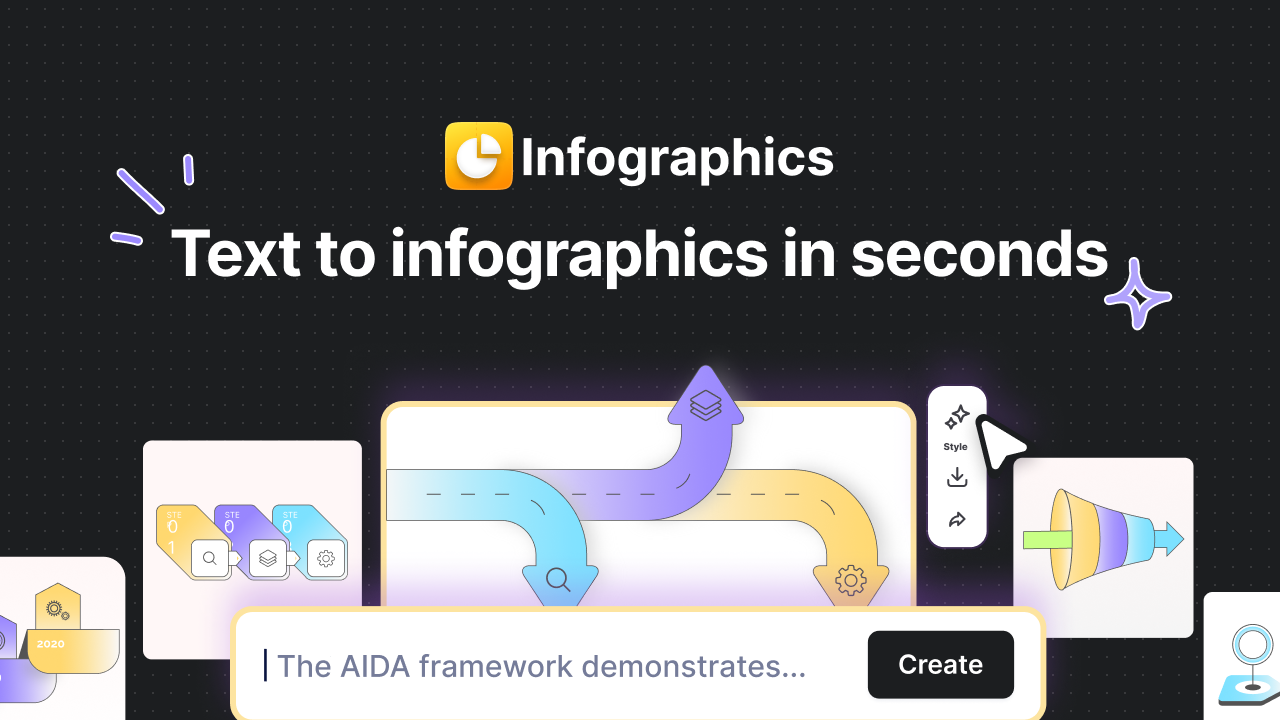
infographics.so ist ein KI-gestütztes Tool, das Text sofort in beeindruckende, professionelle Infografiken umwandelt. Es unterstützt verschiedene Formate wie Zeitachsen, Roadmaps und Trichter und bietet vollständige Anpassungsmöglichkeiten, um Ihrer Marke zu entsprechen. Ideal für Vermarkter, Projektmanager und Content-Ersteller, die in Sekundenschnelle ansprechende Visualisierungen für Berichte, Blogs und Präsentationen erstellen möchten, ohne Designkenntnisse zu benötigen.

VS
PicDoc
Infografiken · 59.8K monatliche besuche

PicDoc ist ein KI-gestütztes Text-zu-Bild-Tool, das Text sofort in beeindruckende Infografiken, Flussdiagramme und Diagramme umwandelt. Geben Sie einfach Ihren Inhalt ein, und die KI von PicDoc analysiert, fasst zusammen und visualisiert ihn in Sekunden. So können Sie komplexe Ideen effektiv kommunizieren und professionell aussehende Visuals ohne Designkenntnisse erstellen.

infographics.so vs PicDoc: Preise, Funktionen und Traffic

Vergleiche infographics.so und PicDoc nach Positionierung, Preis, Funktionen, Traffic und Nutzerfeedback.

Aktualisiert 19.08.2026

Produktübersicht

infographics.so Produktübersicht

infographics.so ist ein KI-gestütztes Tool, das Text sofort in beeindruckende, professionelle Infografiken umwandelt. Es unterstützt verschiedene Formate wie Zeitachsen, Roadmaps und Trichter und bietet vollständige Anpassungsmöglichkeiten, um Ihrer Marke zu entsprechen. Ideal für Vermarkter, Projektmanager und Content-Ersteller, die in Sekundenschnelle ansprechende Visualisierungen für Berichte, Blogs und Präsentationen erstellen möchten, ohne Designkenntnisse zu benötigen.
Preview

PicDoc Produktübersicht

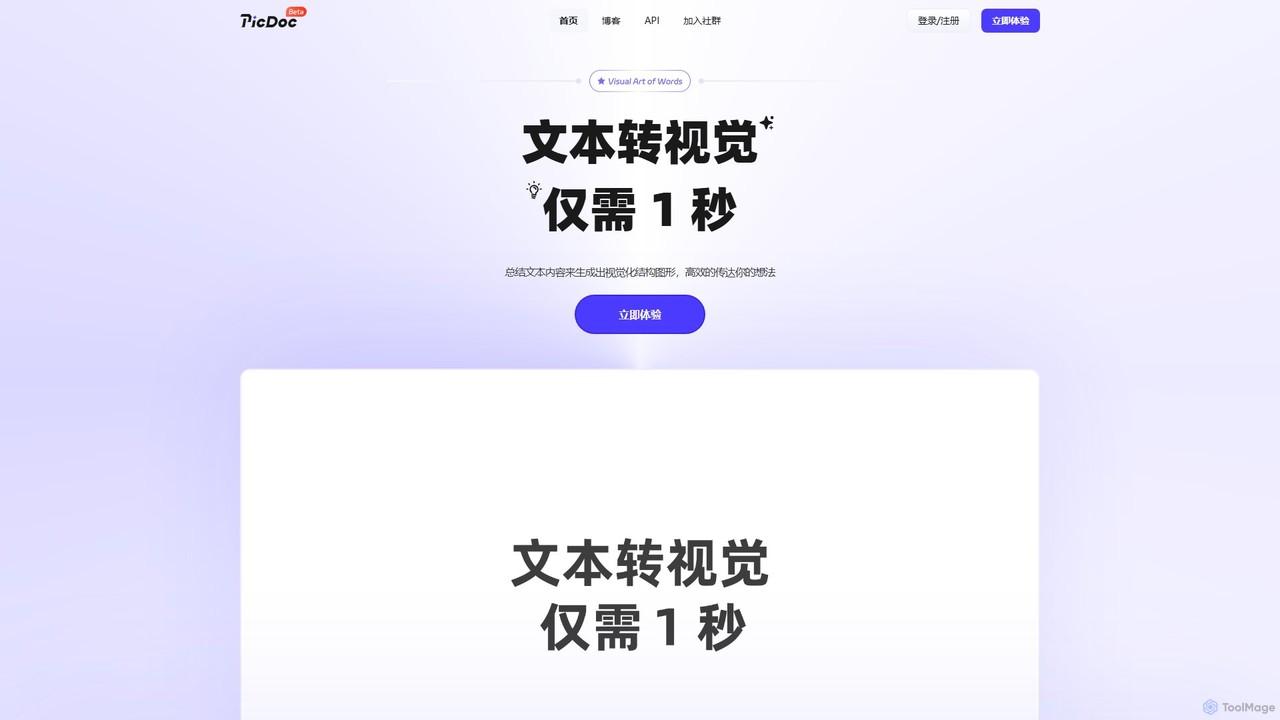
PicDoc ist ein KI-gestütztes Text-zu-Bild-Tool, das Text sofort in beeindruckende Infografiken, Flussdiagramme und Diagramme umwandelt. Geben Sie einfach Ihren Inhalt ein, und die KI von PicDoc analysiert, fasst zusammen und visualisiert ihn in Sekunden. So können Sie komplexe Ideen effektiv kommunizieren und professionell aussehende Visuals ohne Designkenntnisse erstellen.

Preview

Detailed feature comparison

Featureinfographics.soPicDoc
HauptkategorieInfografikenInfografiken
Hinzugefügt2025-08-162025-08-14
PreismodellFreemiumKostenlos
Offizielle Websiteinfographics.sowww.picdoc.cn
ProdukttypWebsiteWebsite
Performance data
NutzerbewertungNicht verifiziertNicht verifiziert
Kommentare00
Monatliche Besuche4K59.8K
Monatliches Wachstum-33.3%-36.1%
Favoriten126129
DetailsDetails ansehenDetails ansehen

infographics.so vs PicDoc monthly traffic

Compare infographics.so and PicDoc by monthly reach, traffic trend, visit depth, top regions, and acquisition sources.

How to interpret the traffic data

In the infographics.so vs PicDoc monthly traffic comparison, infographics.so currently shows 4K visits and PicDoc shows 59.8K; PicDoc has about 15 times the visible traffic of infographics.so, an absolute difference of about 55.8K visits. This reflects visible reach, not feature quality or paid users.

Both tools provide verified traffic details, so monthly trends, visit depth, regions, and acquisition sources can be compared on the same basis.

infographics.so monthly traffic:

Latest traffic

Monatliche Besuche
4K
Ø Besuchsdauer
0:02
Seiten pro Besuch
1.38
Absprungrate
37.3%
Data updated 2026-06-15

Monthly traffic trend

  • 2025/9: 13.9K Monatliche Besuche
  • 2026/1: 13.2K Monatliche Besuche
  • 2026/2: 8.1K Monatliche Besuche
  • 2026/3: 7.3K Monatliche Besuche
  • 2026/4: 6K Monatliche Besuche
  • 2026/5: 4K Monatliche Besuche

Top-Regionen

Top 5 countries/regions
Country/regionPercentageTraffic
🇺🇸United States34.32%1.4K
🇮🇳India26.26%1K
🇲🇾Malaysia23.31%930
🇬🇧United Kingdom8.71%347
🇵🇰Pakistan7.4%295

Suchbegriffe

document to infographic aifrom text to visualized infographicsgenerate infographics from textinfografaiinfographic ai

PicDoc monthly traffic:

Latest traffic

Monatliche Besuche
59.8K
Ø Besuchsdauer
4:12
Seiten pro Besuch
2.94
Absprungrate
53.95%
Data updated 2026-06-15

Monthly traffic trend

  • 2025/9: 57.6K Monatliche Besuche
  • 2026/1: 42.1K Monatliche Besuche
  • 2026/2: 29.1K Monatliche Besuche
  • 2026/3: 53.4K Monatliche Besuche
  • 2026/4: 93.6K Monatliche Besuche
  • 2026/5: 59.8K Monatliche Besuche

Top-Regionen

Top 5 countries/regions
Country/regionPercentageTraffic
🇨🇳China88.62%53K
🇭🇰Hong Kong3.92%2.3K
🇹🇼Taiwan3.35%2K
🇺🇸United States2.68%1.6K
🇸🇬Singapore1.43%856

Traffic-Quellen

Source typePercentageTraffic
Direkt78.88%47.2K
Verweis21.12%12.6K

Suchbegriffe

picdocppt知识卡片样式在线组织架构图技术路线图末端因素分析鱼骨图在线生成
Traffic-based selection guidance: If public market visibility is an important first-pass criterion, investigate PicDoc first. The final choice should still follow taxonomy, use case, and a real trial because higher traffic does not prove broader capabilities or better workflow fit.

Usage comparison

Compare the core capabilities of infographics.so and PicDoc

infographics.so Core features

Infografiken
Inhaltserstellung
Präsentationen

PicDoc Core features

Infografiken
Inhaltserstellung
Präsentationen

Use cases

infographics.so Use cases

KI-Design
Datenvisualisierung
Infografik-Generator
Diagramm-Ersteller
Marketing-Visuals
Präsentationstool
Berichtsdesign
Roadmap-Ersteller
Text zu Bild

PicDoc Use cases

KI-Design
Datenvisualisierung
Infografik-Generator
Inhaltserstellung
Flussdiagramm-Werkzeug
Präsentationsersteller
Produktivität
Text zu Diagramm
visuelle Kommunikation

infographics.so vs PicDoc:In-depth comparison and selection guidance

First decide whether the products solve the same kind of need

This in-depth infographics.so vs PicDoc comparison uses only the product records, taxonomy, audience, traffic, and community signals available on this page. infographics.so is primarily listed under “Infografiken”, while PicDoc is primarily listed under “Infografiken”, so the first decision is whether your actual task matches their recorded scope.

The structured fields currently show these decision-relevant differences: Pricing (infographics.so: Freemium; PicDoc: Free); Monthly visits (infographics.so: 4K; PicDoc: 59.8K); Monthly growth (infographics.so: -33.3%; PicDoc: -36.1%); Favorites (infographics.so: 126; PicDoc: 129); Website (infographics.so: infographics.so; PicDoc: www.picdoc.cn). These facts are more useful for selection than brand visibility alone.

What market visibility and monthly traffic mean

In the infographics.so vs PicDoc monthly traffic comparison, infographics.so currently shows 4K visits and PicDoc shows 59.8K; PicDoc has about 15 times the visible traffic of infographics.so, an absolute difference of about 55.8K visits. This reflects visible reach, not feature quality or paid users.

Both tools provide verified traffic details, so monthly trends, visit depth, regions, and acquisition sources can be compared on the same basis.

If public market visibility is an important first-pass criterion, investigate PicDoc first. The final choice should still follow taxonomy, use case, and a real trial because higher traffic does not prove broader capabilities or better workflow fit.

Product positioning, use cases, and roles

infographics.so and PicDoc currently overlap in shared categories: Infografiken, Inhaltserstellung und Präsentationen; shared tags: KI-Design, Datenvisualisierung und Infografik-Generator. This can place both on the same shortlist, but it does not prove equal implementation, depth, or cost.

infographics.so's unique categories/tags are Diagramm-Ersteller, Marketing-Visuals, Präsentationstool, Berichtsdesign, Roadmap-Ersteller und Text zu Bild; PicDoc's are Inhaltserstellung, Flussdiagramm-Werkzeug, Präsentationsersteller, Produktivität, Text zu Diagramm und visuelle Kommunikation. These unique fields are the strongest differentiators: validate the product whose recorded scope matches the task instead of following traffic alone.

What ratings, comments, and favorites can tell you

infographics.so has no verified rating, 0 comments, 126 favorites, and 145 likes;PicDoc has no verified rating, 0 comments, 129 favorites, and 122 likes。

Neither product has enough rating or comment samples for a credible reputation ranking.

Selection guidance by actual need

When to evaluate infographics.so first

Put infographics.so on the priority trial list when the task aligns with “Infografiken” and especially Diagramm-Ersteller, Marketing-Visuals, Präsentationstool, Berichtsdesign, Roadmap-Ersteller und Text zu Bild. This follows recorded positioning and does not imply unlisted capabilities are absent.

infographics.so also currently records: pricing is freemium, product type is website, 4K verified monthly visits, no verified user rating. Verify any hard requirement around price, platform, or reach before trial, and do not let sparse review data substitute for testing.

When to evaluate PicDoc first

Put PicDoc on the priority trial list when the task aligns with “Infografiken” and especially Inhaltserstellung, Flussdiagramm-Werkzeug, Präsentationsersteller, Produktivität, Text zu Diagramm und visuelle Kommunikation. This follows recorded positioning and does not imply unlisted capabilities are absent.

PicDoc also currently records: pricing is free, product type is website, 59.8K verified monthly visits, no verified user rating. Verify any hard requirement around price, platform, or reach before trial, and do not let sparse review data substitute for testing.

How to validate the recommendation before deciding

The available data describes positioning, public visibility, and community signals, but it cannot prove output quality, speed, integration effort, privacy, or long-term cost in your workflow. Before deciding, run the same representative tasks in infographics.so and PicDoc, then record completion time, accuracy, manual corrections, and the real paid threshold. A like-for-like trial turns this comparison into a defensible adoption decision.

Vergleichs-FAQ

How should I choose between infographics.so and PicDoc?
Compare positioning, pricing, taxonomy, and traffic maturity, then verify the latest details on each official website.
Where does this comparison data come from?
The factual baseline is derived from product, taxonomy, traffic, and community data. Reviewed editorial conclusions show their source and verification date.
What do unknown fields mean?
Unknown means there is not enough reliable evidence; the page does not fill gaps with assumptions.

Related AI tools

graphicinfo
Freemium

graphicinfo

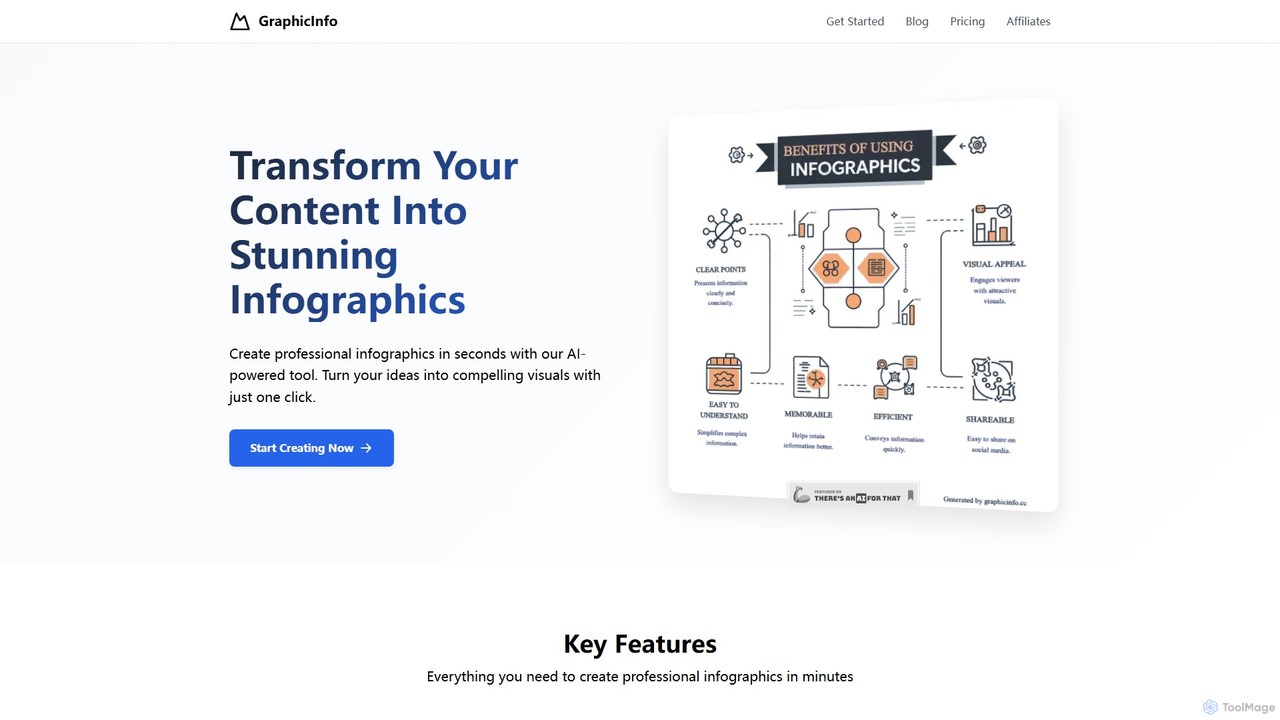
graphicinfo ist ein KI-gestützter Infografik-Generator, der Ihren Text und Ihre Ideen in Sekundenschnelle in beeindruckende, professionelle Visualisierungen umwandelt. Erstellen Sie mit nur einem Klick anpassbare, datenreiche Infografiken für Marketing, Bildung und Wirtschaft, ohne dass Designkenntnisse erforderlich sind.

Infografiken
Visits 6KFavorites 128Likes 137
Infografix
Freemium

Infografix

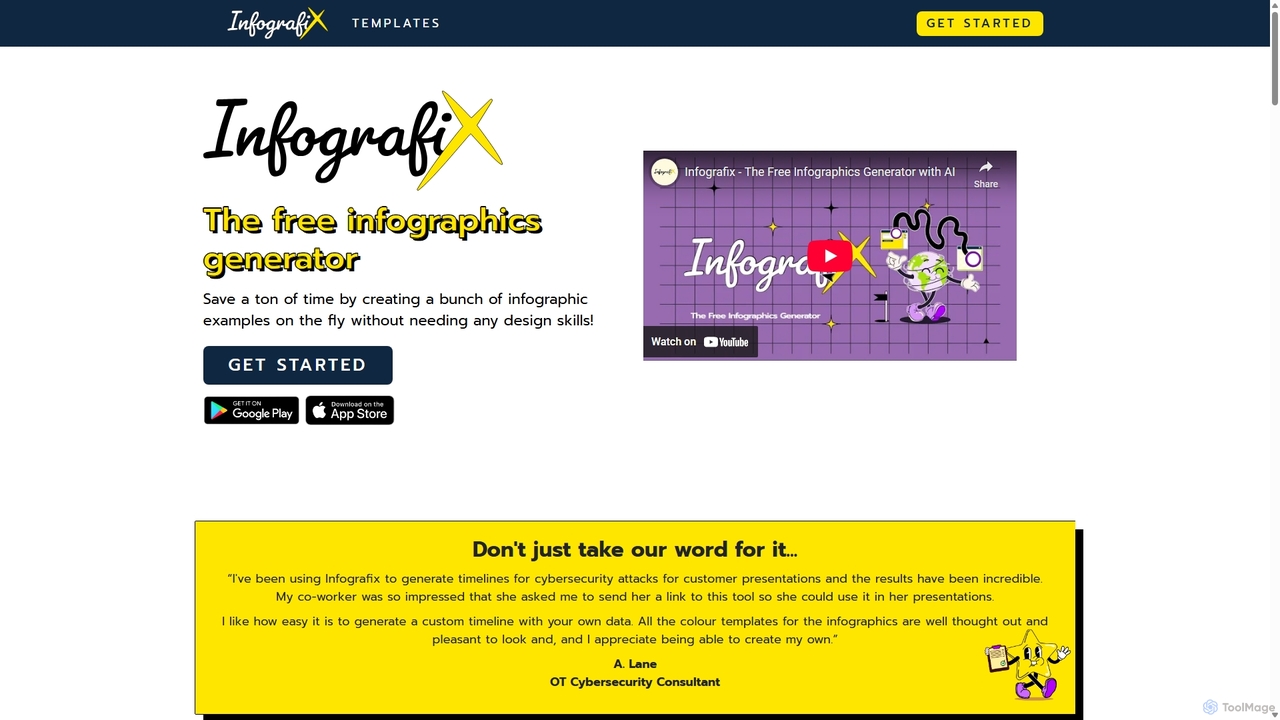
Infografix ist ein KI-gestützter Infografik-Generator, der einfache Textaufforderungen in professionelle Visualisierungen umwandelt. Erstellen Sie in Sekundenschnelle beeindruckende Diagramme, Mindmaps und Zeitachsen ohne Designkenntnisse. Verfügbar im Web und mobil, perfekt für Marketer, Studenten und Fachleute, die Daten schnell und effektiv visualisieren müssen.

Infografiken
Visits 41.5KFavorites 118Likes 100
Text2Infographic
Freemium

Text2Infographic

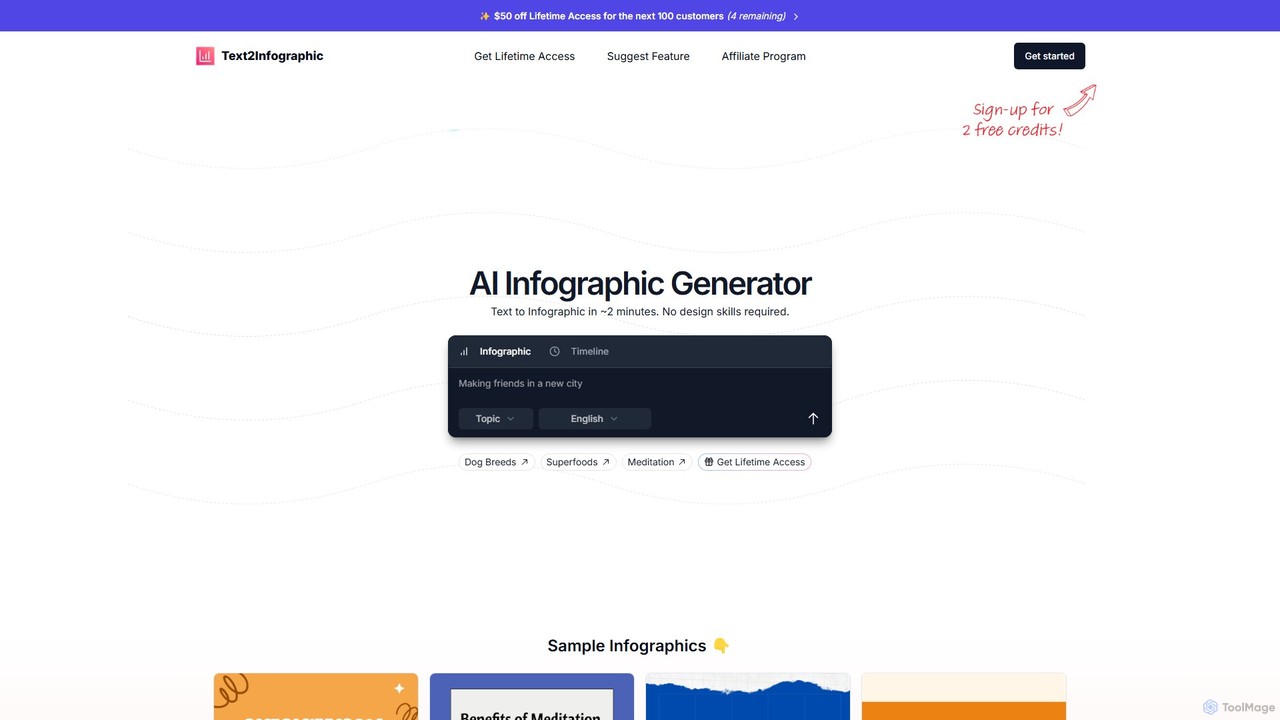
Text2Infographic ist ein KI-gestützter Generator, der Text, Blogbeiträge oder Daten in Minuten in professionelle Infografiken umwandelt. Er automatisiert Recherche, Bildbeschaffung und Design und ist somit ideal für Content-Ersteller, Vermarkter und Blogger ohne Designkenntnisse. Er unterstützt über 20 Sprachen und bietet Markenanpassung.

Infografiken
Visits 36.5KFavorites 119Likes 120
MyLens
Freemium

MyLens

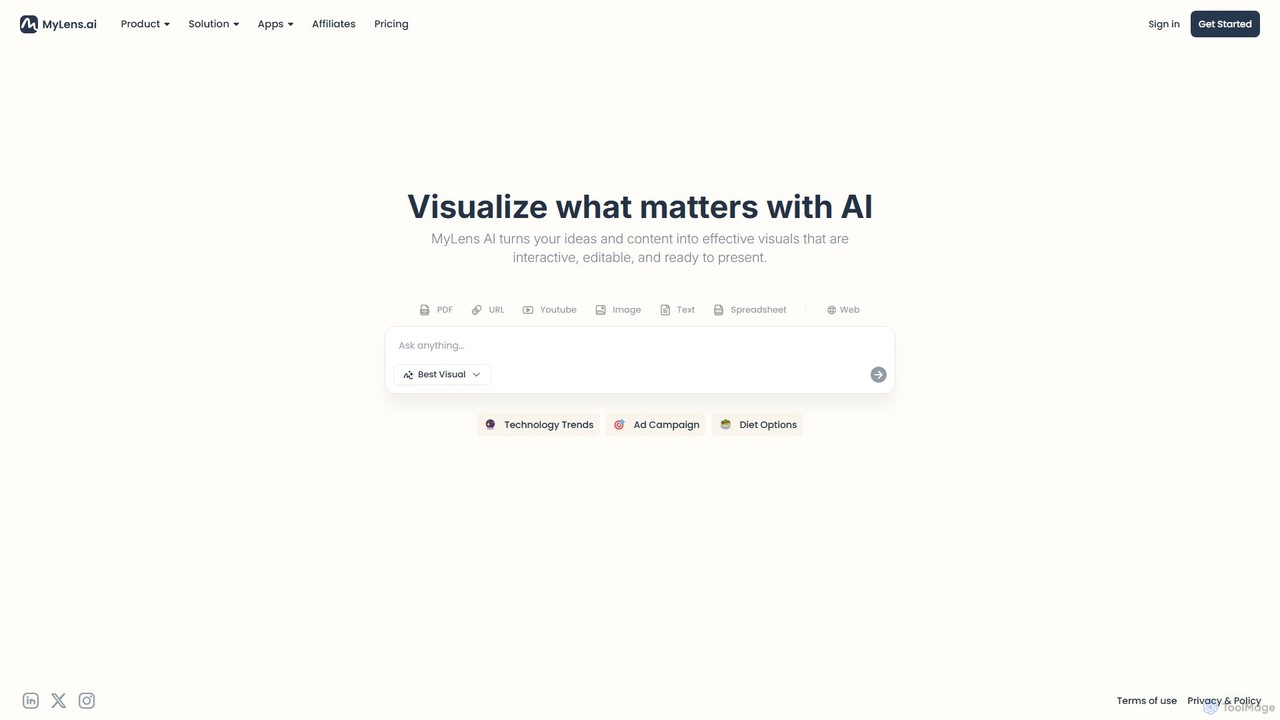
MyLens ist eine KI-gestützte Visualisierungsplattform, die Ihre Texte, Daten und Ideen in interaktive, bearbeitbare und präsentationsfertige Visuals umwandelt. Erstellen Sie mühelos beeindruckende Infografiken, Diagramme und Präsentationen, um komplexe Informationen klar und wirkungsvoll zu kommunizieren.

Infografiken
Visits 132.4KFavorites 138Likes 137
SmartVisuals
Freemium

SmartVisuals

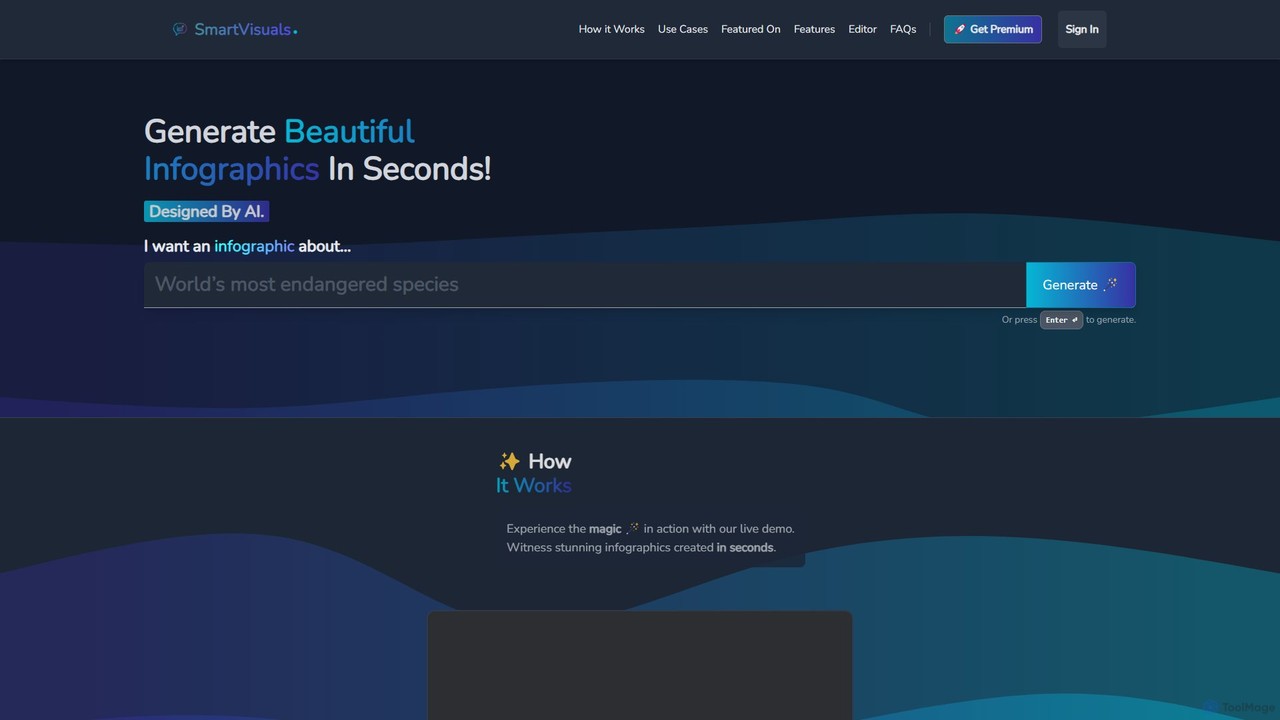
SmartVisuals ist ein KI-gestützter Infografik-Generator, der Textaufforderungen in visuell ansprechende und strukturierte Infografiken umwandelt. Beschreiben Sie einfach Ihr Thema, und die KI entwirft und füllt automatisch ein professionell aussehendes Visual, das komplexe Informationen leicht verständlich und teilbar macht. Es ist ideal für Vermarkter, Pädagogen, Studenten und Fachleute, die schnell hochwertige Visuals ohne Designkenntnisse erstellen müssen.

Infografiken
Visits 4.3KFavorites 131Likes 136
Napkin AI
Freemium

Napkin AI

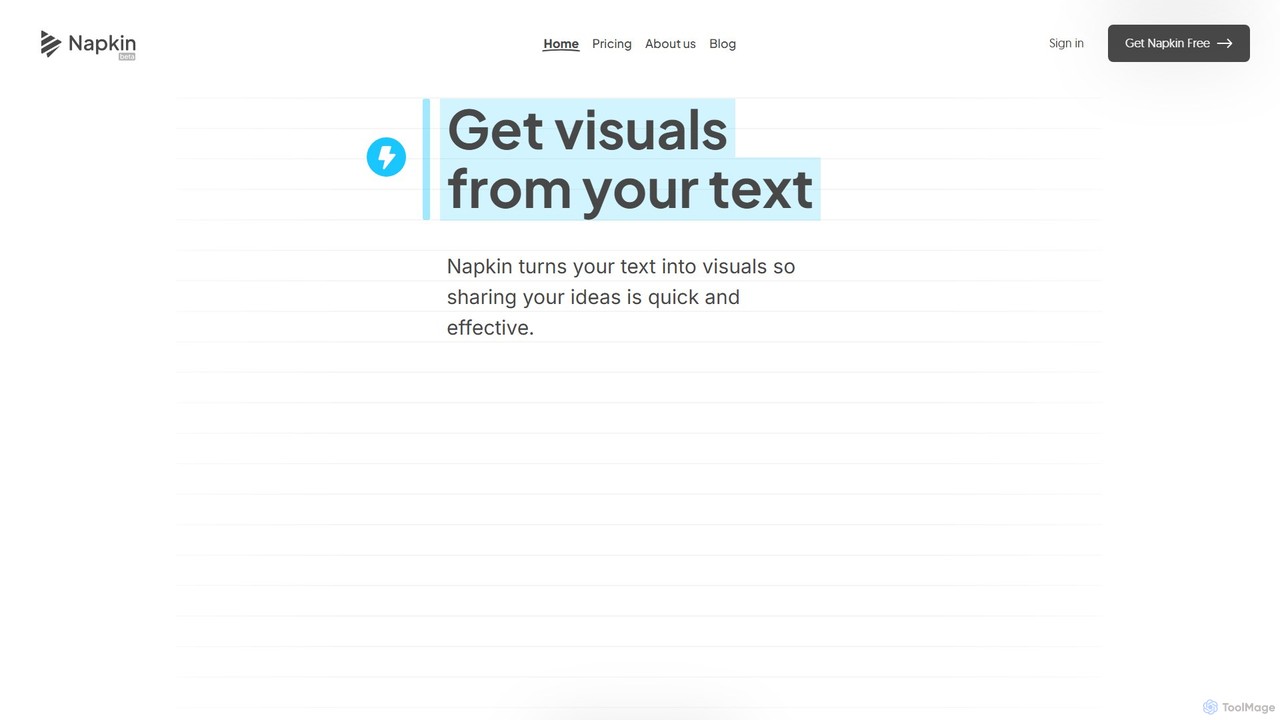
Napkin AI ist ein visuelles KI-Tool, das Ihren Text in professionelle Geschäftsvisuals wie Diagramme, Infografiken, Flussdiagramme und Mindmaps umwandelt. Es wurde für müheloses Business-Storytelling entwickelt und ermöglicht es Benutzern, überzeugende, bearbeitbare Visuals direkt aus ihrem Inhalt zu erstellen, ohne Designkenntnisse zu benötigen. Ideal für Präsentationen, Berichte und soziale Medien.
Infografiken
Visits 1.8MFavorites 100Likes 99
showthe.link
Freemium

showthe.link

showthe.link ist ein KI-gestütztes Tool, das jeden Weblink in prägnante Zusammenfassungen und ansprechende visuelle Inhalte wie Infografiken, Mindmaps oder Videoclips umwandelt. Es hilft Benutzern, die Kernideen eines Artikels oder einer Webseite schnell zu erfassen, ohne den gesamten Text zu lesen.

Infografiken
Visits 5.5KFavorites 127Likes 118
Venngage
Freemium

Venngage

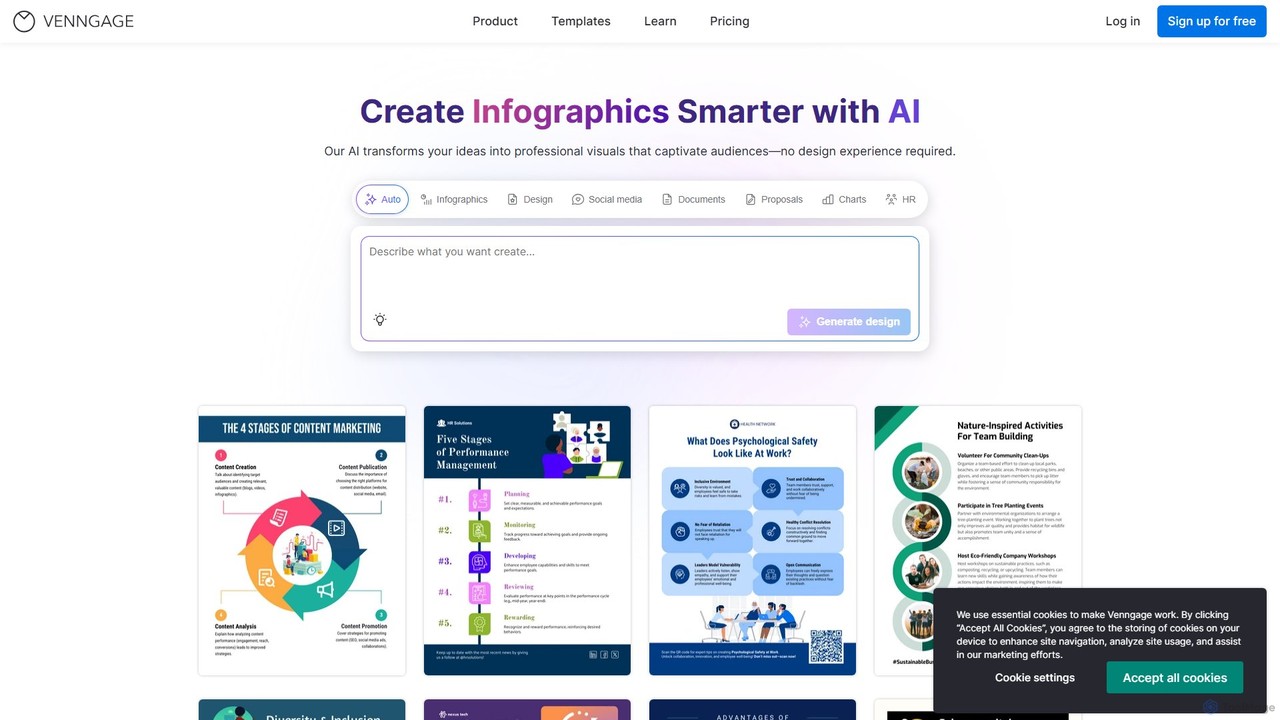
Venngage ist eine KI-gestützte Online-Designplattform, die es Benutzern ermöglicht, professionelle und ansprechende visuelle Inhalte wie Infografiken, Berichte, Präsentationen und Social-Media-Grafiken zu erstellen. Mit über 10.000 Vorlagen und intelligenten KI-Tools vereinfacht es den Designprozess und macht es auch für Nicht-Designer zugänglich, hochwertige, markenkonforme Inhalte zu produzieren. Es ist ideal für Marketing, Geschäftskommunikation und Datenvisualisierung.

Berichte
Visits 1.5MFavorites 118Likes 112
Visme
Freemium

Visme

Visme ist eine KI-gestützte All-in-One-Plattform für visuelle Kommunikation, mit der Benutzer professionelle Präsentationen, Infografiken, Datenvisualisierungen und andere Markeninhalte erstellen können. Sie wurde sowohl für Nicht-Designer als auch für Experten entwickelt und kombiniert eine benutzerfreundliche Drag-and-Drop-Oberfläche mit leistungsstarken Funktionen wie einem Marken-Kit, Team-Kollaboration und einer riesigen Bibliothek von Vorlagen und Assets, um den Prozess der Inhaltserstellung zu optimieren.

Datenvisualisierung
Visits 1.3MFavorites 114Likes 121
Piktochart
Freemium

Piktochart

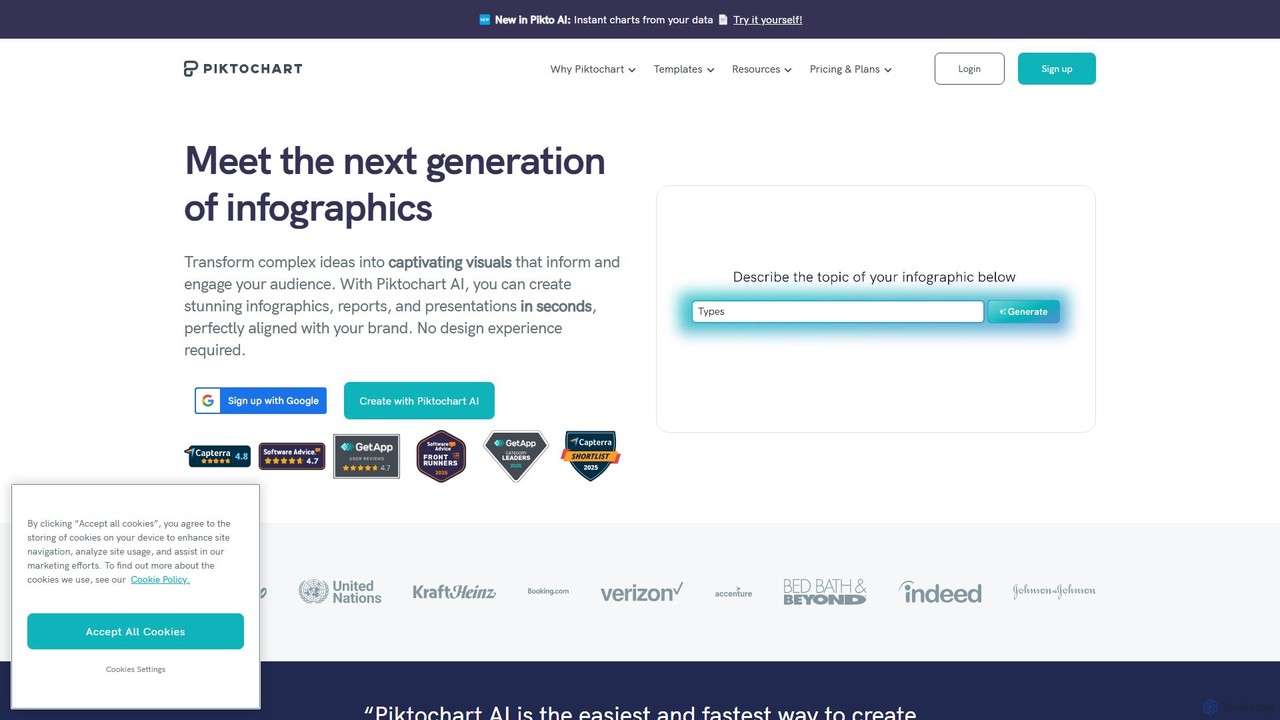
Piktochart ist ein All-in-One-Tool für visuelle Kommunikation, jetzt mit KI erweitert, zur Erstellung professioneller Infografiken, Präsentationen, Berichte und Social-Media-Grafiken. Es vereinfacht die Datenvisualisierung und das Design und ermöglicht es Benutzern, Text und Daten mühelos in überzeugende Visuals umzuwandeln, mit Funktionen für Markenkonsistenz und Teamkollaboration.

Datenvisualisierung
Visits 923.9KFavorites 167Likes 157
Outline Ninja
Paid

Outline Ninja

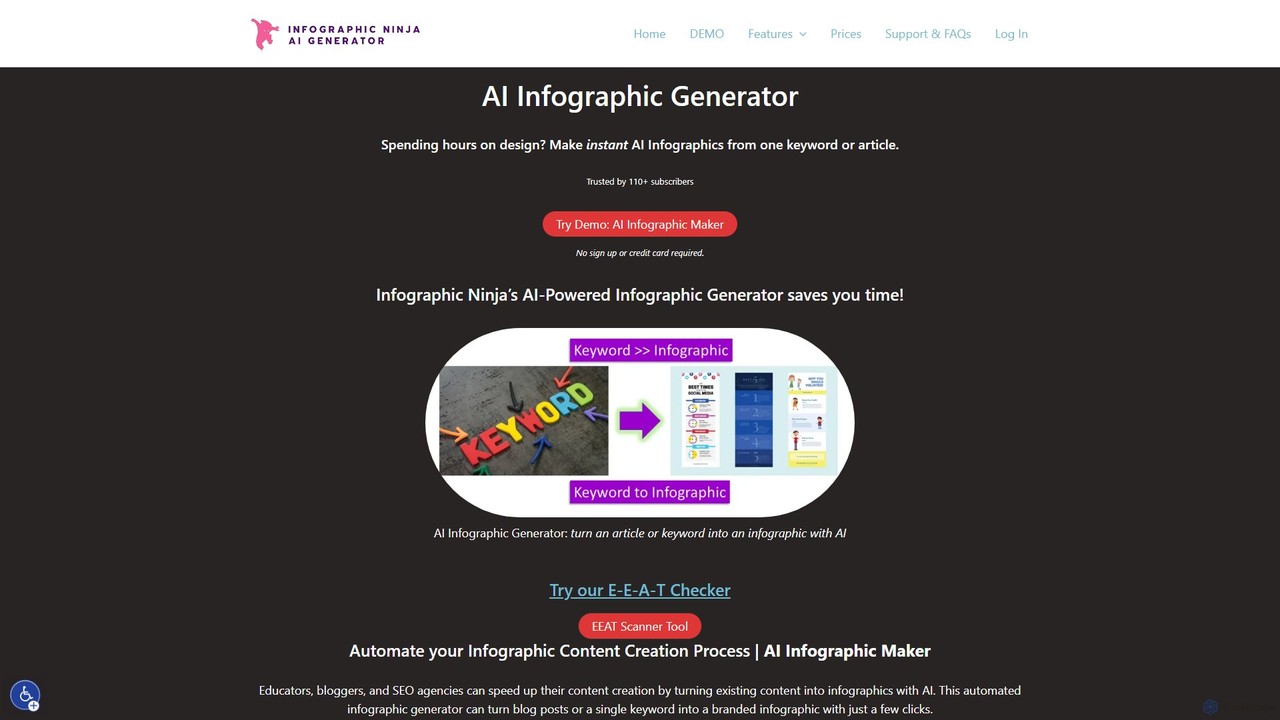
Outline Ninja ist eine umfassende KI-gestützte Suite für SEO und Content-Erstellung. Es verfügt über einen KI-Infografik-Generator, der Schlüsselwörter oder Artikel sofort in visuelle Darstellungen umwandelt. Die Suite umfasst auch ein All-in-One-Themenrecherche-Tool, einen HowTo-Schema-Generator und einen E-E-A-T-Auditor, um Bloggern, Vermarktern und Agenturen zu helfen, effizient hochrangige, umfassende Inhalte zu erstellen.

Zusammenfassen
Visits 8KFavorites 118Likes 107
Infography
Freemium

Infography

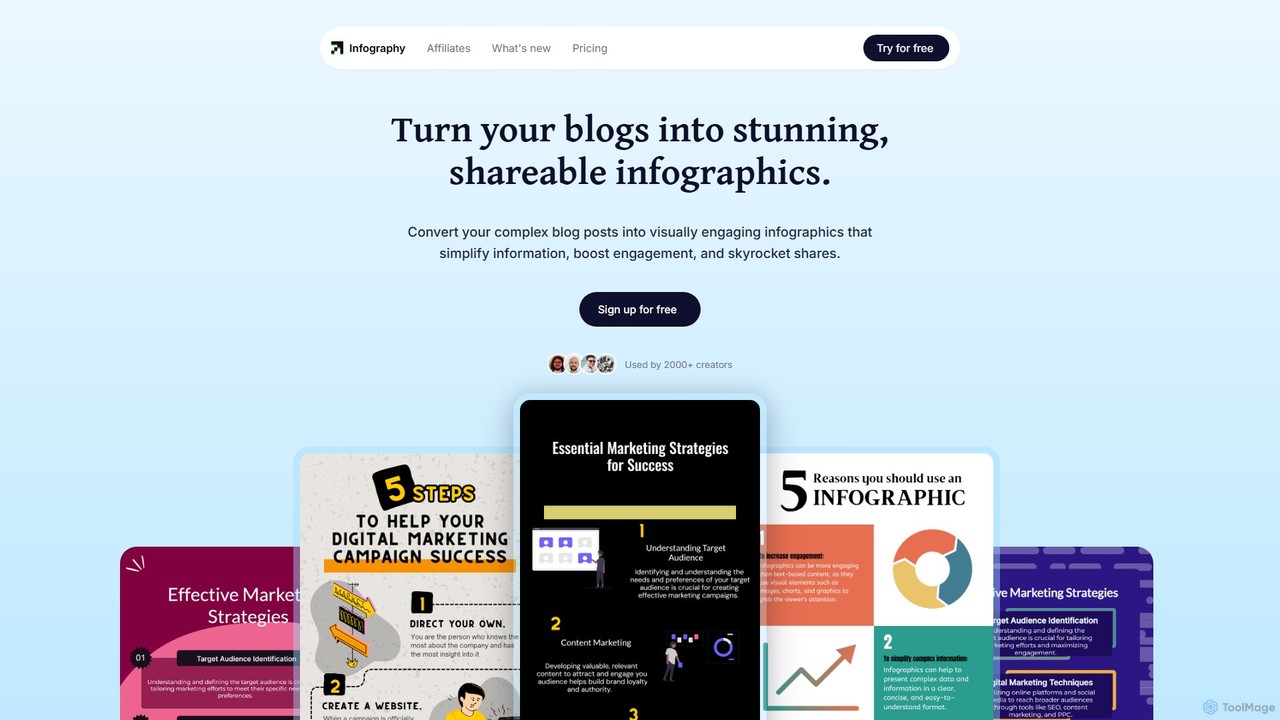
Infography ist ein KI-gestütztes Tool, das Blogbeiträge, Artikel oder einfachen Text sofort in beeindruckende, teilbare Infografiken umwandelt. Es vereinfacht komplexe Informationen, steigert das Content-Engagement und automatisiert die visuelle Erstellung, was es ideal für Vermarkter, Kreative und Unternehmen macht, die ihre Content-Strategie verbessern möchten.

Infografiken
Visits 35.6KFavorites 121Likes 129
Gaoding Design
Freemium

Gaoding Design

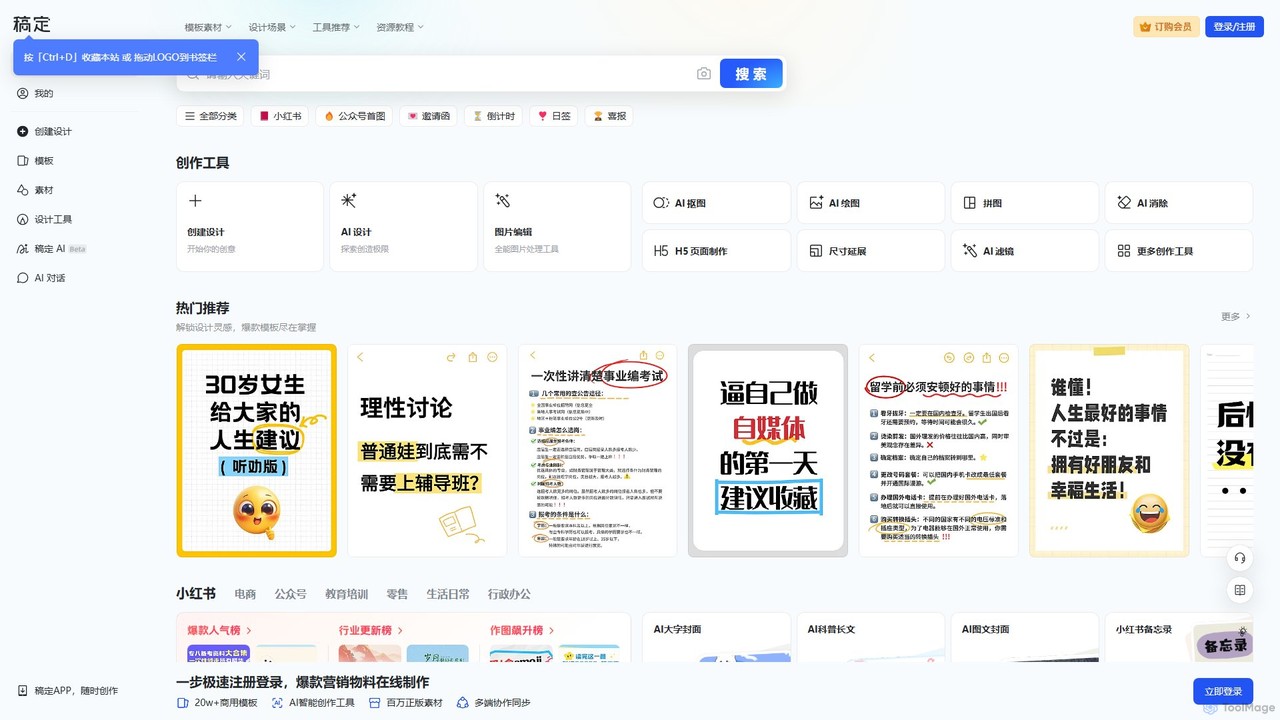
Gaoding Design ist eine All-in-One-Online-Designplattform mit KI-Unterstützung. Sie bietet eine riesige Bibliothek an Vorlagen, KI-gesteuerte Werkzeuge für die Bild- und Videobearbeitung, Inhaltserstellung und intelligente Design-Automatisierung. Ideal für Vermarkter, Content-Ersteller und Unternehmen, vereinfacht es die Erstellung professioneller Marketingmaterialien, Social-Media-Posts und Präsentationen mit kollaborativen Arbeitsabläufen.

Grafikdesign
Visits 2.7MFavorites 110Likes 117
Doc2Q
Freemium

Doc2Q

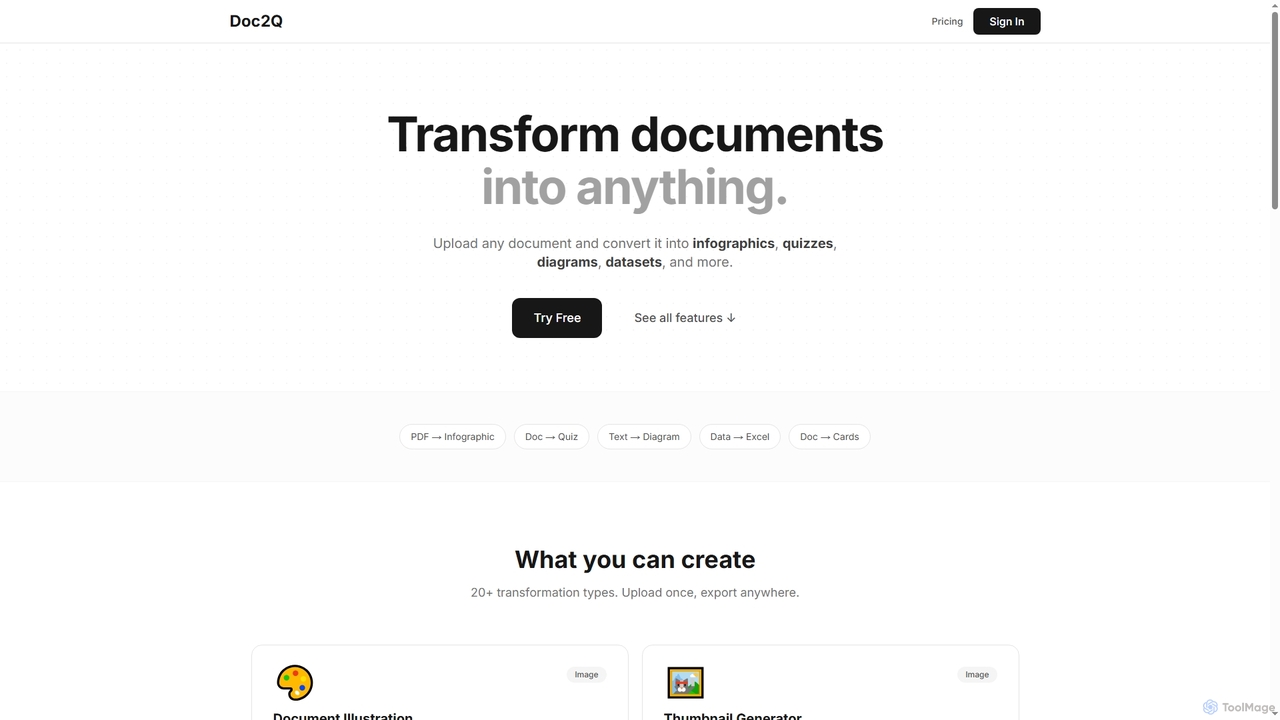
Doc2Q ist ein KI-gestütztes Tool, das Dokumente (PDF, DOCX, Bilder) in verschiedene Formate wie Infografiken, Quizze, Diagramme und Datensätze umwandelt. Es arbeitet mit einem flexiblen Pay-as-you-go-Creditsystem, das es Benutzern ermöglicht, Inhalte für Marketing, Bildung oder Datenanalyse schnell und effizient zu konvertieren.

Visualisierung
Visits 4.2KFavorites 100Likes 95
AiBiao
Freemium

AiBiao

AiBiao ist ein KI-gestütztes Werkzeug, das aus Textbeschreibungen sofort professionelle Diagramme und Schaubilder erstellt. Es optimiert die Erstellung visueller Daten für Präsentationen, Berichte und Online-Inhalte und steigert die Produktivität erheblich, indem manuelle Zeichenprozesse entfallen.

Datenvisualisierung
Visits 4.1KFavorites 119Likes 101