

ToolMage
Anmelden
Radarkit
Markenüberwachung · 12.2K monatliche besuche

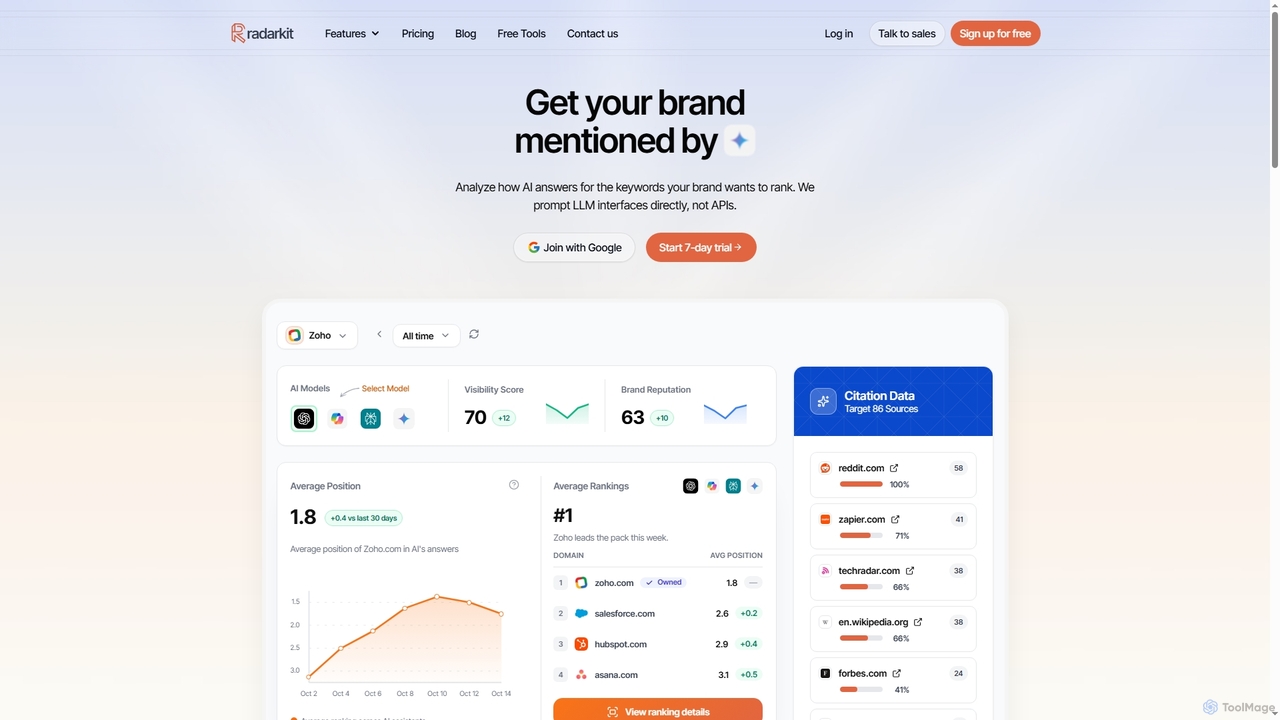
Radarkit ist ein fortschrittliches LLM-Sichtbarkeits-Tracker- und KI-Suchanalyse-Tool, das entwickelt wurde, um die Präsenz und Leistung Ihrer Marke bei wichtigen KI-Assistenten wie ChatGPT, Gemini und Perplexity zu überwachen. Es liefert umsetzbare Erkenntnisse zur Optimierung Ihrer KI-SEO-Strategie, zur Verfolgung von Wettbewerbern und zur Identifizierung wertvoller Backlink-Möglichkeiten.

VS
Visualping
Wettbewerbsintelligenz · 394.6K monatliche besuche

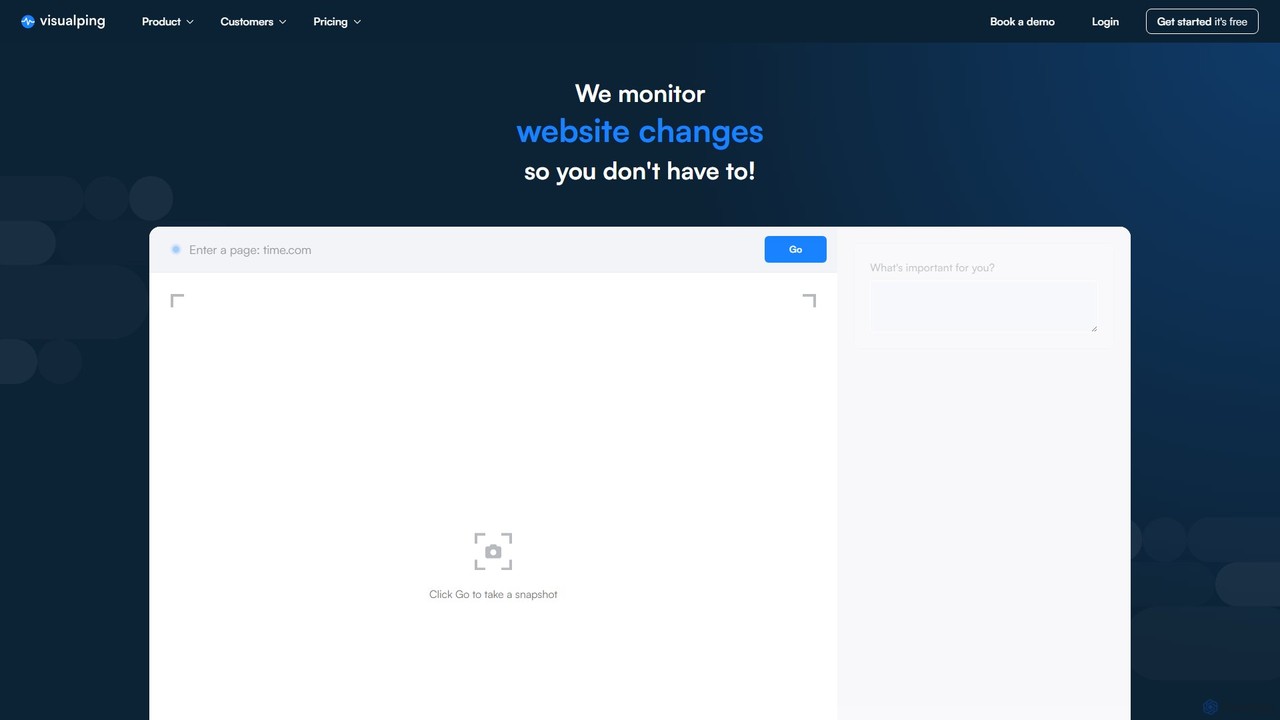
Visualping ist das führende Tool zur Erkennung und Überwachung von Website-Änderungen. Es verfolgt automatisch visuelle, textliche oder Code-Änderungen auf jeder Webseite und sendet Echtzeit-Benachrichtigungen. Ideal für Wettbewerbsbeobachtung, Preisverfolgung, Jobsuche und regulatorisches Monitoring, hilft es Nutzern und Unternehmen, ohne manuelle Überprüfungen informiert zu bleiben.

Radarkit vs Visualping: Preise, Funktionen und Traffic

Vergleiche Radarkit und Visualping nach Positionierung, Preis, Funktionen, Traffic und Nutzerfeedback.

Aktualisiert 05.08.2026

Produktübersicht

Radarkit Produktübersicht

Radarkit ist ein fortschrittliches LLM-Sichtbarkeits-Tracker- und KI-Suchanalyse-Tool, das entwickelt wurde, um die Präsenz und Leistung Ihrer Marke bei wichtigen KI-Assistenten wie ChatGPT, Gemini und Perplexity zu überwachen. Es liefert umsetzbare Erkenntnisse zur Optimierung Ihrer KI-SEO-Strategie, zur Verfolgung von Wettbewerbern und zur Identifizierung wertvoller Backlink-Möglichkeiten.
Preview

Visualping Produktübersicht

Visualping ist das führende Tool zur Erkennung und Überwachung von Website-Änderungen. Es verfolgt automatisch visuelle, textliche oder Code-Änderungen auf jeder Webseite und sendet Echtzeit-Benachrichtigungen. Ideal für Wettbewerbsbeobachtung, Preisverfolgung, Jobsuche und regulatorisches Monitoring, hilft es Nutzern und Unternehmen, ohne manuelle Überprüfungen informiert zu bleiben.

Preview

Detailed feature comparison

FeatureRadarkitVisualping
HauptkategorieMarkenüberwachungWettbewerbsintelligenz
Hinzugefügt2025-11-292025-08-06
PreismodellKostenpflichtigFreemium
Offizielle Websiteradarkit.aivisualping.io
ProdukttypWebsiteWebsite
Performance data
NutzerbewertungNicht verifiziertNicht verifiziert
Kommentare00
Monatliche Besuche12.2K394.6K
Monatliches Wachstum-10.1%10.1%
Favoriten92125
DetailsDetails ansehenDetails ansehen

Radarkit vs Visualping monthly traffic

Compare Radarkit and Visualping by monthly reach, traffic trend, visit depth, top regions, and acquisition sources.

How to interpret the traffic data

In the Radarkit vs Visualping monthly traffic comparison, Radarkit currently shows 12.2K visits and Visualping shows 394.6K; Visualping has about 32.4 times the visible traffic of Radarkit, an absolute difference of about 382.4K visits. This reflects visible reach, not feature quality or paid users.

Both tools provide verified traffic details, so monthly trends, visit depth, regions, and acquisition sources can be compared on the same basis.

Radarkit monthly traffic:

Latest traffic

Monatliche Besuche
12.2K
Ø Besuchsdauer
0:20
Seiten pro Besuch
1.56
Absprungrate
40.77%
Data updated 2026-06-15

Monthly traffic trend

  • 2026/1: 2.3K Monatliche Besuche
  • 2026/2: 3.2K Monatliche Besuche
  • 2026/3: 8.2K Monatliche Besuche
  • 2026/4: 13.5K Monatliche Besuche
  • 2026/5: 12.2K Monatliche Besuche

Top-Regionen

Top 5 countries/regions
Country/regionPercentageTraffic
🇺🇸United States30.11%3.7K
🇮🇳India26.82%3.3K
🇩🇪Germany19.38%2.4K
🇬🇧United Kingdom14.29%1.7K
🇵🇰Pakistan9.4%1.1K

Suchbegriffe

athenahqllmrefsradarkitradarkit airadarkit pricing

Visualping monthly traffic:

Latest traffic

Monatliche Besuche
394.6K
Ø Besuchsdauer
1:50
Seiten pro Besuch
3.84
Absprungrate
36.02%
Data updated 2026-06-15

Monthly traffic trend

  • 2025/9: 331.3K Monatliche Besuche
  • 2026/1: 369.7K Monatliche Besuche
  • 2026/2: 368.8K Monatliche Besuche
  • 2026/3: 399.1K Monatliche Besuche
  • 2026/4: 358.3K Monatliche Besuche
  • 2026/5: 394.6K Monatliche Besuche

Top-Regionen

Top 5 countries/regions
Country/regionPercentageTraffic
🇺🇸United States55.56%219.2K
🇨🇦Canada19.98%78.8K
🇬🇧United Kingdom10.03%39.6K
🇩🇪Germany8%31.6K
🇮🇳India6.43%25.4K

Traffic-Quellen

Source typePercentageTraffic
Direkt70.78%279.3K
E-Mail20.5%80.9K
Verweis8.72%34.4K

Suchbegriffe

distill web monitorremove a target from visualpingvisual pingvisualpingvisualping test webhooks
Traffic-based selection guidance: If public market visibility is an important first-pass criterion, investigate Visualping first. The final choice should still follow taxonomy, use case, and a real trial because higher traffic does not prove broader capabilities or better workflow fit.

Usage comparison

Compare the core capabilities of Radarkit and Visualping

Radarkit Core features

Wettbewerbsintelligenz
SEO
Markenüberwachung

Visualping Core features

Wettbewerbsintelligenz
SEO
Daten
Überwachung

Use cases

Radarkit Use cases

KI-Assistenten
KI-Suchanalysen
KI-SEO
Backlink-Aufbau
Markenüberwachung
ChatGPT
Wettbewerbsanalyse
digitales Marketing
Gemini
Generative Engine-Optimierung
LLM-Sichtbarkeit
Microsoft Copilot
Perplexity
Suchmaschinenoptimierung

Visualping Use cases

Automatisierung
Änderungsdetektion
Wettbewerbsintelligenz
Job-Benachrichtigung
Preis-Tracker
Regulierungsverfolgung
SEO-Überwachung
Web Scraping
Website-Überwachung

Best suited roles

Radarkit Best suited roles

Markenmanager
Business Analyst
Content Creator
Digitalstratege
Marketing Manager
PR-Spezialist
SEO-Spezialist

Visualping Best suited roles

Keine verifizierten Daten

Radarkit vs Visualping:In-depth comparison and selection guidance

First decide whether the products solve the same kind of need

This in-depth Radarkit vs Visualping comparison uses only the product records, taxonomy, audience, traffic, and community signals available on this page. Radarkit is primarily listed under “Markenüberwachung”, while Visualping is primarily listed under “Wettbewerbsintelligenz”, so the first decision is whether your actual task matches their recorded scope.

The structured fields currently show these decision-relevant differences: Primary category (Radarkit: Markenüberwachung; Visualping: Wettbewerbsintelligenz); Pricing (Radarkit: Paid; Visualping: Freemium); Monthly visits (Radarkit: 12.2K; Visualping: 394.6K); Monthly growth (Radarkit: -10.1%; Visualping: 10.1%); Favorites (Radarkit: 92; Visualping: 125). These facts are more useful for selection than brand visibility alone.

What market visibility and monthly traffic mean

In the Radarkit vs Visualping monthly traffic comparison, Radarkit currently shows 12.2K visits and Visualping shows 394.6K; Visualping has about 32.4 times the visible traffic of Radarkit, an absolute difference of about 382.4K visits. This reflects visible reach, not feature quality or paid users.

Both tools provide verified traffic details, so monthly trends, visit depth, regions, and acquisition sources can be compared on the same basis.

If public market visibility is an important first-pass criterion, investigate Visualping first. The final choice should still follow taxonomy, use case, and a real trial because higher traffic does not prove broader capabilities or better workflow fit.

Product positioning, use cases, and roles

Radarkit and Visualping currently overlap in shared categories: Wettbewerbsintelligenz und SEO. This can place both on the same shortlist, but it does not prove equal implementation, depth, or cost.

Radarkit's unique categories/tags are Markenüberwachung, KI-Assistenten, KI-Suchanalysen, KI-SEO, Backlink-Aufbau, ChatGPT, Wettbewerbsanalyse und digitales Marketing; Visualping's are Daten, Überwachung, Automatisierung, Änderungsdetektion, Wettbewerbsintelligenz, Job-Benachrichtigung, Preis-Tracker und Regulierungsverfolgung. These unique fields are the strongest differentiators: validate the product whose recorded scope matches the task instead of following traffic alone.

What ratings, comments, and favorites can tell you

Radarkit has no verified rating, 0 comments, 92 favorites, and 93 likes;Visualping has no verified rating, 0 comments, 125 favorites, and 116 likes。

Neither product has enough rating or comment samples for a credible reputation ranking.

Selection guidance by actual need

When to evaluate Radarkit first

Put Radarkit on the priority trial list when the task aligns with “Markenüberwachung” and especially Markenüberwachung, KI-Assistenten, KI-Suchanalysen, KI-SEO, Backlink-Aufbau und ChatGPT, or the users include Markenmanager, Business Analyst, Content Creator und Digitalstratege. This follows recorded positioning and does not imply unlisted capabilities are absent.

Radarkit also currently records: pricing is paid, product type is website, 12.2K verified monthly visits, no verified user rating. Verify any hard requirement around price, platform, or reach before trial, and do not let sparse review data substitute for testing.

When to evaluate Visualping first

Put Visualping on the priority trial list when the task aligns with “Wettbewerbsintelligenz” and especially Daten, Überwachung, Automatisierung, Änderungsdetektion, Wettbewerbsintelligenz und Job-Benachrichtigung. This follows recorded positioning and does not imply unlisted capabilities are absent.

Visualping also currently records: pricing is freemium, product type is website, 394.6K verified monthly visits, no verified user rating. Verify any hard requirement around price, platform, or reach before trial, and do not let sparse review data substitute for testing.

How to validate the recommendation before deciding

The available data describes positioning, public visibility, and community signals, but it cannot prove output quality, speed, integration effort, privacy, or long-term cost in your workflow. Before deciding, run the same representative tasks in Radarkit and Visualping, then record completion time, accuracy, manual corrections, and the real paid threshold. A like-for-like trial turns this comparison into a defensible adoption decision.

Vergleichs-FAQ

How should I choose between Radarkit and Visualping?
Compare positioning, pricing, taxonomy, and traffic maturity, then verify the latest details on each official website.
Where does this comparison data come from?
The factual baseline is derived from product, taxonomy, traffic, and community data. Reviewed editorial conclusions show their source and verification date.
What do unknown fields mean?
Unknown means there is not enough reliable evidence; the page does not fill gaps with assumptions.