ToolMage
Anmelden
splotch
Prozessmanagement · 811 monatliche besuche

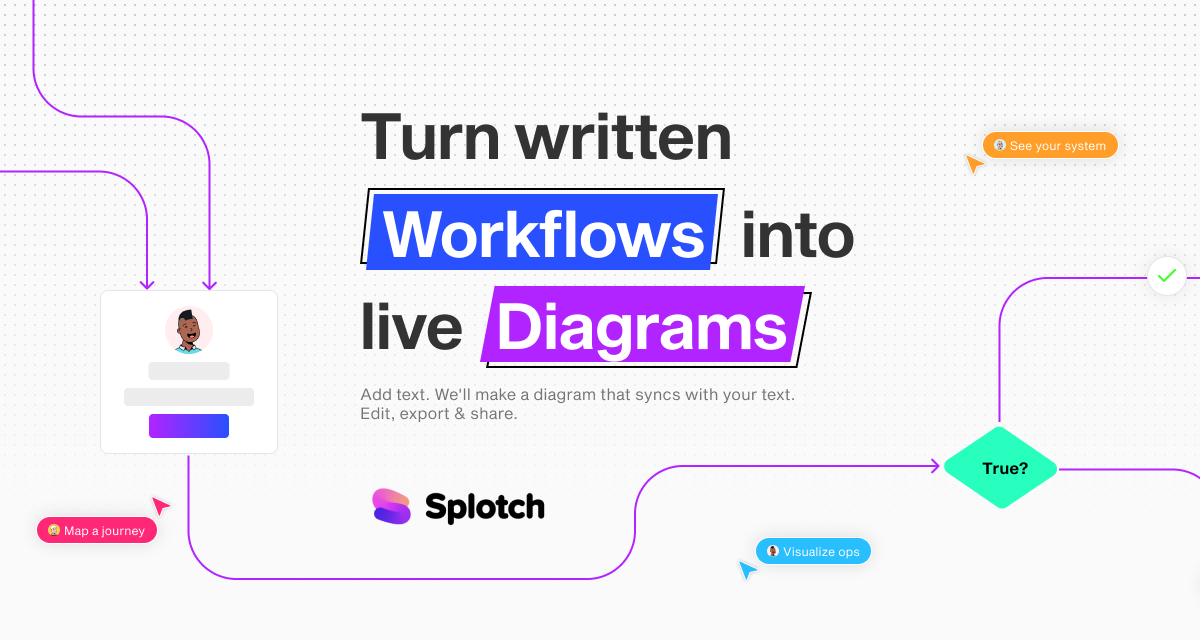
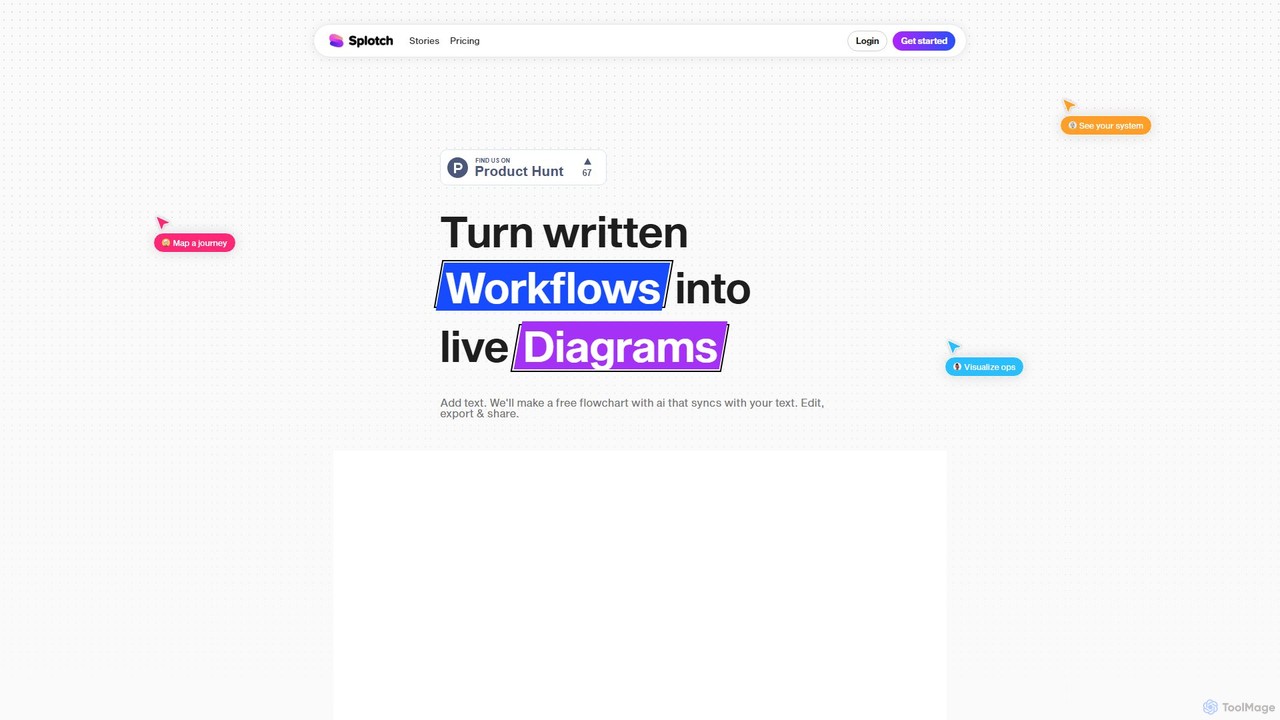
splotch ist ein KI-gestütztes Diagrammwerkzeug, das geschriebenen Text, Prozesse und Arbeitsabläufe automatisch in klare, bearbeitbare Flussdiagramme und Diagramme umwandelt. Es verfügt über eine einzigartige Zwei-Wege-Synchronisation, die sicherstellt, dass Ihr Text und Ihre visuellen Darstellungen immer aufeinander abgestimmt sind, was die Kommunikation und Prozessdokumentation optimiert.

VS
Text to Flowchart
Prozessmanagement · 4.5K monatliche besuche

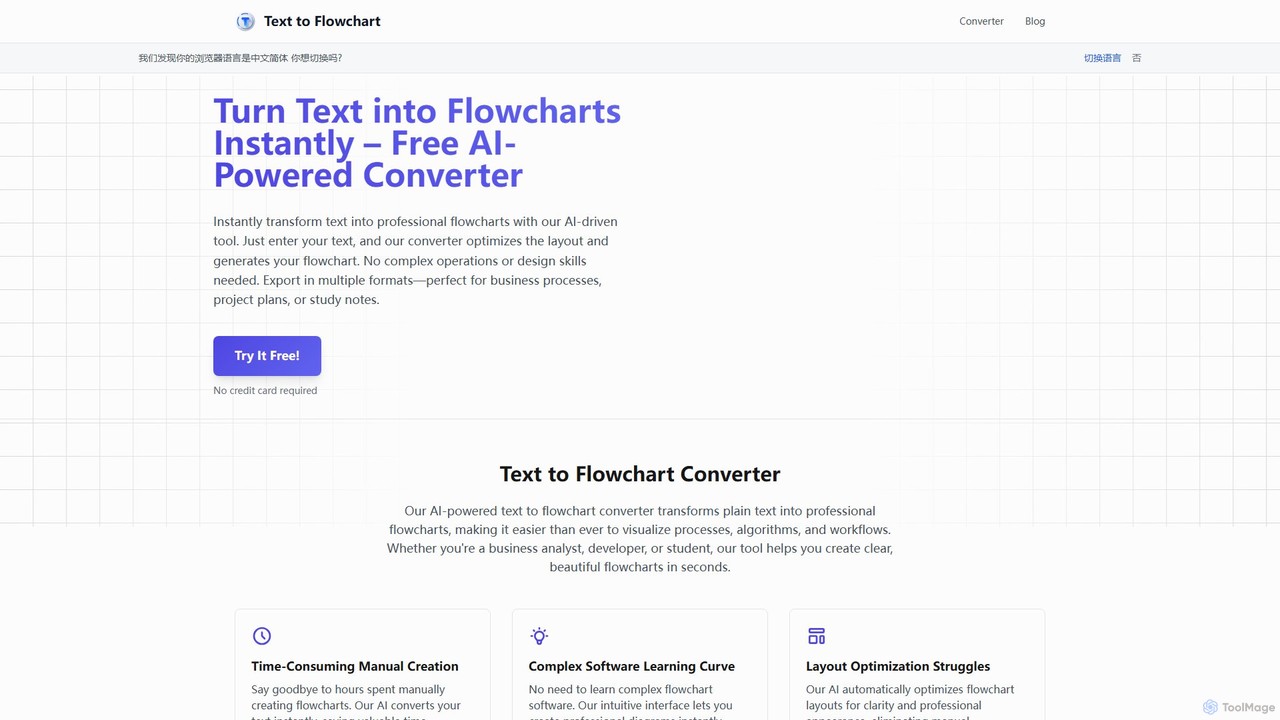
Ein KI-gestütztes Werkzeug, das einfache Textbeschreibungen sofort in professionelle, gut strukturierte Flussdiagramme und Diagramme umwandelt. Ideal für Entwickler, Geschäftsanalysten und Studenten, vereinfacht es die Visualisierung von Prozessen, Algorithmen und Arbeitsabläufen ohne Designkenntnisse.

splotch vs Text to Flowchart: Preise, Funktionen und Traffic

Vergleiche splotch und Text to Flowchart nach Positionierung, Preis, Funktionen, Traffic und Nutzerfeedback.

Aktualisiert 23.08.2026

Produktübersicht

splotch Produktübersicht

splotch ist ein KI-gestütztes Diagrammwerkzeug, das geschriebenen Text, Prozesse und Arbeitsabläufe automatisch in klare, bearbeitbare Flussdiagramme und Diagramme umwandelt. Es verfügt über eine einzigartige Zwei-Wege-Synchronisation, die sicherstellt, dass Ihr Text und Ihre visuellen Darstellungen immer aufeinander abgestimmt sind, was die Kommunikation und Prozessdokumentation optimiert.
Preview

Text to Flowchart Produktübersicht

Ein KI-gestütztes Werkzeug, das einfache Textbeschreibungen sofort in professionelle, gut strukturierte Flussdiagramme und Diagramme umwandelt. Ideal für Entwickler, Geschäftsanalysten und Studenten, vereinfacht es die Visualisierung von Prozessen, Algorithmen und Arbeitsabläufen ohne Designkenntnisse.

Preview

Detailed feature comparison

FeaturesplotchText to Flowchart
HauptkategorieProzessmanagementProzessmanagement
Hinzugefügt2025-08-042025-08-01
PreismodellFreemiumFreemium
Offizielle Websitewww.splotch.inktexttoflowchart.com
ProdukttypWebsiteWebsite
Performance data
NutzerbewertungNicht verifiziertNicht verifiziert
Kommentare00
Monatliche Besuche8114.5K
Monatliches Wachstum-76.7%Nicht verifiziert
Favoriten110131
DetailsDetails ansehenDetails ansehen

splotch vs Text to Flowchart monthly traffic

Compare splotch and Text to Flowchart by monthly reach, traffic trend, visit depth, top regions, and acquisition sources.

How to interpret the traffic data

In the splotch vs Text to Flowchart monthly traffic comparison, splotch currently shows 811 visits and Text to Flowchart shows 4.5K; Text to Flowchart has about 5.6 times the visible traffic of splotch, an absolute difference of about 3.7K visits. This reflects visible reach, not feature quality or paid users.

Only splotch has complete third-party traffic details; Text to Flowchart uses visits recorded inside ToolMage. These scopes cannot estimate market share directly, and on-site views should not be treated as the product’s total website traffic.

splotch monthly traffic:

Latest traffic

Monatliche Besuche
811
Ø Besuchsdauer
0:32
Seiten pro Besuch
1.71
Absprungrate
34.9%
Data updated 2026-06-15

Monthly traffic trend

  • 2025/9: 2.7K Monatliche Besuche
  • 2026/1: 5K Monatliche Besuche
  • 2026/2: 3K Monatliche Besuche
  • 2026/3: 3.2K Monatliche Besuche
  • 2026/4: 3.5K Monatliche Besuche
  • 2026/5: 811 Monatliche Besuche

Top-Regionen

Top 5 countries/regions
Country/regionPercentageTraffic
🇺🇸United States74.06%601
🇨🇦Canada25.94%210

Suchbegriffe

ai flowchartflowchart aiflowchart generatorgoogle flowchartsplotch

Text to Flowchart monthly traffic:

Latest traffic

Monatliche Besuche
4.5K
Traffic-based selection guidance: The current traffic scope is not sufficient for a reliable product ranking. Treat monthly visits as a market-interest signal, then decide using taxonomy, use cases, pricing, and a like-for-like trial rather than reading exposure as product capability.

Usage comparison

Compare the core capabilities of splotch and Text to Flowchart

splotch Core features

Prozessmanagement
Diagrammerstellung
Prototyping
Vertriebsunterstützung

Text to Flowchart Core features

Prozessmanagement
Diagrammerstellung
Planung

Use cases

splotch Use cases

Diagrammerstellung
Flussdiagramm-Generator
Prozessmapping
Text zu Diagramm
KI-Diagramm
Standardarbeitsanweisung
Systemdesign
User Journey Mapping
Workflow-Automatisierung

Text to Flowchart Use cases

Diagrammerstellung
Flussdiagramm-Generator
Prozessmapping
Text zu Diagramm
KI-Flussdiagramm
Geschäftsanalyse
Entwicklerwerkzeuge
Produktivität
Workflow-Visualisierung

splotch vs Text to Flowchart:In-depth comparison and selection guidance

First decide whether the products solve the same kind of need

This in-depth splotch vs Text to Flowchart comparison uses only the product records, taxonomy, audience, traffic, and community signals available on this page. splotch is primarily listed under “Prozessmanagement”, while Text to Flowchart is primarily listed under “Prozessmanagement”, so the first decision is whether your actual task matches their recorded scope.

The structured fields currently show these decision-relevant differences: Monthly visits (splotch: 811; Text to Flowchart: 4.5K); Favorites (splotch: 110; Text to Flowchart: 131); Website (splotch: www.splotch.ink; Text to Flowchart: texttoflowchart.com); Added (splotch: 2025-08-04; Text to Flowchart: 2025-08-01). These facts are more useful for selection than brand visibility alone.

What market visibility and monthly traffic mean

In the splotch vs Text to Flowchart monthly traffic comparison, splotch currently shows 811 visits and Text to Flowchart shows 4.5K; Text to Flowchart has about 5.6 times the visible traffic of splotch, an absolute difference of about 3.7K visits. This reflects visible reach, not feature quality or paid users.

Only splotch has complete third-party traffic details; Text to Flowchart uses visits recorded inside ToolMage. These scopes cannot estimate market share directly, and on-site views should not be treated as the product’s total website traffic.

The current traffic scope is not sufficient for a reliable product ranking. Treat monthly visits as a market-interest signal, then decide using taxonomy, use cases, pricing, and a like-for-like trial rather than reading exposure as product capability.

Product positioning, use cases, and roles

splotch and Text to Flowchart currently overlap in shared categories: Prozessmanagement und Diagrammerstellung; shared tags: Diagrammerstellung, Flussdiagramm-Generator, Prozessmapping und Text zu Diagramm. This can place both on the same shortlist, but it does not prove equal implementation, depth, or cost.

splotch's unique categories/tags are Prototyping, Vertriebsunterstützung, KI-Diagramm, Standardarbeitsanweisung, Systemdesign, User Journey Mapping und Workflow-Automatisierung; Text to Flowchart's are Planung, KI-Flussdiagramm, Geschäftsanalyse, Entwicklerwerkzeuge, Produktivität und Workflow-Visualisierung. These unique fields are the strongest differentiators: validate the product whose recorded scope matches the task instead of following traffic alone.

What ratings, comments, and favorites can tell you

splotch has no verified rating, 0 comments, 110 favorites, and 104 likes;Text to Flowchart has no verified rating, 0 comments, 131 favorites, and 113 likes。

Neither product has enough rating or comment samples for a credible reputation ranking.

Selection guidance by actual need

When to evaluate splotch first

Put splotch on the priority trial list when the task aligns with “Prozessmanagement” and especially Prototyping, Vertriebsunterstützung, KI-Diagramm, Standardarbeitsanweisung, Systemdesign und User Journey Mapping. This follows recorded positioning and does not imply unlisted capabilities are absent.

splotch also currently records: pricing is freemium, product type is website, 811 verified monthly visits, no verified user rating. Verify any hard requirement around price, platform, or reach before trial, and do not let sparse review data substitute for testing.

When to evaluate Text to Flowchart first

Put Text to Flowchart on the priority trial list when the task aligns with “Prozessmanagement” and especially Planung, KI-Flussdiagramm, Geschäftsanalyse, Entwicklerwerkzeuge, Produktivität und Workflow-Visualisierung. This follows recorded positioning and does not imply unlisted capabilities are absent.

Text to Flowchart also currently records: pricing is freemium, product type is website, 4.5K on-site monthly views, no verified user rating. Verify any hard requirement around price, platform, or reach before trial, and do not let sparse review data substitute for testing.

How to validate the recommendation before deciding

The available data describes positioning, public visibility, and community signals, but it cannot prove output quality, speed, integration effort, privacy, or long-term cost in your workflow. Before deciding, run the same representative tasks in splotch and Text to Flowchart, then record completion time, accuracy, manual corrections, and the real paid threshold. A like-for-like trial turns this comparison into a defensible adoption decision.

Vergleichs-FAQ

How should I choose between splotch and Text to Flowchart?
Compare positioning, pricing, taxonomy, and traffic maturity, then verify the latest details on each official website.
Where does this comparison data come from?
The factual baseline is derived from product, taxonomy, traffic, and community data. Reviewed editorial conclusions show their source and verification date.
What do unknown fields mean?
Unknown means there is not enough reliable evidence; the page does not fill gaps with assumptions.

Related AI tools

aiflowchart
Freemium

aiflowchart

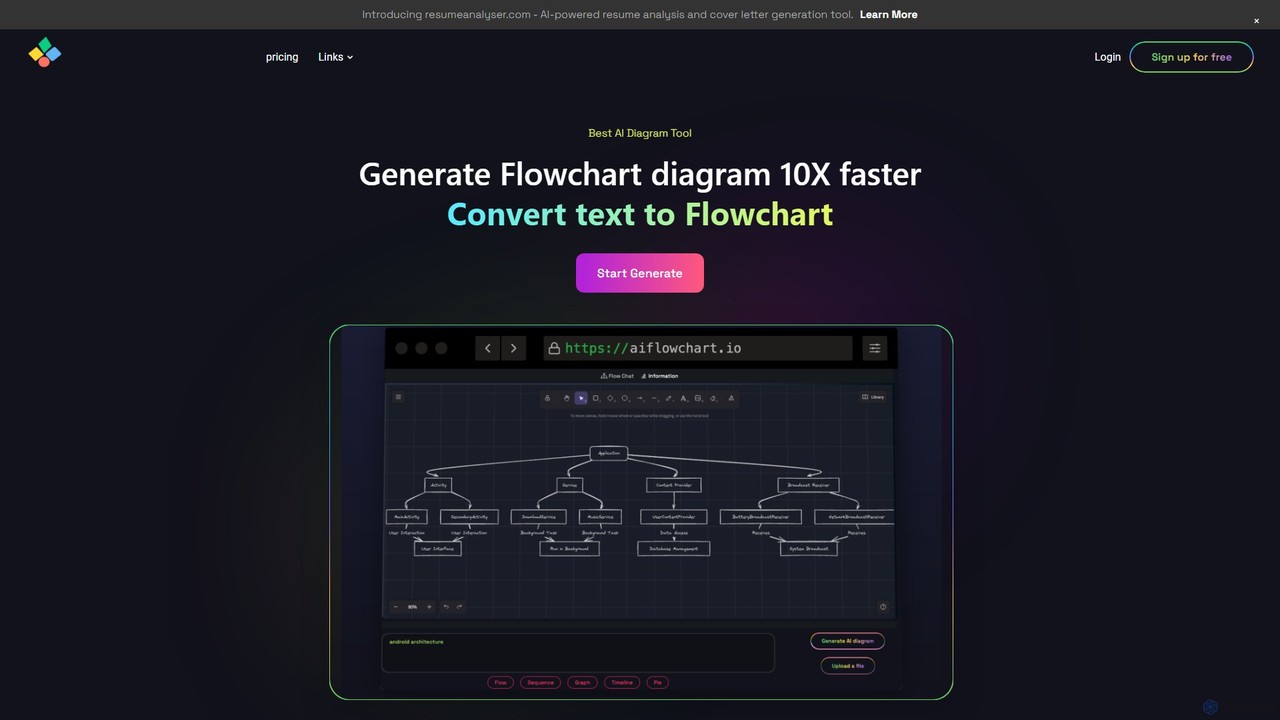
Ein KI-gestütztes Diagrammwerkzeug, das automatisch Flussdiagramme, Sequenzdiagramme, Kuchendiagramme und mehr aus Text, PDFs oder Blog-Inhalten generiert. Es nutzt Modelle wie GPT-4o, um einzigartige, anpassbare Diagramme mit Erklärungen zu erstellen und den Benutzern erheblich Zeit und Mühe zu sparen.

Visualisierung
Visits 5.7KFavorites 91Likes 86
snapdiagram
Freemium

snapdiagram

SnapDiagram ist ein KI-gestütztes Werkzeug, das Textbeschreibungen sofort in professionelle Diagramme umwandelt. Erstellen Sie Flussdiagramme, Sequenzdiagramme, UML-Modelle, Mindmaps und mehr mit einfachen natürlichsprachlichen Anweisungen. Es wurde entwickelt, um Arbeitsabläufe für Entwickler, Geschäftsanalysten und Projektmanager durch die Automatisierung des Diagrammerstellungsprozesses zu beschleunigen.

Workflow-Management
Visits 4.5KFavorites 121Likes 117
Lucidchart
Freemium

Lucidchart

Lucidchart ist eine intelligente Diagramm- und visuelle Kollaborationsplattform, die KI, Datenautomatisierung und Echtzeit-Teamarbeit nutzt, um Benutzern bei der Visualisierung komplexer Systeme, Prozesse und Ideen zu helfen. Sie ermöglicht es Teams, professionelle Flussdiagramme, Organigramme, Netzwerkdiagramme und mehr zu erstellen, um Klarheit zu schaffen und Innovationen voranzutreiben.

Projektmanagement
Visits 2.4MFavorites 130Likes 118
Docugram
Freemium

Docugram

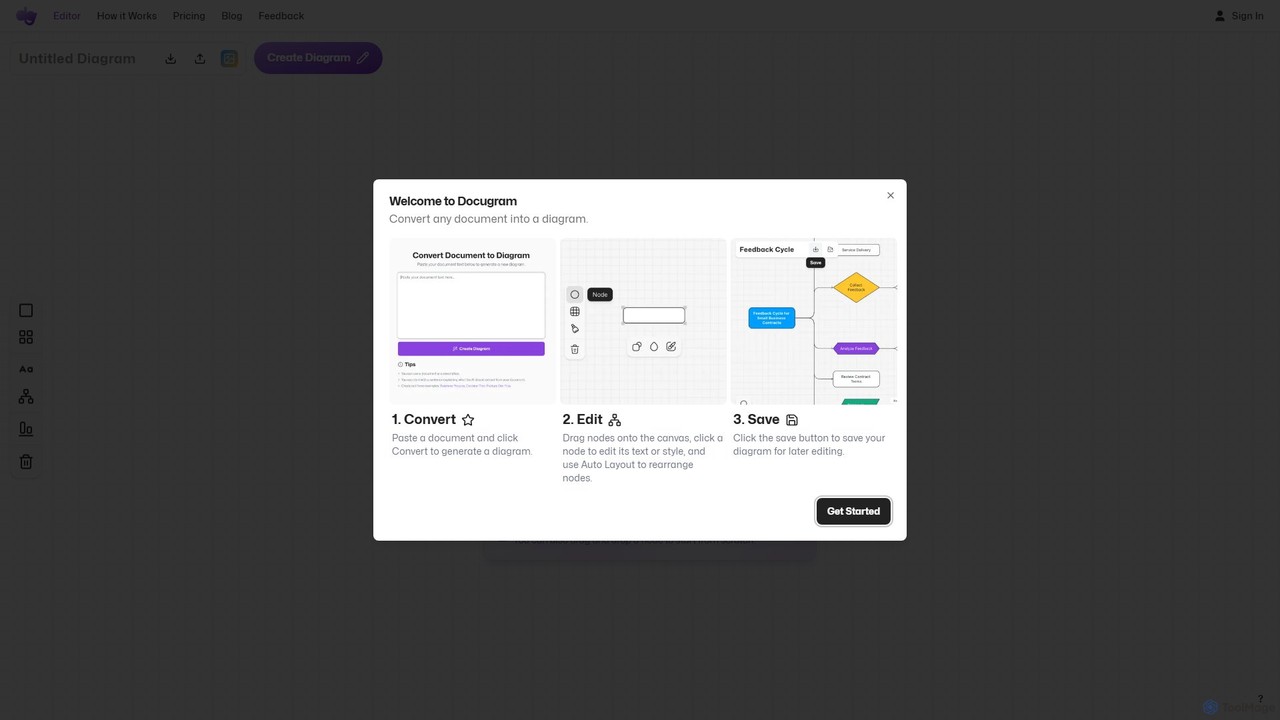
Docugram ist ein KI-gestütztes Werkzeug, das Textdokumente, Notizen und Anweisungen sofort in klare, bearbeitbare Diagramme und Flussdiagramme umwandelt. Es optimiert Arbeitsabläufe, indem es komplexe Informationen aus Formaten wie Word, Excel und PDF in visuelle Karten konvertiert und so die Produktivität von Fachleuten im Projektmanagement, in der Entwicklung und in der Geschäftsanalyse steigert.

Projektmanagement
Visits 7.4KFavorites 116Likes 112
Sketch2scheme
Paid

Sketch2scheme

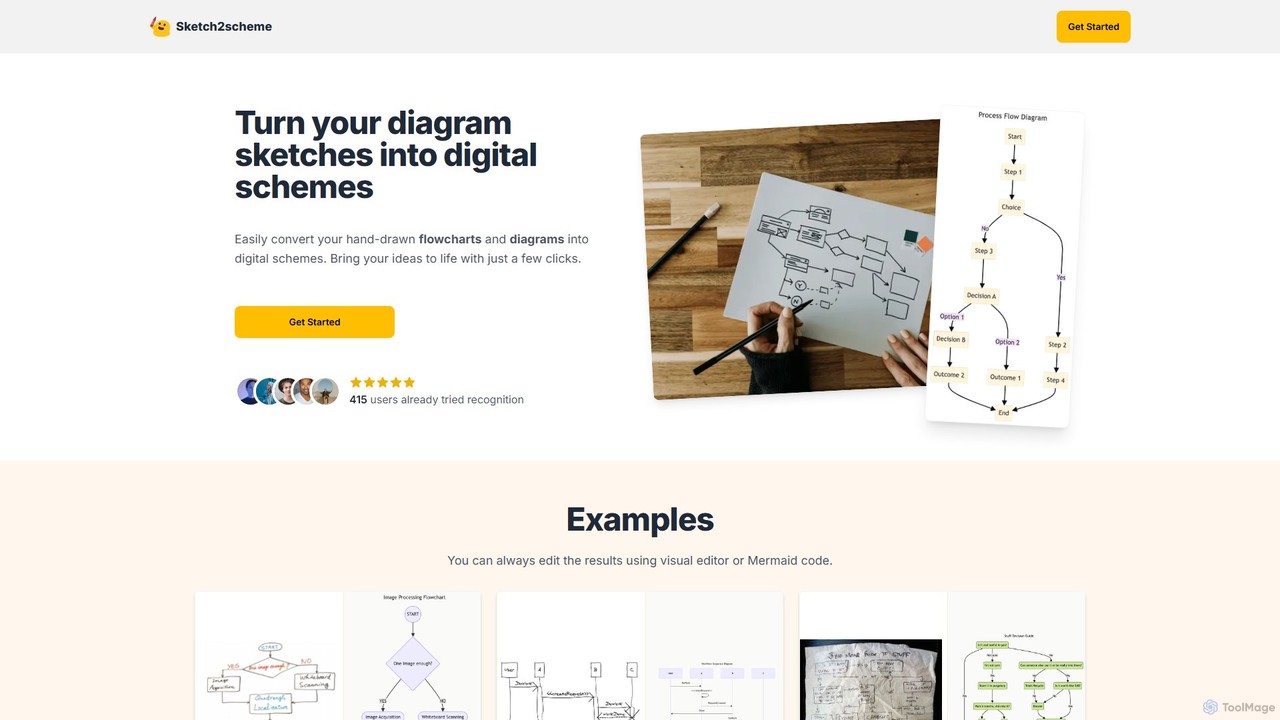
Sketch2scheme ist ein KI-gestütztes Werkzeug, das Ihre handgezeichneten Diagrammskizzen mühelos in ausgefeilte, bearbeitbare digitale Schemata umwandelt. Laden Sie einfach ein Bild Ihres Flussdiagramms oder Diagramms hoch, und die KI erkennt Knoten, Verbindungen und Text und verwandelt Ihre analogen Ideen in Sekundenschnelle in digitale Assets. Es ist perfekt für Entwickler, Projektmanager und Studenten, die die Lücke zwischen dem Brainstorming auf Papier und der digitalen Umsetzung schließen möchten.

Prototyping
Visits 6.5KFavorites 154Likes 170
ChatUML
Freemium

ChatUML

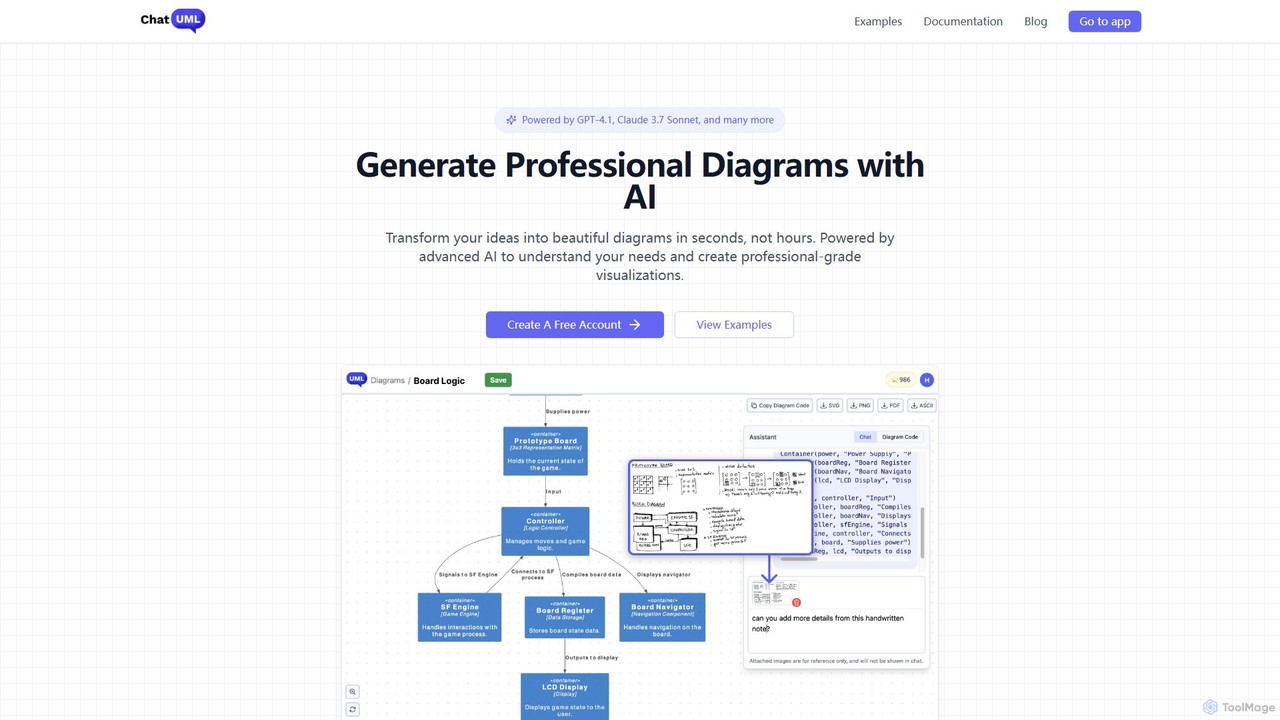
ChatUML ist ein KI-gestützter Diagrammgenerator, der Textbeschreibungen, handgezeichnete Skizzen und sogar Website-Inhalte in Sekundenschnelle in professionelle Diagramme umwandelt. Durch die Nutzung von Modellen wie GPT-4.1 und Claude 3 unterstützt es verschiedene Formate wie UML, C4-Architektur, Mindmaps und mehr und optimiert den Visualisierungsprozess für Entwickler, Projektmanager und Kreativteams.

Planung
Visits 26.1KFavorites 109Likes 116
Dezyn
Freemium

Dezyn

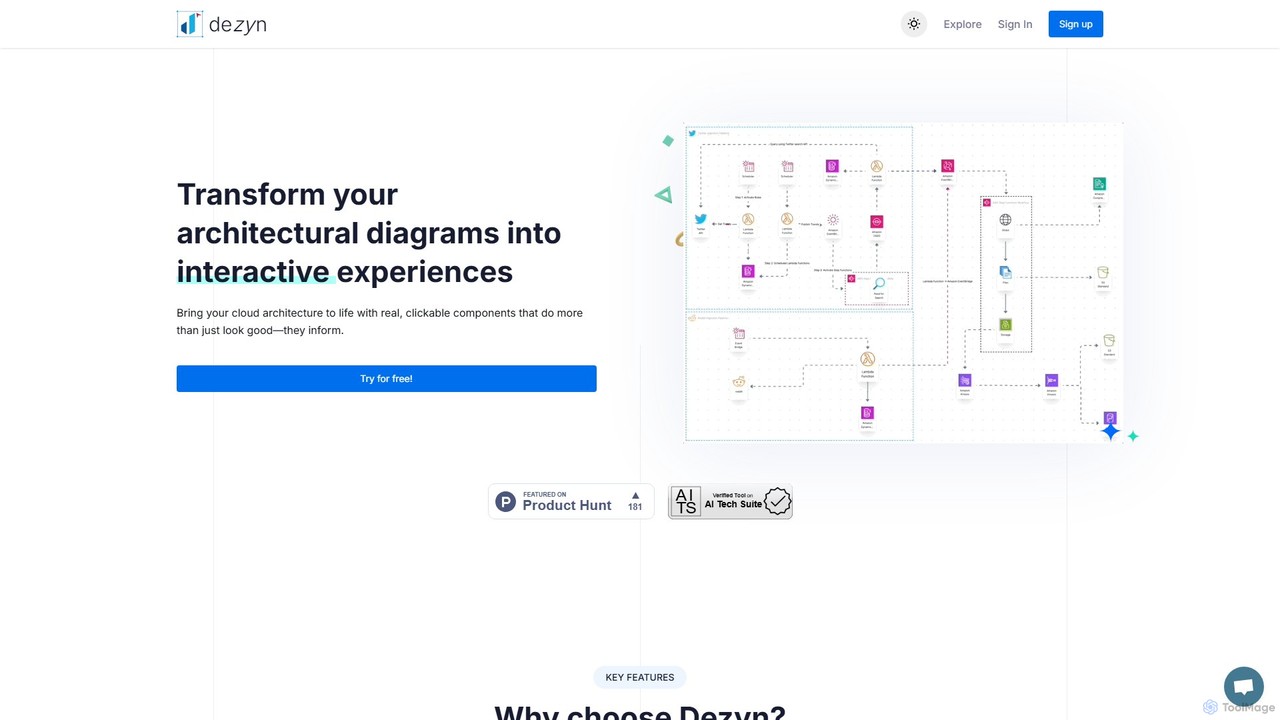
Dezyn ist eine KI-gestützte Plattform zur Erstellung interaktiver, datenreicher Architekturdiagramme und Flussdiagramme. Es wandelt Textaufforderungen, handgezeichnete Skizzen oder Wireframes in professionelle Diagramme um. Ideal für Ingenieure, Entwickler und Tech-Content-Ersteller, um komplexe Cloud-Systeme (AWS, Azure, GCP) zu visualisieren und effektiv zusammenzuarbeiten.

Flussdiagramm
Visits 5.2KFavorites 103Likes 107
Flux AI
Freemium

Flux AI

Flux AI ist ein intelligentes kollaboratives Whiteboard, das Textanweisungen in komplexe Diagramme umwandelt. Es ermöglicht Teams, Ideen zu visualisieren, Arbeitsabläufe zu entwerfen und Flussdiagramme oder Mindmaps in Sekunden zu erstellen, was den gesamten Planungs- und Brainstorming-Prozess optimiert.

Whiteboard
Visits 4.4KFavorites 122Likes 133
Mermaid Online
Paid

Mermaid Online

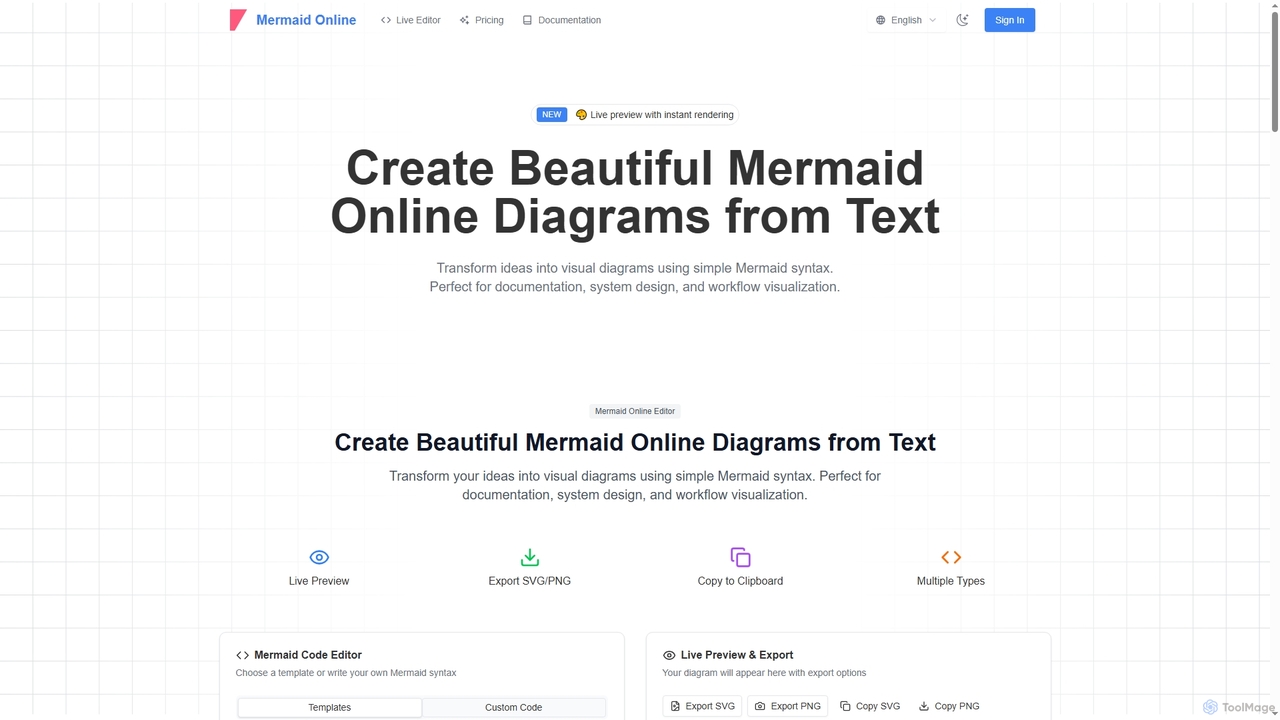
Mermaid Online ist ein fortschrittlicher webbasierter Editor und KI-gestützter Diagrammgenerator, der Textbeschreibungen und Mermaid-Syntax in professionelle visuelle Diagramme umwandelt. Er unterstützt verschiedene Diagrammtypen, bietet eine Echtzeit-Vorschau und flexible Exportoptionen, wodurch Dokumentations- und Systemdesign-Workflows für Einzelpersonen und Teams optimiert werden.

Text zu Diagramm
Visits 178.2KFavorites 106Likes 106
ai_flowchart
Freemium

ai_flowchart

ai_flowchart ist ein KI-gestütztes Werkzeug, das Beschreibungen in natürlicher Sprache sofort in professionelle Flussdiagramme und Diagramme umwandelt. Durch den Einsatz von fortschrittlichem NLP können Benutzer einfach einen Prozess beschreiben, und die KI generiert ein visuell ansprechendes und strukturiertes Diagramm. Es wurde für Entwickler, Projektmanager und Geschäftsanalysten entwickelt und bietet Anpassungs-, Kollaborations- und vielfältige Exportoptionen. Ideal für Softwarearchitektur, Geschäftsprozessmodellierung und Projektplanung.

Prozessmanagement
Visits 4.5KFavorites 116Likes 107
draft1.ai
Freemium

draft1.ai

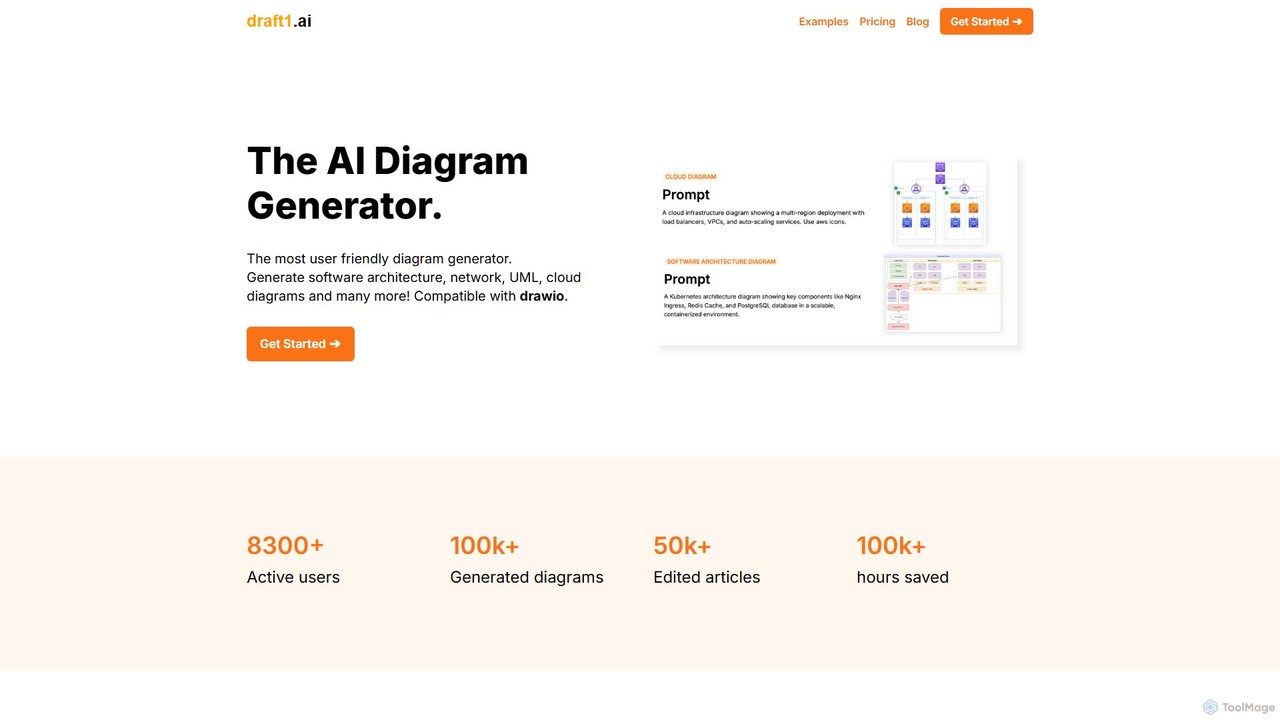
draft1.ai ist ein KI-gestützter Diagrammgenerator, der Ihre Texte, Notizen und Ideen in professionelle Diagramme wie ER, UML, Kubernetes und Netzwerk-Layouts umwandelt. Fügen Sie einfach Ihren Text ein, um sofort visuelle Illustrationen und einen ersten Berichtsentwurf zu erstellen. Bearbeiten Sie Diagramme nach Bedarf und exportieren Sie Ihre Arbeit in mehreren Formaten, um Ihren Dokumentations- und Designprozess zu optimieren.

Softwareentwicklung
Visits 13KFavorites 107Likes 98
Mermaid Chart
Freemium

Mermaid Chart

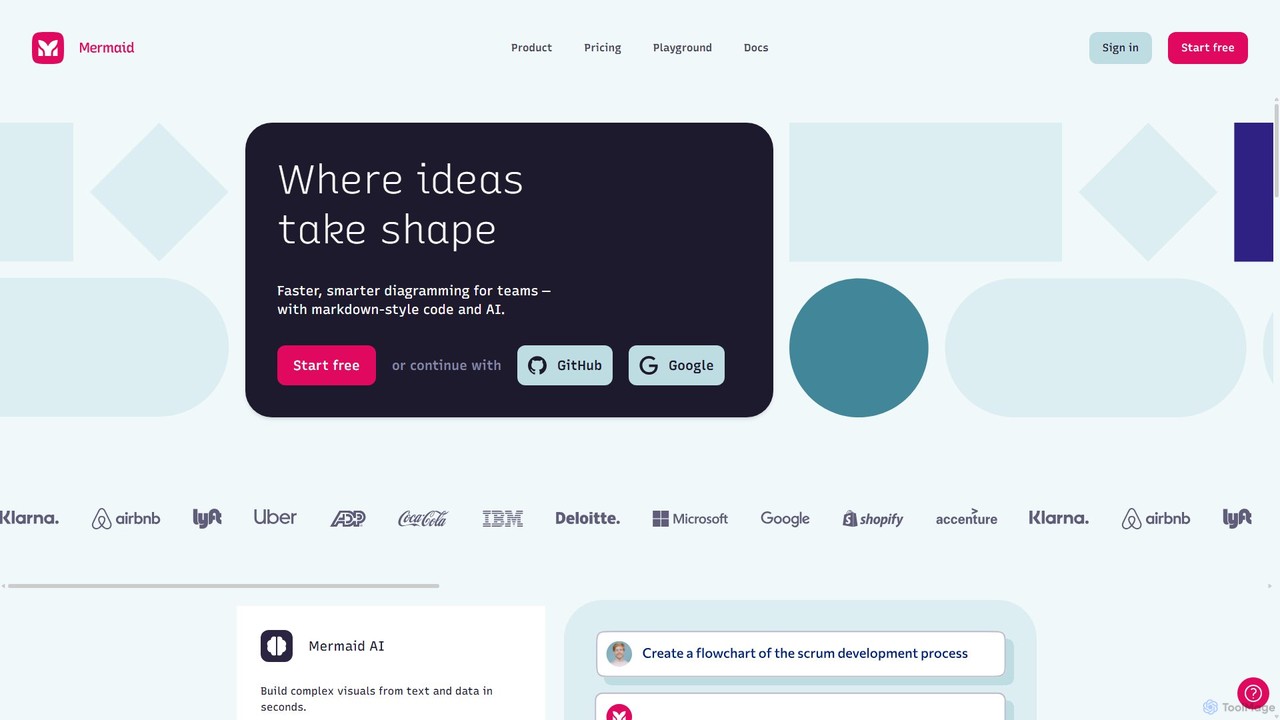
Mermaid Chart ist ein KI-gestütztes Diagrammwerkzeug, das es Teams ermöglicht, komplexe Visualisierungen wie Flussdiagramme, Sequenzdiagramme und Mindmaps mit Markdown-artigem Code, natürlichsprachlichen Anweisungen oder einem visuellen Editor zu erstellen. Es ist für schnellere, intelligentere Diagrammerstellung und nahtlose Zusammenarbeit konzipiert.

Codegenerierung
Visits 6.2KFavorites 136Likes 122
AI Assistant
Freemium

AI Assistant

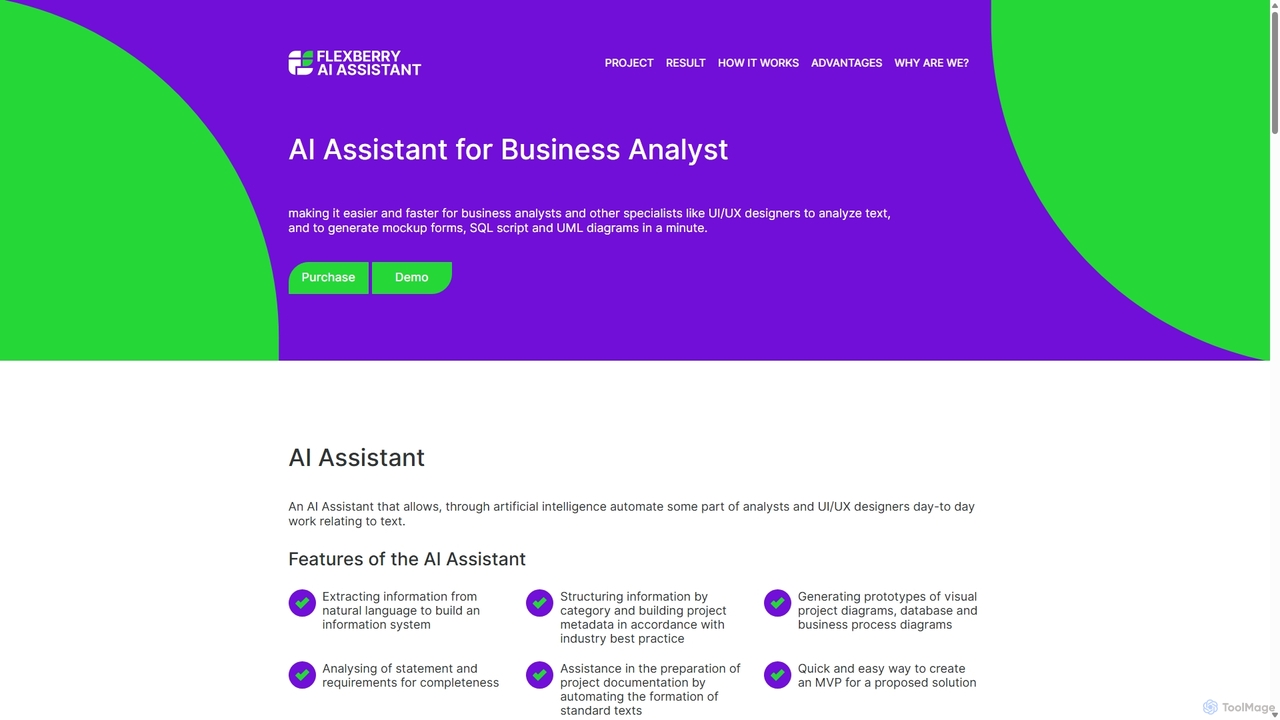
Ein KI-gestütztes Tool für Business-Analysten und UI/UX-Designer, das die Erstellung technischer Artefakte automatisiert. Es wandelt Anforderungen in natürlicher Sprache in UML-Diagramme, SQL-Skripte und UI-Mockups um und beschleunigt so den Systemdesign- und Entwicklungsprozess.

Anforderungsmanagement
Visits 5.1KFavorites 110Likes 102
Boronflow
Freemium

Boronflow

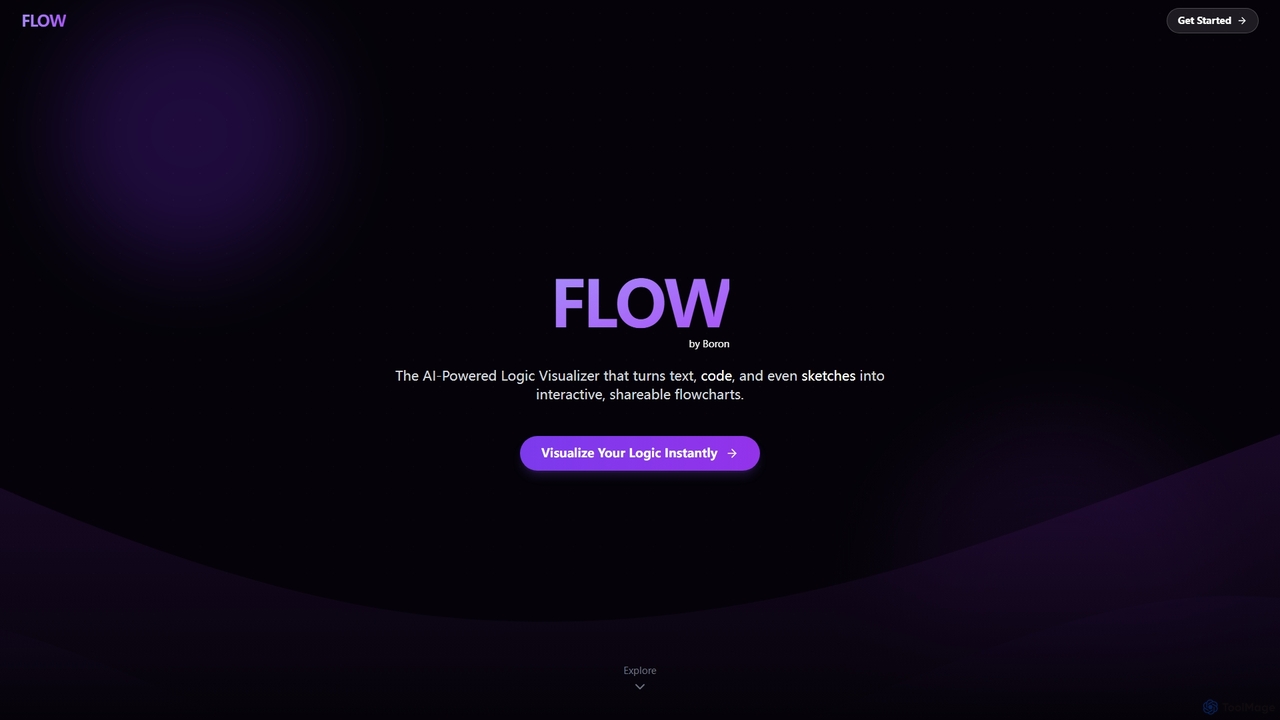
Ein KI-gestützter Logik-Visualisierer, der Text, Code und Skizzen sofort in interaktive, bearbeitbare Flussdiagramme umwandelt. Er unterstützt Echtzeit-Zusammenarbeit, Code-Ausführungsanimation und die Analyse von GitHub-Repositories.

Whiteboarding
Visits 4.5KFavorites 117Likes 116
DiagramGPT
Free

DiagramGPT

DiagramGPT ist ein KI-gestütztes Werkzeug, das natürlichsprachliche Texteingaben in verschiedene Diagramme umwandelt. Durch die Nutzung von GPT-Technologie und Mermaid-Syntax können Benutzer mühelos Flussdiagramme, Sequenzdiagramme und mehr erstellen, indem sie einfach beschreiben, was sie visualisieren möchten. Es ist eine ideale Lösung für Entwickler, Projektmanager und Studenten, die schnell professionelle Diagramme ohne manuelles Zeichnen erstellen müssen.

Prozessmanagement
Visits 4.5KFavorites 145Likes 150