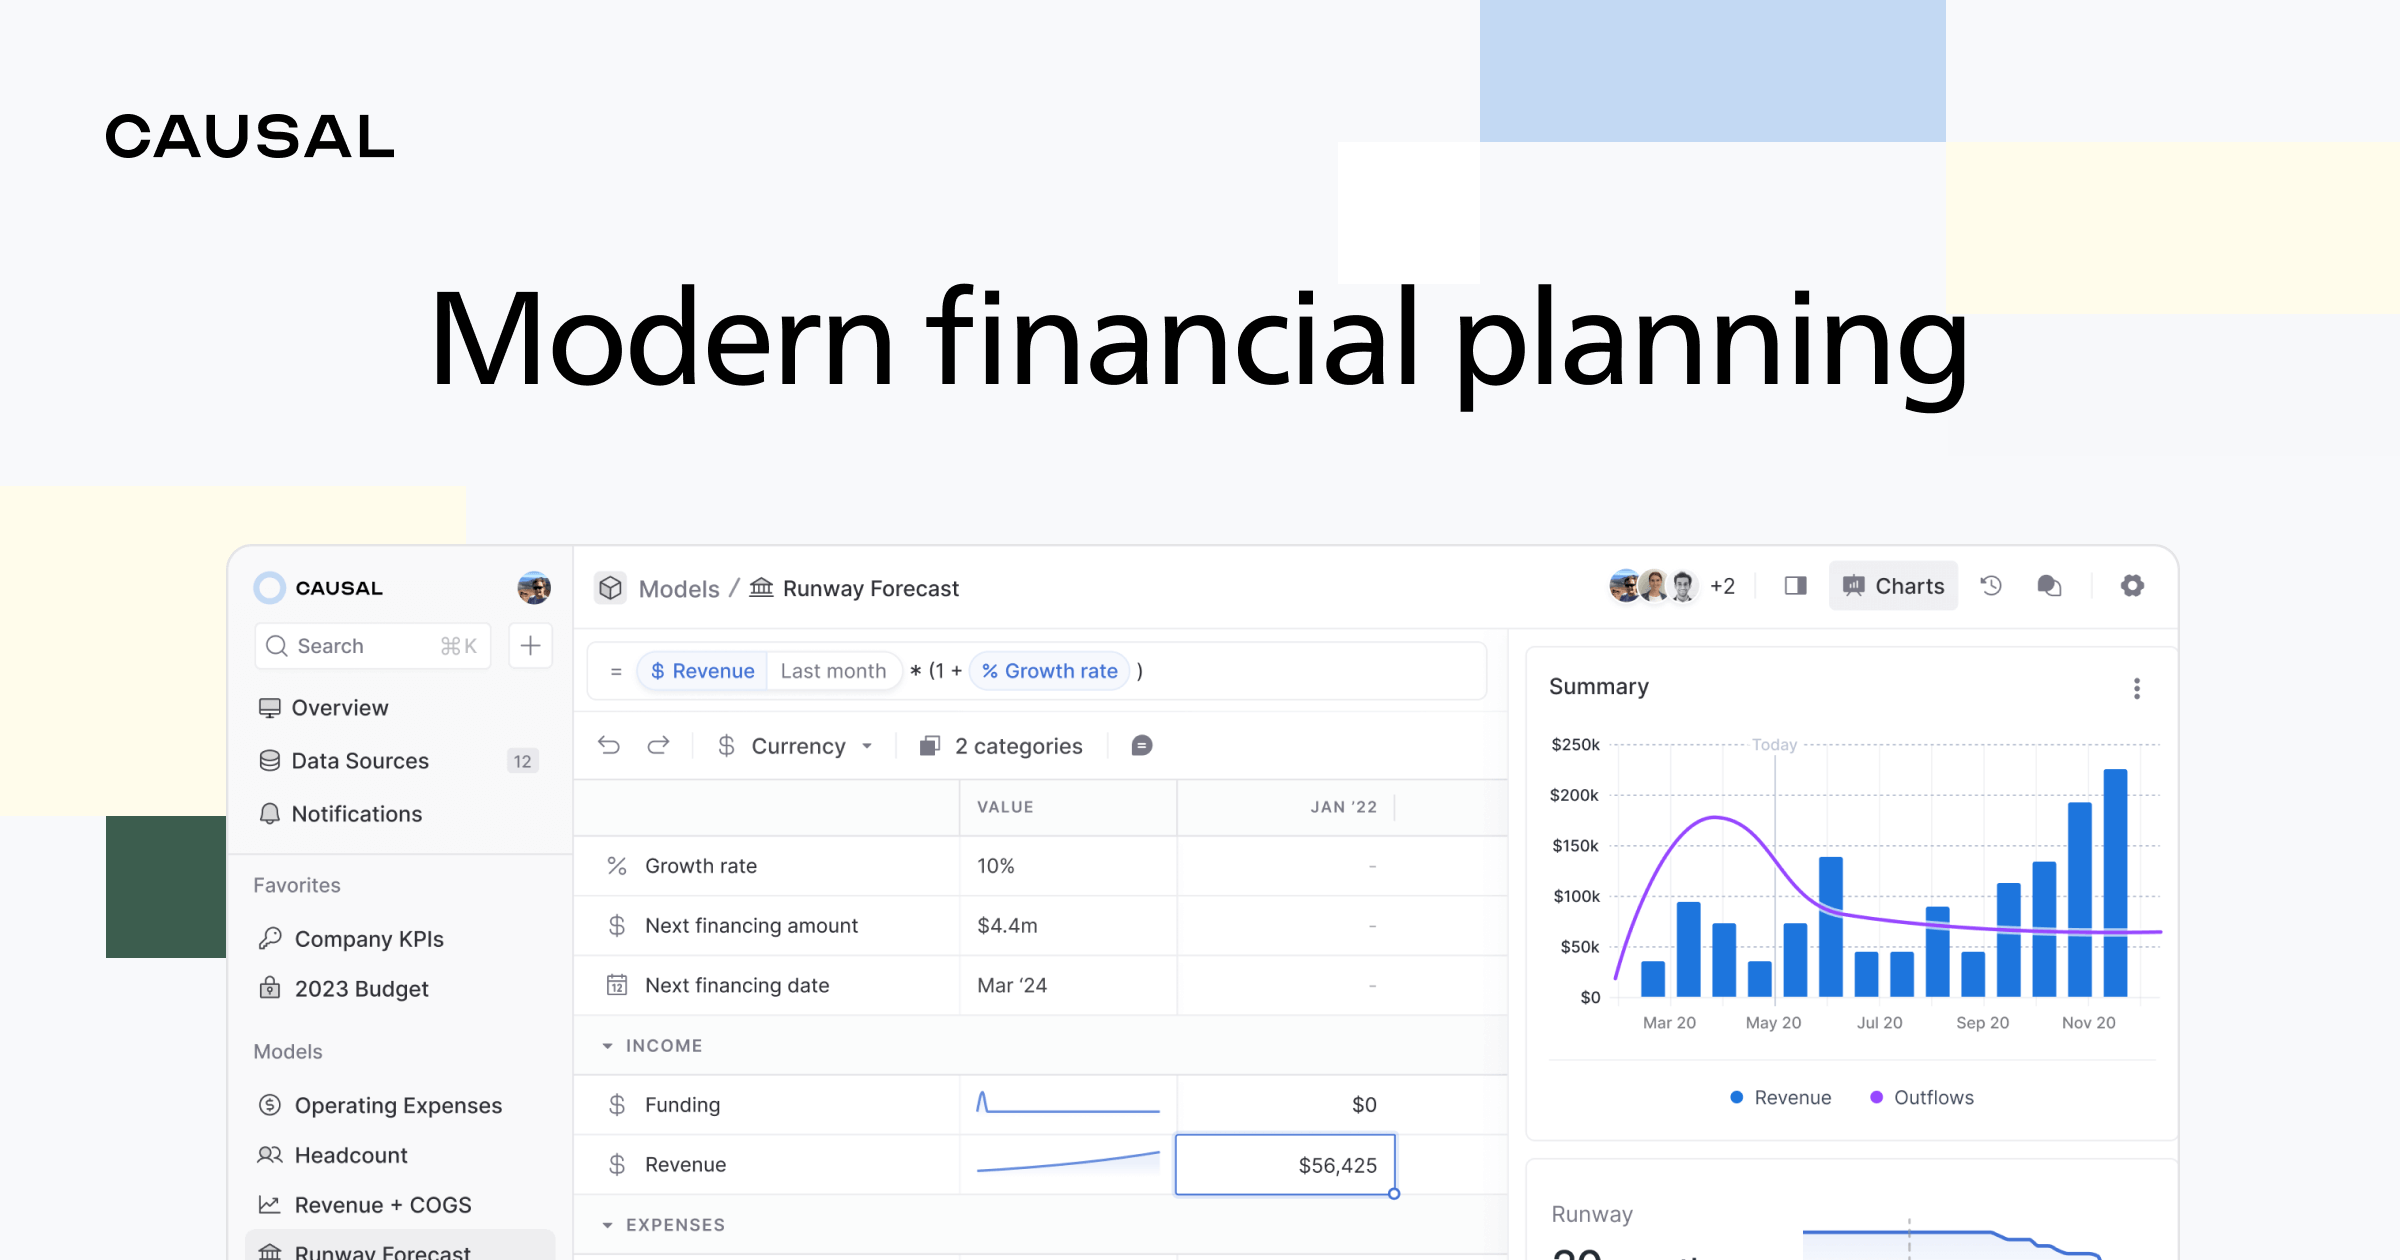
Causal es una plataforma de planificación y análisis financiero (FP&A) impulsada por IA que reemplaza las hojas de cálculo tradicionales. Ayuda a las empresas a crear modelos financieros dinámicos, pronósticos e informes conectándose a datos en vivo de varios sistemas, usando fórmulas simples y legibles por humanos, y permitiendo una potente planificación de escenarios.

Coefficient es un conector de datos que vincula Google Sheets y Excel con más de 100 sistemas empresariales como Salesforce y HubSpot. Automatiza las importaciones de datos, permite la sincronización bidireccional y utiliza IA para ayudar a los usuarios a crear fórmulas, consultas SQL y gráficos, transformando hojas de cálculo estáticas en dashboards dinámicos y en tiempo real.
Resumen del producto
Causal Resumen del producto
Causal es una plataforma de planificación y análisis financiero (FP&A) impulsada por IA que reemplaza las hojas de cálculo tradicionales. Ayuda a las empresas a crear modelos financieros dinámicos, pronósticos e informes conectándose a datos en vivo de varios sistemas, usando fórmulas simples y legibles por humanos, y permitiendo una potente planificación de escenarios.

Coefficient Resumen del producto
Coefficient es un conector de datos que vincula Google Sheets y Excel con más de 100 sistemas empresariales como Salesforce y HubSpot. Automatiza las importaciones de datos, permite la sincronización bidireccional y utiliza IA para ayudar a los usuarios a crear fórmulas, consultas SQL y gráficos, transformando hojas de cálculo estáticas en dashboards dinámicos y en tiempo real.
Detailed feature comparison
| Feature | Causal | Coefficient |
|---|---|---|
| Categoría principal | Análisis de Datos | Análisis de Datos |
| Añadido | 2025-08-13 | 2025-08-01 |
| Precio | De pago | Freemium |
| Sitio oficial | causal.app | coefficient.io |
| Tipo de producto | Sitio web | Extensión del navegador |
| Performance data | ||
| Valoración | Sin verificar | Sin verificar |
| Comentarios | 0 | 0 |
| Visitas mensuales | 27.7K | 161.6K |
| Crecimiento mensual | 4% | -7.7% |
| Favoritos | 129 | 90 |
| Details | Ver detalles | Ver detalles |
Causal vs Coefficient monthly traffic
Compare Causal and Coefficient by monthly reach, traffic trend, visit depth, top regions, and acquisition sources.
How to interpret the traffic data
In the Causal vs Coefficient monthly traffic comparison, Causal currently shows 27.7K visits and Coefficient shows 161.6K; Coefficient has about 5.8 times the visible traffic of Causal, an absolute difference of about 134K visits. This reflects visible reach, not feature quality or paid users.
Both tools provide verified traffic details, so monthly trends, visit depth, regions, and acquisition sources can be compared on the same basis.
Causal monthly traffic:
Latest traffic
Monthly traffic trend
- 2025/9: 52.2K Visitas mensuales
- 2026/1: 43.2K Visitas mensuales
- 2026/2: 22.1K Visitas mensuales
- 2026/3: 24.7K Visitas mensuales
- 2026/4: 26.6K Visitas mensuales
- 2026/5: 27.7K Visitas mensuales
Regiones principales
Top 5 countries/regions
| Country/region | Percentage | Traffic |
|---|---|---|
| 🇺🇸United States | 27.69% | 7.7K |
| 🇻🇳Vietnam | 26.56% | 7.3K |
| 🇨🇦Canada | 17.28% | 4.8K |
| 🇮🇳India | 16.08% | 4.4K |
| 🇦🇺Australia | 12.39% | 3.4K |
Palabras clave
Coefficient monthly traffic:
Latest traffic
Monthly traffic trend
- 2025/9: 319.4K Visitas mensuales
- 2026/1: 334.5K Visitas mensuales
- 2026/2: 212.8K Visitas mensuales
- 2026/3: 190.8K Visitas mensuales
- 2026/4: 175.1K Visitas mensuales
- 2026/5: 161.6K Visitas mensuales
Regiones principales
Top 5 countries/regions
| Country/region | Percentage | Traffic |
|---|---|---|
| 🇺🇸United States | 63.08% | 102K |
| 🇮🇳India | 15.95% | 25.8K |
| 🇵🇭Philippines | 8.99% | 14.5K |
| 🇩🇪Germany | 6.22% | 10.1K |
| 🇬🇧United Kingdom | 5.76% | 9.3K |
Fuentes de tráfico
| Source type | Percentage | Traffic |
|---|---|---|
| Directo | 65.35% | 105.6K |
| Referido | 31.17% | 50.4K |
| Correo electrónico | 3.48% | 5.6K |
Palabras clave
Usage comparison
Compare the core capabilities of Causal and Coefficient
Causal Core features
Coefficient Core features
Use cases
Causal Use cases
Coefficient Use cases
Causal vs Coefficient:In-depth comparison and selection guidance
First decide whether the products solve the same kind of need
This in-depth Causal vs Coefficient comparison uses only the product records, taxonomy, audience, traffic, and community signals available on this page. Causal is primarily listed under “Análisis de Datos”, while Coefficient is primarily listed under “Análisis de Datos”, so the first decision is whether your actual task matches their recorded scope.
The structured fields currently show these decision-relevant differences: Product type (Causal: Website; Coefficient: Browser extension); Pricing (Causal: Paid; Coefficient: Freemium); Monthly visits (Causal: 27.7K; Coefficient: 161.6K); Monthly growth (Causal: 4%; Coefficient: -7.7%); Favorites (Causal: 129; Coefficient: 90). These facts are more useful for selection than brand visibility alone.
What market visibility and monthly traffic mean
In the Causal vs Coefficient monthly traffic comparison, Causal currently shows 27.7K visits and Coefficient shows 161.6K; Coefficient has about 5.8 times the visible traffic of Causal, an absolute difference of about 134K visits. This reflects visible reach, not feature quality or paid users.
Both tools provide verified traffic details, so monthly trends, visit depth, regions, and acquisition sources can be compared on the same basis.
If public market visibility is an important first-pass criterion, investigate Coefficient first. The final choice should still follow taxonomy, use case, and a real trial because higher traffic does not prove broader capabilities or better workflow fit.
Product positioning, use cases, and roles
Causal and Coefficient currently overlap in shared categories: Análisis de Datos y Hojas de cálculo; shared tags: Inteligencia de Negocios e Informes. This can place both on the same shortlist, but it does not prove equal implementation, depth, or cost.
Causal's unique categories/tags are Planificación Financiera, Presupuesto, visualización de datos, Modelado financiero, Pronóstico, FP&A, Planificación de escenarios y Alternativa a la hoja de cálculo; Coefficient's are Análisis, CRM, automatización, análisis de datos, Conector de datos, Excel, Google Hojas de cálculo y HubSpot. These unique fields are the strongest differentiators: validate the product whose recorded scope matches the task instead of following traffic alone.
What ratings, comments, and favorites can tell you
Causal has no verified rating, 0 comments, 129 favorites, and 123 likes;Coefficient has no verified rating, 0 comments, 90 favorites, and 99 likes。
Neither product has enough rating or comment samples for a credible reputation ranking.
Selection guidance by actual need
When to evaluate Causal first
Put Causal on the priority trial list when the task aligns with “Análisis de Datos” and especially Planificación Financiera, Presupuesto, visualización de datos, Modelado financiero, Pronóstico y FP&A. This follows recorded positioning and does not imply unlisted capabilities are absent.
Causal also currently records: pricing is paid, product type is website, 27.7K verified monthly visits, no verified user rating. Verify any hard requirement around price, platform, or reach before trial, and do not let sparse review data substitute for testing.
When to evaluate Coefficient first
Put Coefficient on the priority trial list when the task aligns with “Análisis de Datos” and especially Análisis, CRM, automatización, análisis de datos, Conector de datos y Excel. This follows recorded positioning and does not imply unlisted capabilities are absent.
Coefficient also currently records: pricing is freemium, product type is browser extension, 161.6K verified monthly visits, no verified user rating. Verify any hard requirement around price, platform, or reach before trial, and do not let sparse review data substitute for testing.
How to validate the recommendation before deciding
The available data describes positioning, public visibility, and community signals, but it cannot prove output quality, speed, integration effort, privacy, or long-term cost in your workflow. Before deciding, run the same representative tasks in Causal and Coefficient, then record completion time, accuracy, manual corrections, and the real paid threshold. A like-for-like trial turns this comparison into a defensible adoption decision.