

ToolMage
Iniciar sesión
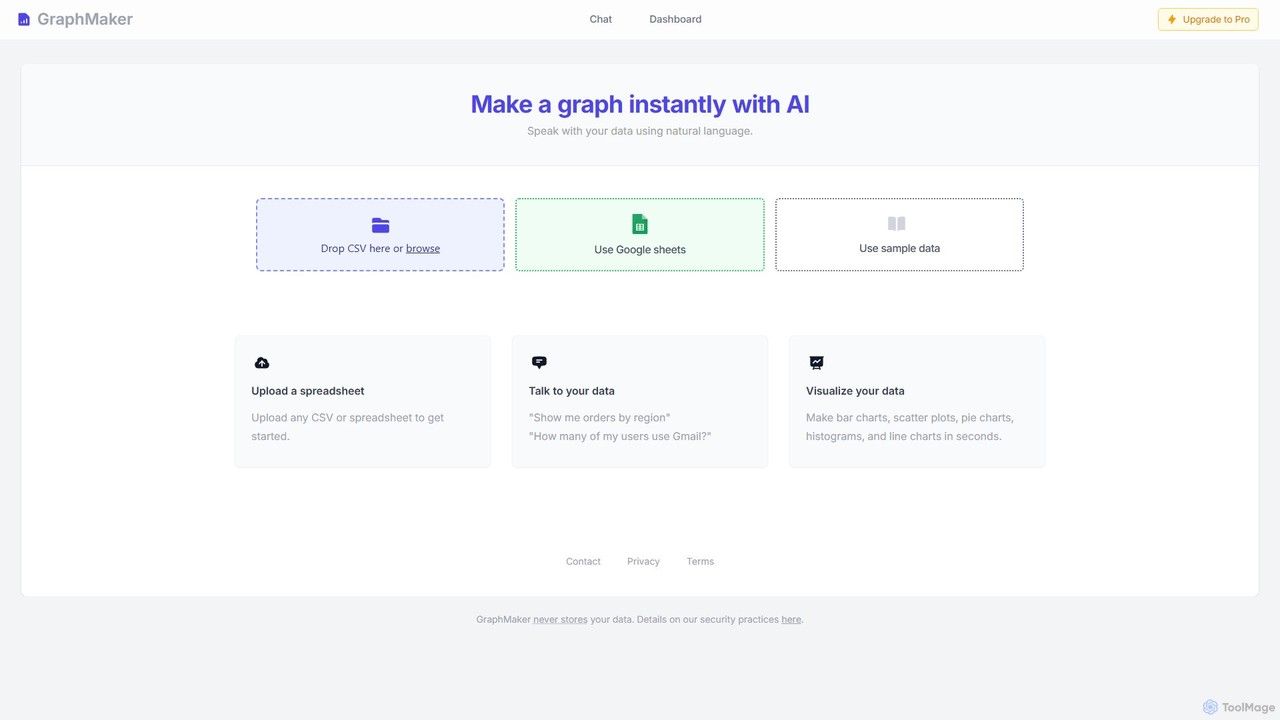
GraphMaker
Inteligencia de Negocio · 17.5K visitas mensuales

GraphMaker es una herramienta de visualización de datos impulsada por IA que te permite crear diversos gráficos en segundos. Simplemente sube tus datos desde un archivo CSV o Google Sheets y usa comandos en lenguaje natural para generar visualizaciones perspicaces como gráficos de barras, gráficos circulares e histogramas. Está diseñado para la velocidad, simplicidad y seguridad, ya que nunca almacena tus datos.

VS
SheetBot
Inteligencia de Negocio · 3.5K visitas mensuales

SheetBot es una plataforma de análisis de datos impulsada por IA que permite a los usuarios analizar, visualizar y transformar datos sin escribir código. Simplemente suba su conjunto de datos o conecte una fuente de datos, haga preguntas en lenguaje sencillo y reciba al instante ideas, tendencias y visualizaciones dinámicas. Potenciado por modelos avanzados como GPT-4o y Claude 3.5 Sonnet, agiliza análisis complejos, convirtiendo horas de trabajo en minutos.

GraphMaker vs SheetBot: precios, funciones y tráfico

Compara GraphMaker y SheetBot por posicionamiento, precio, capacidades, tráfico y opiniones.

Actualizado 5 ago 2026

Resumen del producto

GraphMaker Resumen del producto

GraphMaker es una herramienta de visualización de datos impulsada por IA que te permite crear diversos gráficos en segundos. Simplemente sube tus datos desde un archivo CSV o Google Sheets y usa comandos en lenguaje natural para generar visualizaciones perspicaces como gráficos de barras, gráficos circulares e histogramas. Está diseñado para la velocidad, simplicidad y seguridad, ya que nunca almacena tus datos.
Preview

SheetBot Resumen del producto

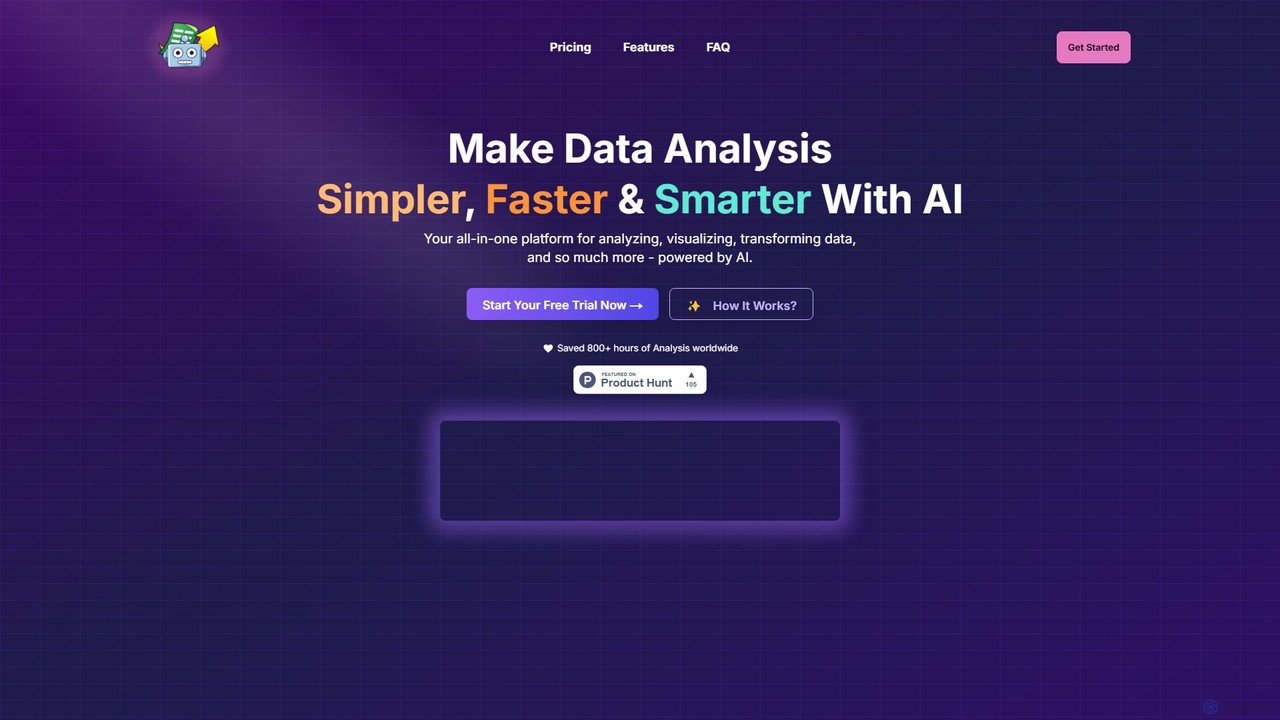
SheetBot es una plataforma de análisis de datos impulsada por IA que permite a los usuarios analizar, visualizar y transformar datos sin escribir código. Simplemente suba su conjunto de datos o conecte una fuente de datos, haga preguntas en lenguaje sencillo y reciba al instante ideas, tendencias y visualizaciones dinámicas. Potenciado por modelos avanzados como GPT-4o y Claude 3.5 Sonnet, agiliza análisis complejos, convirtiendo horas de trabajo en minutos.

Preview

Detailed feature comparison

FeatureGraphMakerSheetBot
Categoría principalInteligencia de NegocioInteligencia de Negocio
Añadido2025-08-152025-08-02
PrecioFreemiumFreemium
Sitio oficialwww.graphmaker.aiwww.sheetbot.ai
Tipo de productoSitio webSitio web
Performance data
ValoraciónSin verificarSin verificar
Comentarios00
Visitas mensuales17.5K3.5K
Crecimiento mensual-23.4%Sin verificar
Favoritos105122
DetailsVer detallesVer detalles

GraphMaker vs SheetBot monthly traffic

Compare GraphMaker and SheetBot by monthly reach, traffic trend, visit depth, top regions, and acquisition sources.

How to interpret the traffic data

In the GraphMaker vs SheetBot monthly traffic comparison, GraphMaker currently shows 17.5K visits and SheetBot shows 3.5K; GraphMaker has about 5.1 times the visible traffic of SheetBot, an absolute difference of about 14.1K visits. This reflects visible reach, not feature quality or paid users.

Only GraphMaker has complete third-party traffic details; SheetBot uses visits recorded inside ToolMage. These scopes cannot estimate market share directly, and on-site views should not be treated as the product’s total website traffic.

GraphMaker monthly traffic:

Latest traffic

Visitas mensuales
17.5K
Duración media
0:07
Páginas por visita
1.56
Tasa de rebote
40.1%
Data updated 2026-06-15

Monthly traffic trend

  • 2025/9: 109.9K Visitas mensuales
  • 2026/1: 41.1K Visitas mensuales
  • 2026/2: 29.5K Visitas mensuales
  • 2026/3: 34.7K Visitas mensuales
  • 2026/4: 22.9K Visitas mensuales
  • 2026/5: 17.5K Visitas mensuales

Regiones principales

Top 5 countries/regions
Country/regionPercentageTraffic
🇺🇸United States44.07%7.7K
🇧🇷Brazil19.78%3.5K
🇬🇧United Kingdom14.08%2.5K
🇮🇳India11.85%2.1K
🇩🇪Germany10.22%1.8K

Palabras clave

ai tool for bar chartexcel to graph aigraph chart maker aigraph makergraph maker ai

SheetBot monthly traffic:

Latest traffic

Visitas mensuales
3.5K
Traffic-based selection guidance: The current traffic scope is not sufficient for a reliable product ranking. Treat monthly visits as a market-interest signal, then decide using taxonomy, use cases, pricing, and a like-for-like trial rather than reading exposure as product capability.

Usage comparison

Compare the core capabilities of GraphMaker and SheetBot

GraphMaker Core features

Inteligencia de Negocio
Visualización
Análisis de Datos

SheetBot Core features

Inteligencia de Negocio
Visualización
Análisis de Datos

Use cases

GraphMaker Use cases

Inteligencia de Negocios
análisis de datos
visualización de datos
No-code
Análisis de datos de IA
Creador de gráficos
CSV a gráfico
Google Hojas de cálculo
Generador de gráficos
procesamiento de lenguaje natural

SheetBot Use cases

Inteligencia de Negocios
análisis de datos
visualización de datos
No-code
Asistente de IA
Claude 3.5
Transformación de datos
gpt-4o
MongoDB
hoja de cálculo
SQL
Análisis estadístico

GraphMaker vs SheetBot:In-depth comparison and selection guidance

First decide whether the products solve the same kind of need

This in-depth GraphMaker vs SheetBot comparison uses only the product records, taxonomy, audience, traffic, and community signals available on this page. GraphMaker is primarily listed under “Inteligencia de Negocio”, while SheetBot is primarily listed under “Inteligencia de Negocio”, so the first decision is whether your actual task matches their recorded scope.

The structured fields currently show these decision-relevant differences: Monthly visits (GraphMaker: 17.5K; SheetBot: 3.5K); Favorites (GraphMaker: 105; SheetBot: 122); Website (GraphMaker: www.graphmaker.ai; SheetBot: www.sheetbot.ai); Added (GraphMaker: 2025-08-15; SheetBot: 2025-08-02). These facts are more useful for selection than brand visibility alone.

What market visibility and monthly traffic mean

In the GraphMaker vs SheetBot monthly traffic comparison, GraphMaker currently shows 17.5K visits and SheetBot shows 3.5K; GraphMaker has about 5.1 times the visible traffic of SheetBot, an absolute difference of about 14.1K visits. This reflects visible reach, not feature quality or paid users.

Only GraphMaker has complete third-party traffic details; SheetBot uses visits recorded inside ToolMage. These scopes cannot estimate market share directly, and on-site views should not be treated as the product’s total website traffic.

The current traffic scope is not sufficient for a reliable product ranking. Treat monthly visits as a market-interest signal, then decide using taxonomy, use cases, pricing, and a like-for-like trial rather than reading exposure as product capability.

Product positioning, use cases, and roles

GraphMaker and SheetBot currently overlap in shared categories: Inteligencia de Negocio, Visualización y Análisis de Datos; shared tags: Inteligencia de Negocios, análisis de datos, visualización de datos y No-code. This can place both on the same shortlist, but it does not prove equal implementation, depth, or cost.

GraphMaker's unique categories/tags are Análisis de datos de IA, Creador de gráficos, CSV a gráfico, Google Hojas de cálculo, Generador de gráficos y procesamiento de lenguaje natural; SheetBot's are Asistente de IA, Claude 3.5, Transformación de datos, gpt-4o, MongoDB, hoja de cálculo, SQL y Análisis estadístico. These unique fields are the strongest differentiators: validate the product whose recorded scope matches the task instead of following traffic alone.

What ratings, comments, and favorites can tell you

GraphMaker has no verified rating, 0 comments, 105 favorites, and 125 likes;SheetBot has no verified rating, 0 comments, 122 favorites, and 118 likes。

Neither product has enough rating or comment samples for a credible reputation ranking.

Selection guidance by actual need

When to evaluate GraphMaker first

Put GraphMaker on the priority trial list when the task aligns with “Inteligencia de Negocio” and especially Análisis de datos de IA, Creador de gráficos, CSV a gráfico, Google Hojas de cálculo, Generador de gráficos y procesamiento de lenguaje natural. This follows recorded positioning and does not imply unlisted capabilities are absent.

GraphMaker also currently records: pricing is freemium, product type is website, 17.5K verified monthly visits, no verified user rating. Verify any hard requirement around price, platform, or reach before trial, and do not let sparse review data substitute for testing.

When to evaluate SheetBot first

Put SheetBot on the priority trial list when the task aligns with “Inteligencia de Negocio” and especially Asistente de IA, Claude 3.5, Transformación de datos, gpt-4o, MongoDB y hoja de cálculo. This follows recorded positioning and does not imply unlisted capabilities are absent.

SheetBot also currently records: pricing is freemium, product type is website, 3.5K on-site monthly views, no verified user rating. Verify any hard requirement around price, platform, or reach before trial, and do not let sparse review data substitute for testing.

How to validate the recommendation before deciding

The available data describes positioning, public visibility, and community signals, but it cannot prove output quality, speed, integration effort, privacy, or long-term cost in your workflow. Before deciding, run the same representative tasks in GraphMaker and SheetBot, then record completion time, accuracy, manual corrections, and the real paid threshold. A like-for-like trial turns this comparison into a defensible adoption decision.

Preguntas frecuentes

How should I choose between GraphMaker and SheetBot?
Compare positioning, pricing, taxonomy, and traffic maturity, then verify the latest details on each official website.
Where does this comparison data come from?
The factual baseline is derived from product, taxonomy, traffic, and community data. Reviewed editorial conclusions show their source and verification date.
What do unknown fields mean?
Unknown means there is not enough reliable evidence; the page does not fill gaps with assumptions.