ToolMage
Connexion
aiflowchart
Visualisation · 462 visites mensuelles

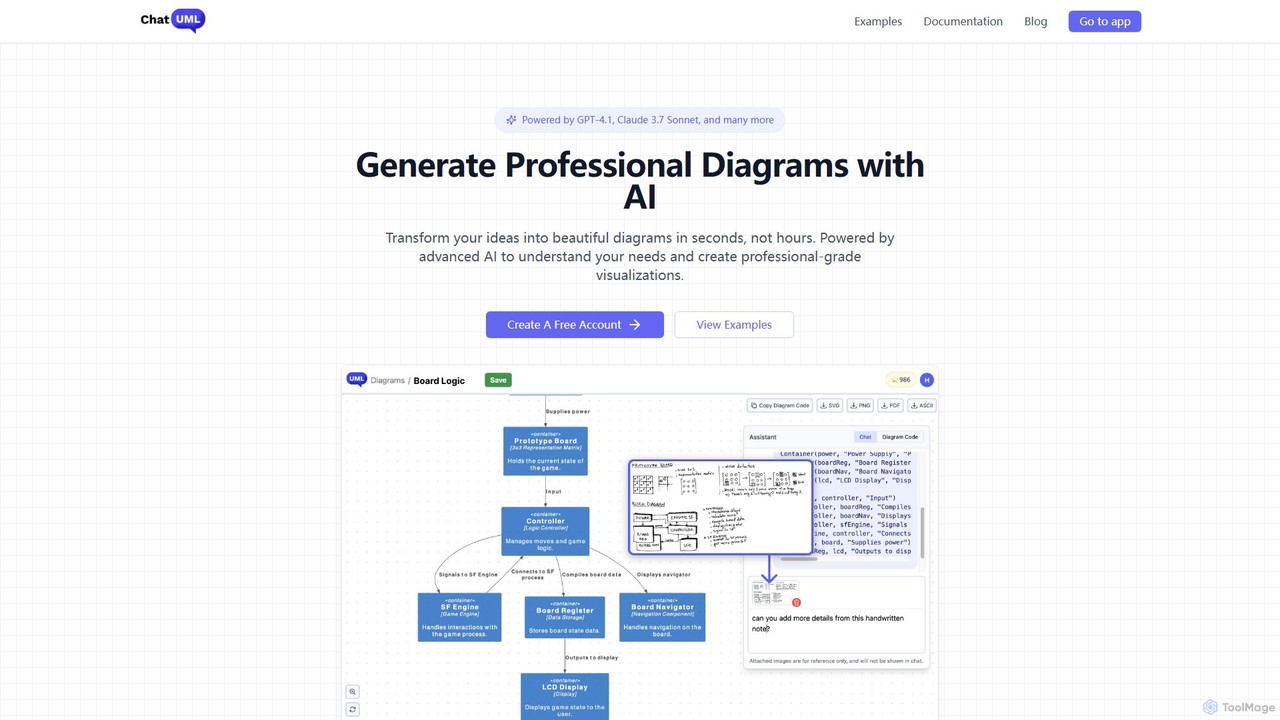
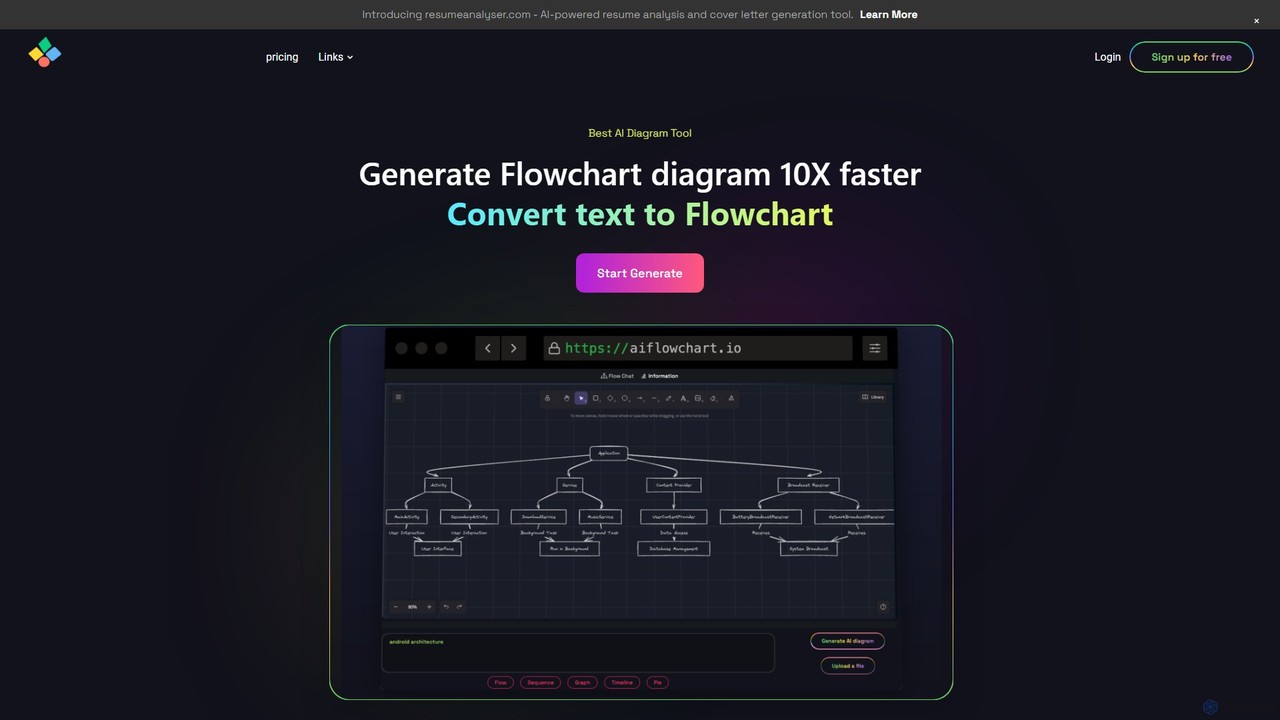
Un outil de création de diagrammes alimenté par l'IA qui génère automatiquement des organigrammes, des diagrammes de séquence, des diagrammes circulaires et plus encore à partir de texte, de PDF ou de contenu de blog. Il exploite des modèles comme GPT-4o pour créer des diagrammes uniques et personnalisables avec des explications, économisant ainsi un temps et des efforts considérables aux utilisateurs.
VS
ChartDB
Visualisation · 130K visites mensuelles

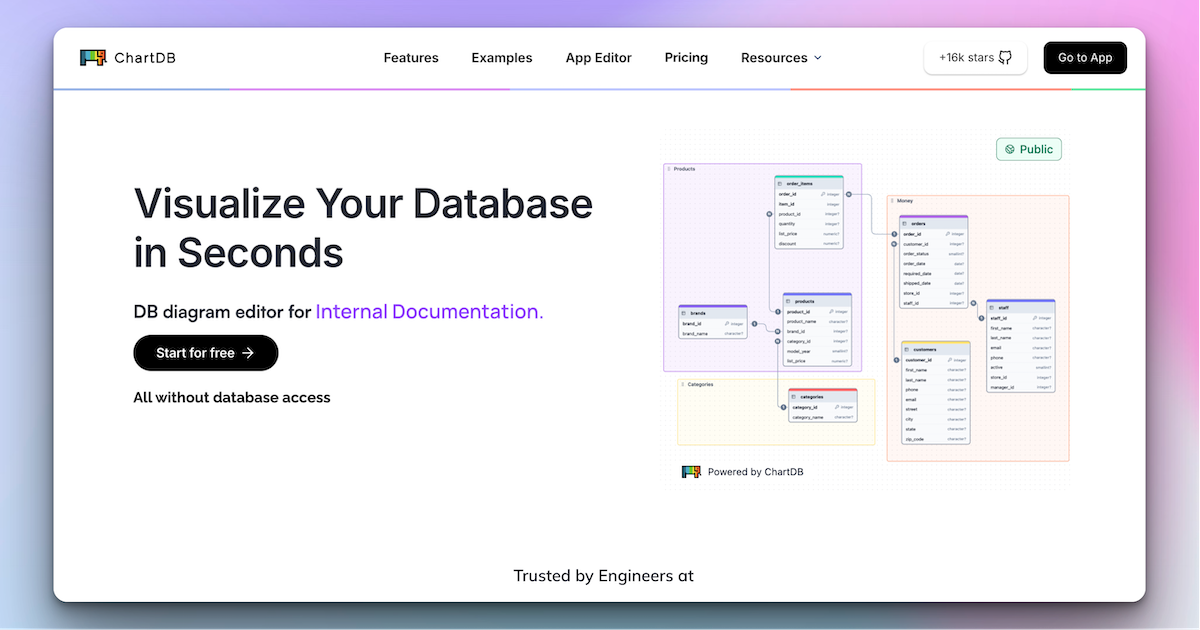
ChartDB est un visualiseur de schémas de base de données alimenté par l'IA qui génère instantanément des diagrammes ER interactifs à partir d'une seule requête. Il est conçu pour les développeurs et les équipes afin de concevoir, documenter et collaborer sur les structures de bases de données. Il propose une collaboration en temps réel, la synchronisation de base de données et un assistant IA pour optimiser la conception du schéma. Des versions cloud et auto-hébergées open source sont disponibles.

aiflowchart vs ChartDB : prix, fonctions et trafic

Comparez aiflowchart et ChartDB selon leur positionnement, prix, fonctions, trafic et avis.

Mis à jour 5 août 2026

Aperçu du produit

aiflowchart Aperçu du produit

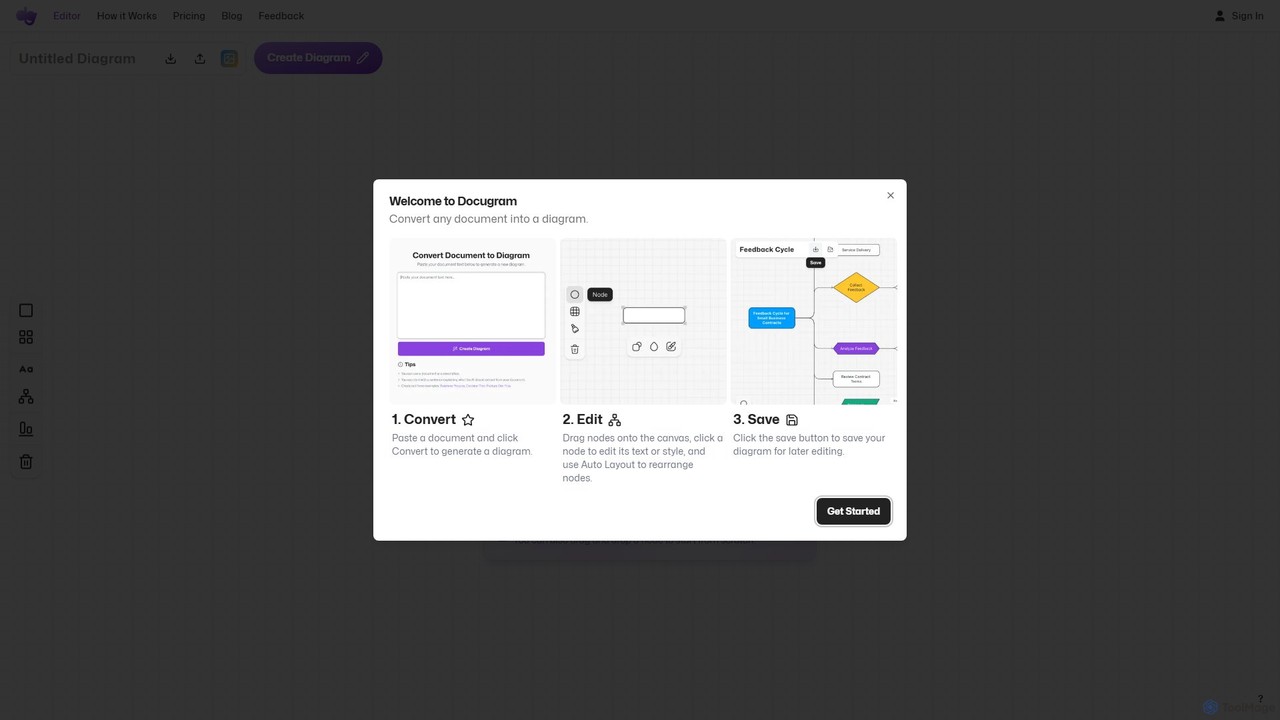
Un outil de création de diagrammes alimenté par l'IA qui génère automatiquement des organigrammes, des diagrammes de séquence, des diagrammes circulaires et plus encore à partir de texte, de PDF ou de contenu de blog. Il exploite des modèles comme GPT-4o pour créer des diagrammes uniques et personnalisables avec des explications, économisant ainsi un temps et des efforts considérables aux utilisateurs.
Preview

ChartDB Aperçu du produit

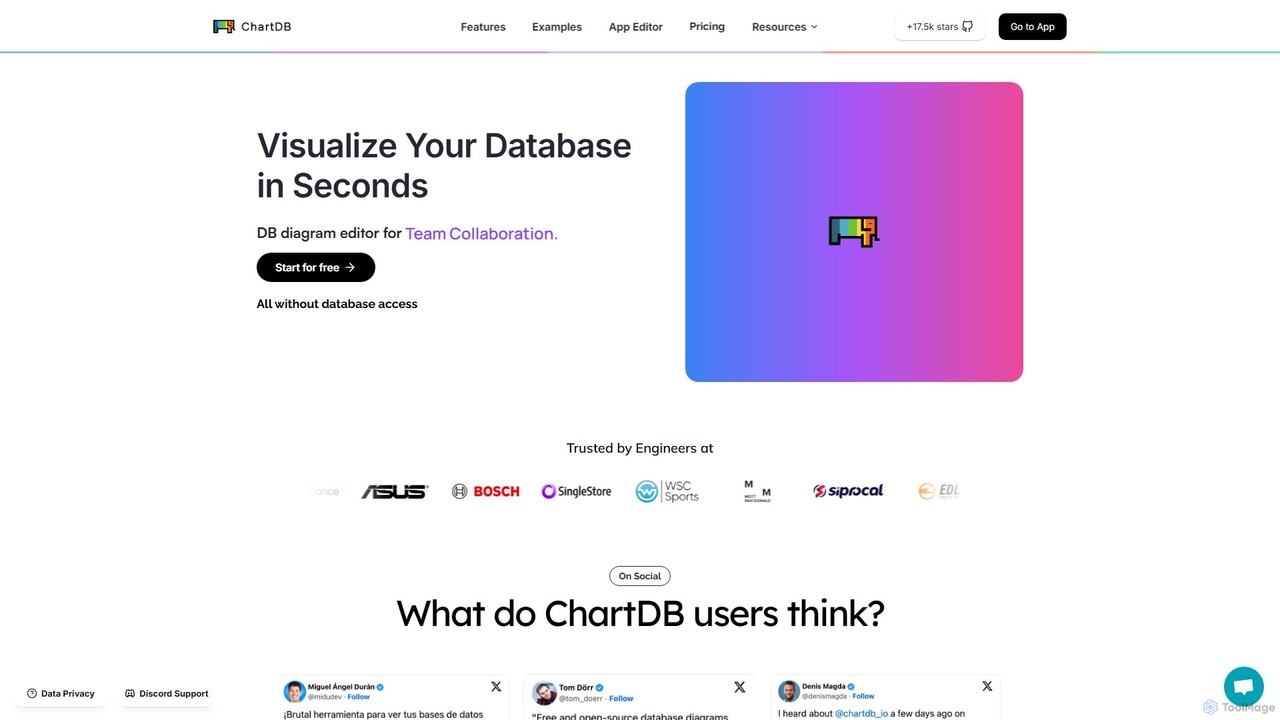
ChartDB est un visualiseur de schémas de base de données alimenté par l'IA qui génère instantanément des diagrammes ER interactifs à partir d'une seule requête. Il est conçu pour les développeurs et les équipes afin de concevoir, documenter et collaborer sur les structures de bases de données. Il propose une collaboration en temps réel, la synchronisation de base de données et un assistant IA pour optimiser la conception du schéma. Des versions cloud et auto-hébergées open source sont disponibles.

Preview

Detailed feature comparison

FeatureaiflowchartChartDB
Catégorie principaleVisualisationVisualisation
Ajouté2025-08-012025-08-13
TarificationFreemiumFreemium
Site officielaiflowchart.iochartdb.io
Type de produitSite webSite web
Performance data
Note utilisateurNon vérifiéNon vérifié
Commentaires00
Visites mensuelles462130K
Croissance mensuelle-77.4%-14.6%
Favoris82114
DetailsVoir les détailsVoir les détails

aiflowchart vs ChartDB monthly traffic

Compare aiflowchart and ChartDB by monthly reach, traffic trend, visit depth, top regions, and acquisition sources.

How to interpret the traffic data

In the aiflowchart vs ChartDB monthly traffic comparison, aiflowchart currently shows 462 visits and ChartDB shows 130K; ChartDB has about 281.4 times the visible traffic of aiflowchart, an absolute difference of about 129.5K visits. This reflects visible reach, not feature quality or paid users.

Both tools provide verified traffic details, so monthly trends, visit depth, regions, and acquisition sources can be compared on the same basis.

aiflowchart monthly traffic:

Latest traffic

Visites mensuelles
462
Durée moyenne
0:54
Pages par visite
2.34
Taux de rebond
32.81%
Data updated 2026-06-11

Monthly traffic trend

  • 2025/9: 9.2K Visites mensuelles
  • 2026/1: 2.1K Visites mensuelles
  • 2026/2: 1.7K Visites mensuelles
  • 2026/3: 1.5K Visites mensuelles
  • 2026/4: 2K Visites mensuelles
  • 2026/5: 462 Visites mensuelles

Principales régions

Top 5 countries/regions
Country/regionPercentageTraffic
🇮🇳India100%462

Mots-clés

ai generated diagramsflow diagram gamma aihow to convert pdf file to diagramtext to high level s diagramturn a text flow diagram to a image

ChartDB monthly traffic:

Latest traffic

Visites mensuelles
130K
Durée moyenne
0:35
Pages par visite
2.41
Taux de rebond
41.17%
Data updated 2026-06-15

Monthly traffic trend

  • 2025/9: 111.6K Visites mensuelles
  • 2026/1: 171.5K Visites mensuelles
  • 2026/2: 138.7K Visites mensuelles
  • 2026/3: 166.7K Visites mensuelles
  • 2026/4: 152.2K Visites mensuelles
  • 2026/5: 130K Visites mensuelles

Principales régions

Top 5 countries/regions
Country/regionPercentageTraffic
🇺🇸United States25.46%33.1K
🇮🇳India21.92%28.5K
🇪🇸Spain21.67%28.2K
🇷🇺Russia15.79%20.5K
🇮🇩Indonesia15.16%19.7K

Sources de trafic

Source typePercentageTraffic
Direct73.39%95.4K
Référence26.45%34.4K
E-mail0.16%208

Mots-clés

chartdbchartdb l连接 clickhousedbdiagramdiagram node sql websitedrawdb
Traffic-based selection guidance: If public market visibility is an important first-pass criterion, investigate ChartDB first. The final choice should still follow taxonomy, use case, and a real trial because higher traffic does not prove broader capabilities or better workflow fit.

Usage comparison

Compare the core capabilities of aiflowchart and ChartDB

aiflowchart Core features

Visualisation
Schématisation
Planification
Outils d'étude

ChartDB Core features

Visualisation
Schématisation
Base de données

Use cases

aiflowchart Use cases

Diagramme d'IA
ChatGPT
visualisation de données
Créateur de diagrammes
générateur d'organigrammes
gpt-4o
Carte mentale
Cartographie des processus
Diagramme de séquence
Texte en Diagramme

ChartDB Use cases

Assistant IA
Collaboration
base de données
conception de bases de données
Modélisation de données
Outils pour développeurs
Diagramme ER
MySQL
Open source
PostgreSQL
Visualiseur de Schéma
SQL

aiflowchart vs ChartDB:In-depth comparison and selection guidance

First decide whether the products solve the same kind of need

This in-depth aiflowchart vs ChartDB comparison uses only the product records, taxonomy, audience, traffic, and community signals available on this page. aiflowchart is primarily listed under “Visualisation”, while ChartDB is primarily listed under “Visualisation”, so the first decision is whether your actual task matches their recorded scope.

The structured fields currently show these decision-relevant differences: Monthly visits (aiflowchart: 462; ChartDB: 130K); Monthly growth (aiflowchart: -77.4%; ChartDB: -14.6%); Favorites (aiflowchart: 82; ChartDB: 114); Website (aiflowchart: aiflowchart.io; ChartDB: chartdb.io); Added (aiflowchart: 2025-08-01; ChartDB: 2025-08-13). These facts are more useful for selection than brand visibility alone.

What market visibility and monthly traffic mean

In the aiflowchart vs ChartDB monthly traffic comparison, aiflowchart currently shows 462 visits and ChartDB shows 130K; ChartDB has about 281.4 times the visible traffic of aiflowchart, an absolute difference of about 129.5K visits. This reflects visible reach, not feature quality or paid users.

Both tools provide verified traffic details, so monthly trends, visit depth, regions, and acquisition sources can be compared on the same basis.

If public market visibility is an important first-pass criterion, investigate ChartDB first. The final choice should still follow taxonomy, use case, and a real trial because higher traffic does not prove broader capabilities or better workflow fit.

Product positioning, use cases, and roles

aiflowchart and ChartDB currently overlap in shared categories: Visualisation et Schématisation. This can place both on the same shortlist, but it does not prove equal implementation, depth, or cost.

aiflowchart's unique categories/tags are Planification, Outils d'étude, Diagramme d'IA, ChatGPT, visualisation de données, Créateur de diagrammes, générateur d'organigrammes et gpt-4o; ChartDB's are Base de données, Assistant IA, Collaboration, base de données, conception de bases de données, Modélisation de données, Outils pour développeurs et Diagramme ER. These unique fields are the strongest differentiators: validate the product whose recorded scope matches the task instead of following traffic alone.

What ratings, comments, and favorites can tell you

aiflowchart has no verified rating, 0 comments, 82 favorites, and 79 likes;ChartDB has no verified rating, 0 comments, 114 favorites, and 122 likes。

Neither product has enough rating or comment samples for a credible reputation ranking.

Selection guidance by actual need

When to evaluate aiflowchart first

Put aiflowchart on the priority trial list when the task aligns with “Visualisation” and especially Planification, Outils d'étude, Diagramme d'IA, ChatGPT, visualisation de données et Créateur de diagrammes. This follows recorded positioning and does not imply unlisted capabilities are absent.

aiflowchart also currently records: pricing is freemium, product type is website, 462 verified monthly visits, no verified user rating. Verify any hard requirement around price, platform, or reach before trial, and do not let sparse review data substitute for testing.

When to evaluate ChartDB first

Put ChartDB on the priority trial list when the task aligns with “Visualisation” and especially Base de données, Assistant IA, Collaboration, base de données, conception de bases de données et Modélisation de données. This follows recorded positioning and does not imply unlisted capabilities are absent.

ChartDB also currently records: pricing is freemium, product type is website, 130K verified monthly visits, no verified user rating. Verify any hard requirement around price, platform, or reach before trial, and do not let sparse review data substitute for testing.

How to validate the recommendation before deciding

The available data describes positioning, public visibility, and community signals, but it cannot prove output quality, speed, integration effort, privacy, or long-term cost in your workflow. Before deciding, run the same representative tasks in aiflowchart and ChartDB, then record completion time, accuracy, manual corrections, and the real paid threshold. A like-for-like trial turns this comparison into a defensible adoption decision.

FAQ comparative

How should I choose between aiflowchart and ChartDB?
Compare positioning, pricing, taxonomy, and traffic maturity, then verify the latest details on each official website.
Where does this comparison data come from?
The factual baseline is derived from product, taxonomy, traffic, and community data. Reviewed editorial conclusions show their source and verification date.
What do unknown fields mean?
Unknown means there is not enough reliable evidence; the page does not fill gaps with assumptions.