

ToolMage
Connexion
ChartFast
Informatique décisionnelle · 3.5K visites mensuelles

ChartFast est un analyste de données alimenté par l'IA qui transforme votre travail de données. Téléchargez des fichiers CSV ou Excel, et il nettoie, analyse et visualise automatiquement vos données. Générez des graphiques complexes et obtenez des informations en quelques secondes en posant simplement des questions, éliminant ainsi des heures de tâches manuelles sur tableur.

VS
Tableau
Informatique décisionnelle · 6.7M visites mensuelles

Tableau est une plateforme de business intelligence et d'analyse de données de premier plan, alimentée par l'IA, qui aide les gens à voir et à comprendre les données. Elle permet aux utilisateurs de créer des tableaux de bord interactifs, d'effectuer des analyses de données complexes et de partager des informations au sein de leur organisation, le tout amélioré par des fonctionnalités d'IA comme Tableau Agent pour une prise de décision accélérée.

ChartFast vs Tableau : prix, fonctions et trafic

Comparez ChartFast et Tableau selon leur positionnement, prix, fonctions, trafic et avis.

Mis à jour 5 août 2026

Aperçu du produit

ChartFast Aperçu du produit

ChartFast est un analyste de données alimenté par l'IA qui transforme votre travail de données. Téléchargez des fichiers CSV ou Excel, et il nettoie, analyse et visualise automatiquement vos données. Générez des graphiques complexes et obtenez des informations en quelques secondes en posant simplement des questions, éliminant ainsi des heures de tâches manuelles sur tableur.
Preview

Tableau Aperçu du produit

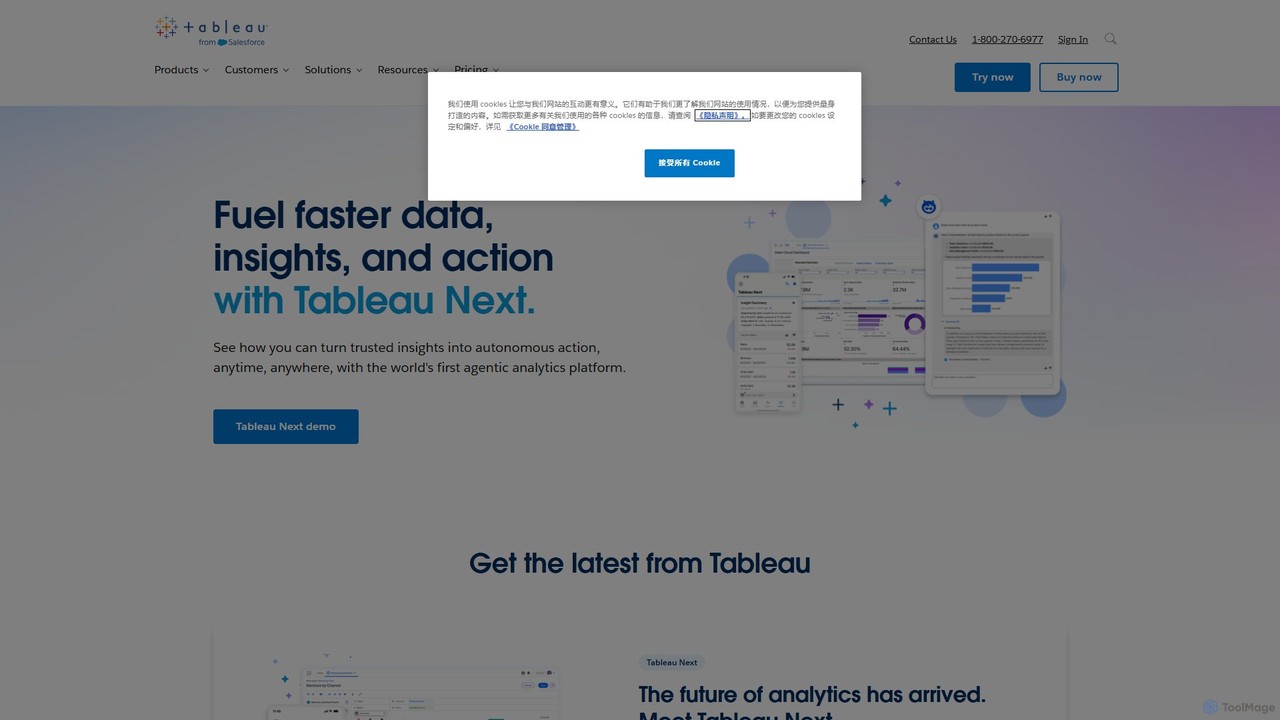
Tableau est une plateforme de business intelligence et d'analyse de données de premier plan, alimentée par l'IA, qui aide les gens à voir et à comprendre les données. Elle permet aux utilisateurs de créer des tableaux de bord interactifs, d'effectuer des analyses de données complexes et de partager des informations au sein de leur organisation, le tout amélioré par des fonctionnalités d'IA comme Tableau Agent pour une prise de décision accélérée.

Preview

Detailed feature comparison

FeatureChartFastTableau
Catégorie principaleInformatique décisionnelleInformatique décisionnelle
Ajouté2025-08-142025-08-09
TarificationPayantFreemium
Site officielwww.chartfast.iowww.tableau.com
Type de produitSite webSite web
Performance data
Note utilisateurNon vérifiéNon vérifié
Commentaires00
Visites mensuelles3.5K6.7M
Croissance mensuelleNon vérifié-11.7%
Favoris116103
DetailsVoir les détailsVoir les détails

ChartFast vs Tableau monthly traffic

Compare ChartFast and Tableau by monthly reach, traffic trend, visit depth, top regions, and acquisition sources.

How to interpret the traffic data

In the ChartFast vs Tableau monthly traffic comparison, ChartFast currently shows 3.5K visits and Tableau shows 6.7M; Tableau has about 1,943.3 times the visible traffic of ChartFast, an absolute difference of about 6.7M visits. This reflects visible reach, not feature quality or paid users.

Only Tableau has complete third-party traffic details; ChartFast uses visits recorded inside ToolMage. These scopes cannot estimate market share directly, and on-site views should not be treated as the product’s total website traffic.

ChartFast monthly traffic:

Latest traffic

Visites mensuelles
3.5K

Tableau monthly traffic:

Latest traffic

Visites mensuelles
6.7M
Durée moyenne
6:34
Pages par visite
7.88
Taux de rebond
27.08%
Data updated 2026-06-15

Monthly traffic trend

  • 2025/9: 8M Visites mensuelles
  • 2026/1: 7.5M Visites mensuelles
  • 2026/2: 6.8M Visites mensuelles
  • 2026/3: 7.6M Visites mensuelles
  • 2026/4: 7.6M Visites mensuelles
  • 2026/5: 6.7M Visites mensuelles

Principales régions

Top 5 countries/regions
Country/regionPercentageTraffic
🇺🇸United States55.3%3.7M
🇯🇵Japan22.08%1.5M
🇮🇳India10.13%679.4K
🇬🇧United Kingdom8.15%546.6K
🇧🇷Brazil4.34%291.1K

Sources de trafic

Source typePercentageTraffic
Direct81.7%5.5M
Référence14.8%992.5K
E-mail3.5%234.7K

Mots-clés

gaiguhack blox fruitheovltableautableau public
Traffic-based selection guidance: The current traffic scope is not sufficient for a reliable product ranking. Treat monthly visits as a market-interest signal, then decide using taxonomy, use cases, pricing, and a like-for-like trial rather than reading exposure as product capability.

Usage comparison

Compare the core capabilities of ChartFast and Tableau

ChartFast Core features

Informatique décisionnelle
Visualisation
Analyse de données

Tableau Core features

Informatique décisionnelle
Visualisation
Analyse de données

Use cases

ChartFast Use cases

Informatique décisionnelle
analyse de données
visualisation de données
Analyste de données IA
Générateur de graphiques
Analyse CSV
Nettoyage de données
Analyse Excel
gpt-4o
automatisation de feuilles de calcul

Tableau Use cases

Informatique décisionnelle
analyse de données
visualisation de données
Analyse IA
Big data
Tableau de bord
Narration de données
Rapports
Salesforce

ChartFast vs Tableau:In-depth comparison and selection guidance

First decide whether the products solve the same kind of need

This in-depth ChartFast vs Tableau comparison uses only the product records, taxonomy, audience, traffic, and community signals available on this page. ChartFast is primarily listed under “Informatique décisionnelle”, while Tableau is primarily listed under “Informatique décisionnelle”, so the first decision is whether your actual task matches their recorded scope.

The structured fields currently show these decision-relevant differences: Pricing (ChartFast: Paid; Tableau: Freemium); Monthly visits (ChartFast: 3.5K; Tableau: 6.7M); Favorites (ChartFast: 116; Tableau: 103); Website (ChartFast: www.chartfast.io; Tableau: www.tableau.com); Added (ChartFast: 2025-08-14; Tableau: 2025-08-09). These facts are more useful for selection than brand visibility alone.

What market visibility and monthly traffic mean

In the ChartFast vs Tableau monthly traffic comparison, ChartFast currently shows 3.5K visits and Tableau shows 6.7M; Tableau has about 1,943.3 times the visible traffic of ChartFast, an absolute difference of about 6.7M visits. This reflects visible reach, not feature quality or paid users.

Only Tableau has complete third-party traffic details; ChartFast uses visits recorded inside ToolMage. These scopes cannot estimate market share directly, and on-site views should not be treated as the product’s total website traffic.

The current traffic scope is not sufficient for a reliable product ranking. Treat monthly visits as a market-interest signal, then decide using taxonomy, use cases, pricing, and a like-for-like trial rather than reading exposure as product capability.

Product positioning, use cases, and roles

ChartFast and Tableau currently overlap in shared categories: Informatique décisionnelle, Visualisation et Analyse de données; shared tags: Informatique décisionnelle, analyse de données et visualisation de données. This can place both on the same shortlist, but it does not prove equal implementation, depth, or cost.

ChartFast's unique categories/tags are Analyste de données IA, Générateur de graphiques, Analyse CSV, Nettoyage de données, Analyse Excel, gpt-4o et automatisation de feuilles de calcul; Tableau's are Analyse IA, Big data, Tableau de bord, Narration de données, Rapports et Salesforce. These unique fields are the strongest differentiators: validate the product whose recorded scope matches the task instead of following traffic alone.

What ratings, comments, and favorites can tell you

ChartFast has no verified rating, 0 comments, 116 favorites, and 107 likes;Tableau has no verified rating, 0 comments, 103 favorites, and 120 likes。

Neither product has enough rating or comment samples for a credible reputation ranking.

Selection guidance by actual need

When to evaluate ChartFast first

Put ChartFast on the priority trial list when the task aligns with “Informatique décisionnelle” and especially Analyste de données IA, Générateur de graphiques, Analyse CSV, Nettoyage de données, Analyse Excel et gpt-4o. This follows recorded positioning and does not imply unlisted capabilities are absent.

ChartFast also currently records: pricing is paid, product type is website, 3.5K on-site monthly views, no verified user rating. Verify any hard requirement around price, platform, or reach before trial, and do not let sparse review data substitute for testing.

When to evaluate Tableau first

Put Tableau on the priority trial list when the task aligns with “Informatique décisionnelle” and especially Analyse IA, Big data, Tableau de bord, Narration de données, Rapports et Salesforce. This follows recorded positioning and does not imply unlisted capabilities are absent.

Tableau also currently records: pricing is freemium, product type is website, 6.7M verified monthly visits, no verified user rating. Verify any hard requirement around price, platform, or reach before trial, and do not let sparse review data substitute for testing.

How to validate the recommendation before deciding

The available data describes positioning, public visibility, and community signals, but it cannot prove output quality, speed, integration effort, privacy, or long-term cost in your workflow. Before deciding, run the same representative tasks in ChartFast and Tableau, then record completion time, accuracy, manual corrections, and the real paid threshold. A like-for-like trial turns this comparison into a defensible adoption decision.

FAQ comparative

How should I choose between ChartFast and Tableau?
Compare positioning, pricing, taxonomy, and traffic maturity, then verify the latest details on each official website.
Where does this comparison data come from?
The factual baseline is derived from product, taxonomy, traffic, and community data. Reviewed editorial conclusions show their source and verification date.
What do unknown fields mean?
Unknown means there is not enough reliable evidence; the page does not fill gaps with assumptions.