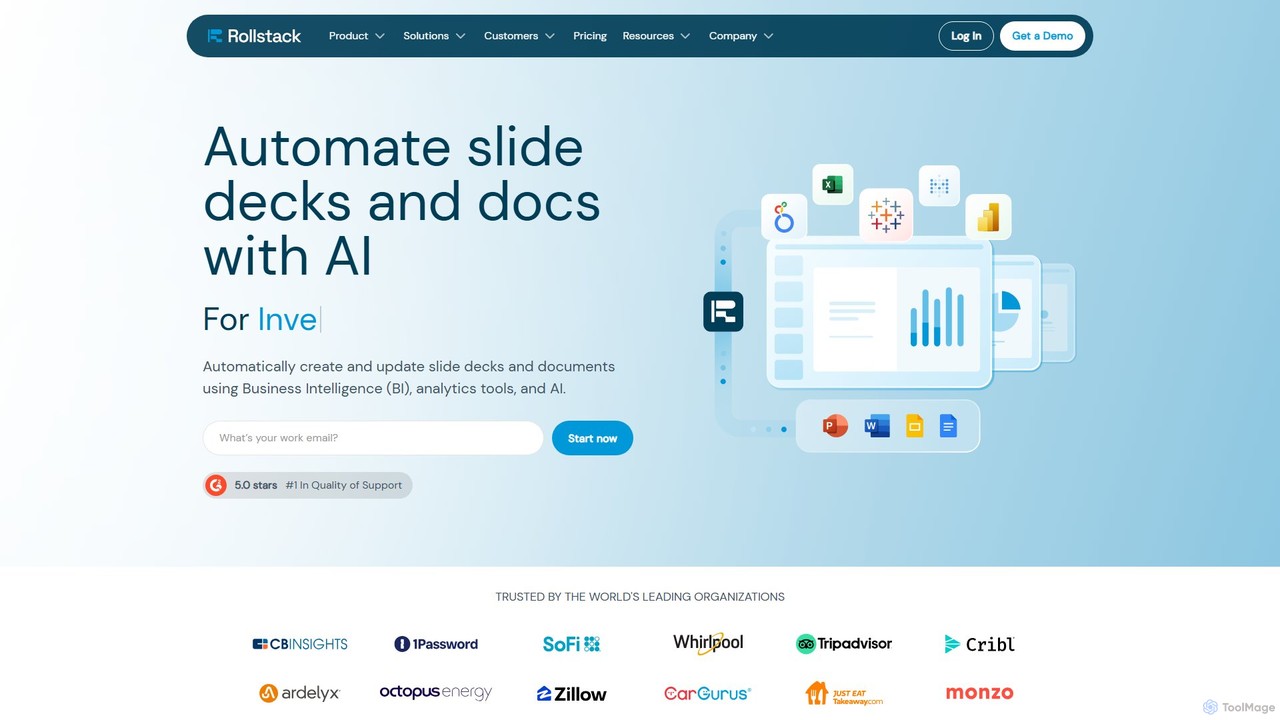
Graphy est un outil de visualisation de données alimenté par l'IA qui transforme les données brutes en graphiques magnifiques et interactifs en quelques secondes. Il simplifie la narration de données (data storytelling) en identifiant automatiquement les informations clés, en permettant aux utilisateurs de discuter avec leurs données et en offrant une personnalisation étendue. Idéal pour les marketeurs, les analystes et les équipes qui ont besoin de créer des rapports visuels et des présentations percutants sans logiciel complexe.
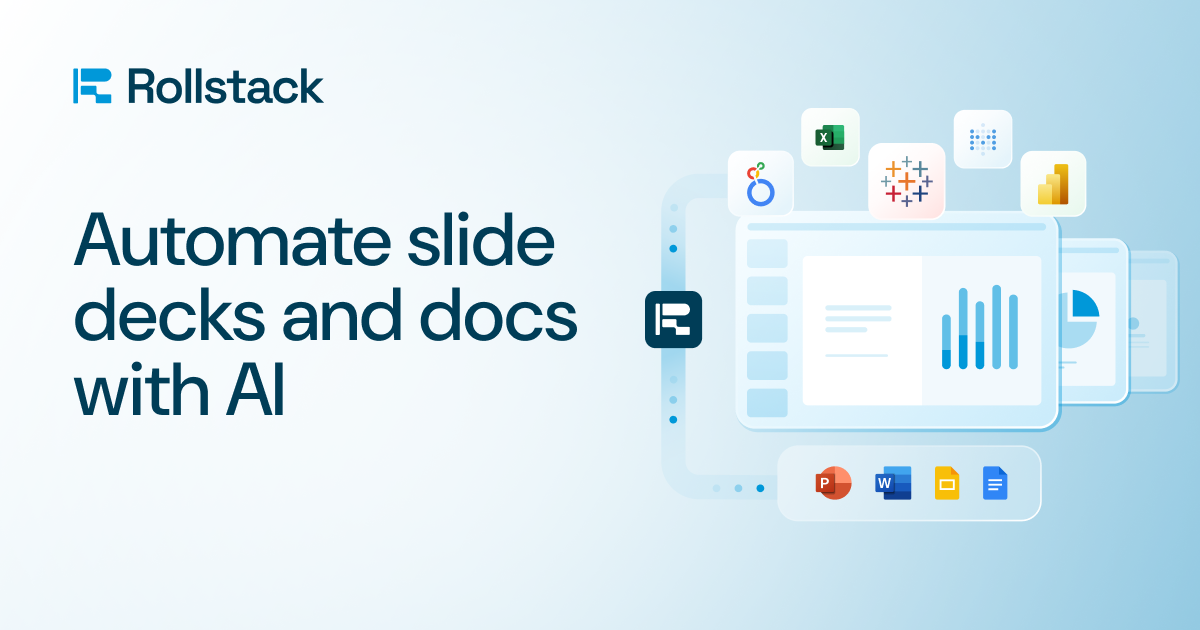
Rollstack est une plateforme d'automatisation qui connecte vos outils de business intelligence (comme Tableau, Power BI, Looker) et vos entrepôts de données (Snowflake) directement à PowerPoint et Google Slides. Elle élimine la saisie manuelle de données et les captures d'écran, permettant aux équipes de créer et de mettre à jour automatiquement des présentations basées sur les données. Cela permet de gagner un temps considérable, de réduire les erreurs et de garantir que les rapports sont toujours basés sur les données les plus récentes.
Aperçu du produit
Graphy Aperçu du produit
Graphy est un outil de visualisation de données alimenté par l'IA qui transforme les données brutes en graphiques magnifiques et interactifs en quelques secondes. Il simplifie la narration de données (data storytelling) en identifiant automatiquement les informations clés, en permettant aux utilisateurs de discuter avec leurs données et en offrant une personnalisation étendue. Idéal pour les marketeurs, les analystes et les équipes qui ont besoin de créer des rapports visuels et des présentations percutants sans logiciel complexe.
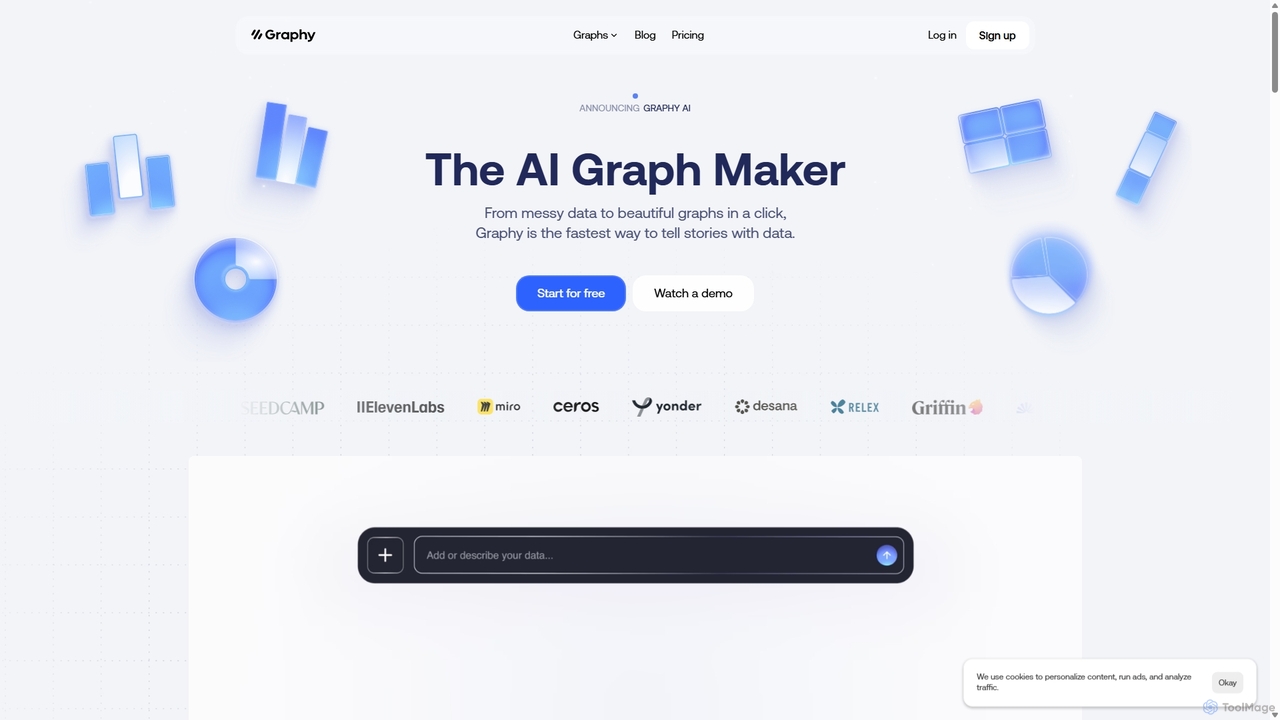
Rollstack Aperçu du produit
Rollstack est une plateforme d'automatisation qui connecte vos outils de business intelligence (comme Tableau, Power BI, Looker) et vos entrepôts de données (Snowflake) directement à PowerPoint et Google Slides. Elle élimine la saisie manuelle de données et les captures d'écran, permettant aux équipes de créer et de mettre à jour automatiquement des présentations basées sur les données. Cela permet de gagner un temps considérable, de réduire les erreurs et de garantir que les rapports sont toujours basés sur les données les plus récentes.
Detailed feature comparison
| Feature | Graphy | Rollstack |
|---|---|---|
| Catégorie principale | 3D | Informatique décisionnelle |
| Ajouté | 2025-09-21 | 2025-08-09 |
| Tarification | Freemium | Payant |
| Site officiel | graphy.app | www.rollstack.com |
| Type de produit | Site web | Site web |
| Performance data | ||
| Note utilisateur | Non vérifié | Non vérifié |
| Commentaires | 0 | 0 |
| Visites mensuelles | 167.6K | 17.4K |
| Croissance mensuelle | -16.3% | -7.9% |
| Favoris | 116 | 116 |
| Details | Voir les détails | Voir les détails |
Graphy vs Rollstack monthly traffic
Compare Graphy and Rollstack by monthly reach, traffic trend, visit depth, top regions, and acquisition sources.
How to interpret the traffic data
In the Graphy vs Rollstack monthly traffic comparison, Graphy currently shows 167.6K visits and Rollstack shows 17.4K; Graphy has about 9.6 times the visible traffic of Rollstack, an absolute difference of about 150.2K visits. This reflects visible reach, not feature quality or paid users.
Both tools provide verified traffic details, so monthly trends, visit depth, regions, and acquisition sources can be compared on the same basis.
Graphy monthly traffic:
Latest traffic
Monthly traffic trend
- 2025/9: 155.2K Visites mensuelles
- 2026/1: 177.6K Visites mensuelles
- 2026/2: 154.1K Visites mensuelles
- 2026/3: 164K Visites mensuelles
- 2026/4: 200.4K Visites mensuelles
- 2026/5: 167.6K Visites mensuelles
Principales régions
Top 5 countries/regions
| Country/region | Percentage | Traffic |
|---|---|---|
| 🇮🇳India | 34.73% | 58.2K |
| 🇰🇭Cambodia | 29.22% | 49K |
| 🇺🇸United States | 20.57% | 34.5K |
| 🇷🇺Russia | 8.1% | 13.6K |
| 🇲🇾Malaysia | 7.38% | 12.4K |
Sources de trafic
| Source type | Percentage | Traffic |
|---|---|---|
| Direct | 86.47% | 144.9K |
| Référence | 11.57% | 19.4K |
| 1.96% | 3.3K |
Mots-clés
Rollstack monthly traffic:
Latest traffic
Monthly traffic trend
- 2025/9: 19.8K Visites mensuelles
- 2026/1: 20.2K Visites mensuelles
- 2026/2: 19.6K Visites mensuelles
- 2026/3: 20.8K Visites mensuelles
- 2026/4: 18.9K Visites mensuelles
- 2026/5: 17.4K Visites mensuelles
Principales régions
Top 5 countries/regions
| Country/region | Percentage | Traffic |
|---|---|---|
| 🇺🇸United States | 51.29% | 8.9K |
| 🇮🇳India | 17.69% | 3.1K |
| 🇩🇪Germany | 11.83% | 2.1K |
| 🇮🇩Indonesia | 10.38% | 1.8K |
| 🇧🇷Brazil | 8.81% | 1.5K |
Mots-clés
Usage comparison
Compare the core capabilities of Graphy and Rollstack
Graphy Core features
Rollstack Core features
Use cases
Graphy Use cases
Rollstack Use cases
Best suited roles
Graphy Best suited roles
Rollstack Best suited roles
Graphy vs Rollstack:In-depth comparison and selection guidance
First decide whether the products solve the same kind of need
This in-depth Graphy vs Rollstack comparison uses only the product records, taxonomy, audience, traffic, and community signals available on this page. Graphy is primarily listed under “3D”, while Rollstack is primarily listed under “Informatique décisionnelle”, so the first decision is whether your actual task matches their recorded scope.
The structured fields currently show these decision-relevant differences: Primary category (Graphy: 3D; Rollstack: Informatique décisionnelle); Pricing (Graphy: Freemium; Rollstack: Paid); Monthly visits (Graphy: 167.6K; Rollstack: 17.4K); Monthly growth (Graphy: -16.3%; Rollstack: -7.9%); Website (Graphy: graphy.app; Rollstack: www.rollstack.com). These facts are more useful for selection than brand visibility alone.
What market visibility and monthly traffic mean
In the Graphy vs Rollstack monthly traffic comparison, Graphy currently shows 167.6K visits and Rollstack shows 17.4K; Graphy has about 9.6 times the visible traffic of Rollstack, an absolute difference of about 150.2K visits. This reflects visible reach, not feature quality or paid users.
Both tools provide verified traffic details, so monthly trends, visit depth, regions, and acquisition sources can be compared on the same basis.
If public market visibility is an important first-pass criterion, investigate Graphy first. The final choice should still follow taxonomy, use case, and a real trial because higher traffic does not prove broader capabilities or better workflow fit.
Product positioning, use cases, and roles
Graphy and Rollstack currently overlap in shared categories: Informatique décisionnelle, Rapports et Présentations; shared tags: Informatique décisionnelle et visualisation de données. This can place both on the same shortlist, but it does not prove equal implementation, depth, or cost.
Graphy's unique categories/tags are 3D, IA, Créateur de graphiques, Tableau de bord, analyse de données, Narration de données, Excel et Google Feuilles de calcul; Rollstack's are Automatisation, Rapports automatisés, Rapports de données, Google Présentations, Looker, Power BI, Automatisation PowerPoint et Automatisation de Présentation. These unique fields are the strongest differentiators: validate the product whose recorded scope matches the task instead of following traffic alone.
What ratings, comments, and favorites can tell you
Graphy has no verified rating, 0 comments, 116 favorites, and 123 likes;Rollstack has no verified rating, 0 comments, 116 favorites, and 121 likes。
Neither product has enough rating or comment samples for a credible reputation ranking.
Selection guidance by actual need
When to evaluate Graphy first
Put Graphy on the priority trial list when the task aligns with “3D” and especially 3D, IA, Créateur de graphiques, Tableau de bord, analyse de données et Narration de données, or the users include Propriétaire d'entreprise, Consultant, Créateur de contenu et Analyste de données. This follows recorded positioning and does not imply unlisted capabilities are absent.
Graphy also currently records: pricing is freemium, product type is website, 167.6K verified monthly visits, no verified user rating. Verify any hard requirement around price, platform, or reach before trial, and do not let sparse review data substitute for testing.
When to evaluate Rollstack first
Put Rollstack on the priority trial list when the task aligns with “Informatique décisionnelle” and especially Automatisation, Rapports automatisés, Rapports de données, Google Présentations, Looker et Power BI. This follows recorded positioning and does not imply unlisted capabilities are absent.
Rollstack also currently records: pricing is paid, product type is website, 17.4K verified monthly visits, no verified user rating. Verify any hard requirement around price, platform, or reach before trial, and do not let sparse review data substitute for testing.
How to validate the recommendation before deciding
The available data describes positioning, public visibility, and community signals, but it cannot prove output quality, speed, integration effort, privacy, or long-term cost in your workflow. Before deciding, run the same representative tasks in Graphy and Rollstack, then record completion time, accuracy, manual corrections, and the real paid threshold. A like-for-like trial turns this comparison into a defensible adoption decision.