aigraphmaker
分析 · 24.6K 月間訪問数
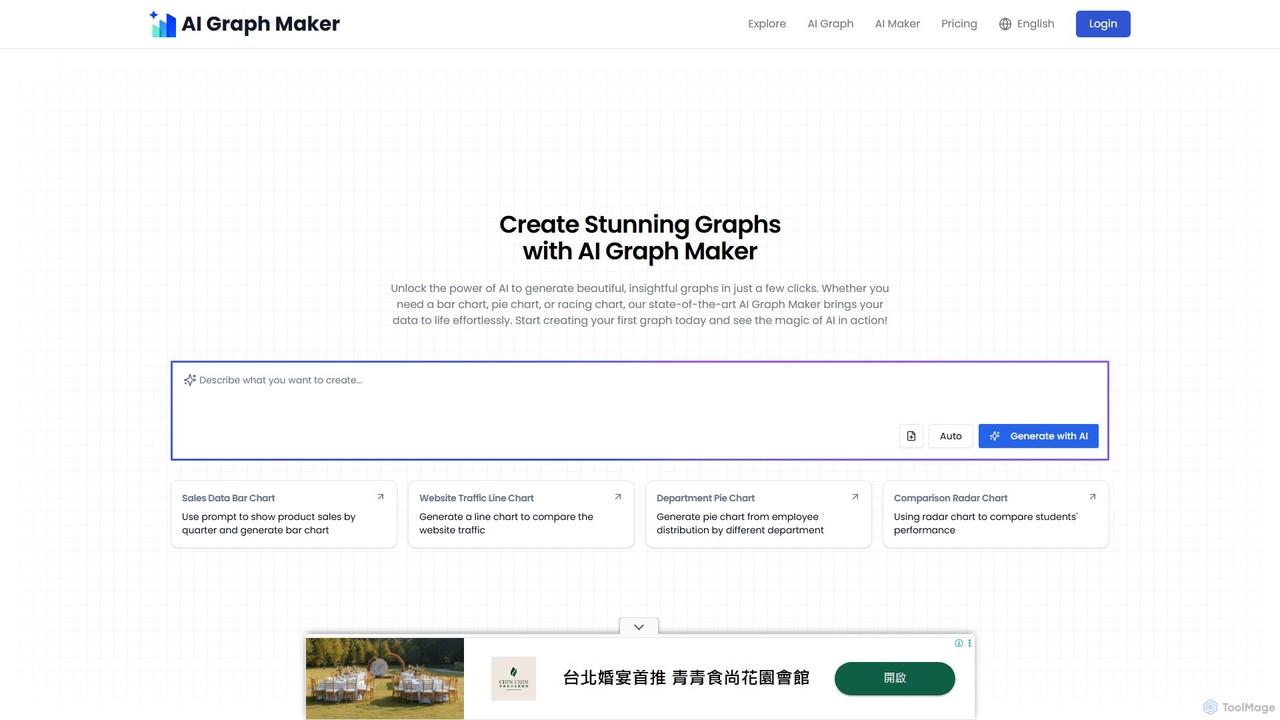
aigraphmakerは、AIを搭載したプラットフォームで、生データやテキストプロンプトを多種多様なプロフェッショナルでインタラクティブなチャートや図に変換します。初心者から専門家まで、コーディングやデザインのスキルがなくても、棒グラフ、マインドマップ、フローチャート、ナレッジグラフなどの見事なビジュアルを数秒で簡単に作成できます。
aigraphmakerは、AIを搭載したプラットフォームで、生データやテキストプロンプトを多種多様なプロフェッショナルでインタラクティブなチャートや図に変換します。初心者から専門家まで、コーディングやデザインのスキルがなくても、棒グラフ、マインドマップ、フローチャート、ナレッジグラフなどの見事なビジュアルを数秒で簡単に作成できます。
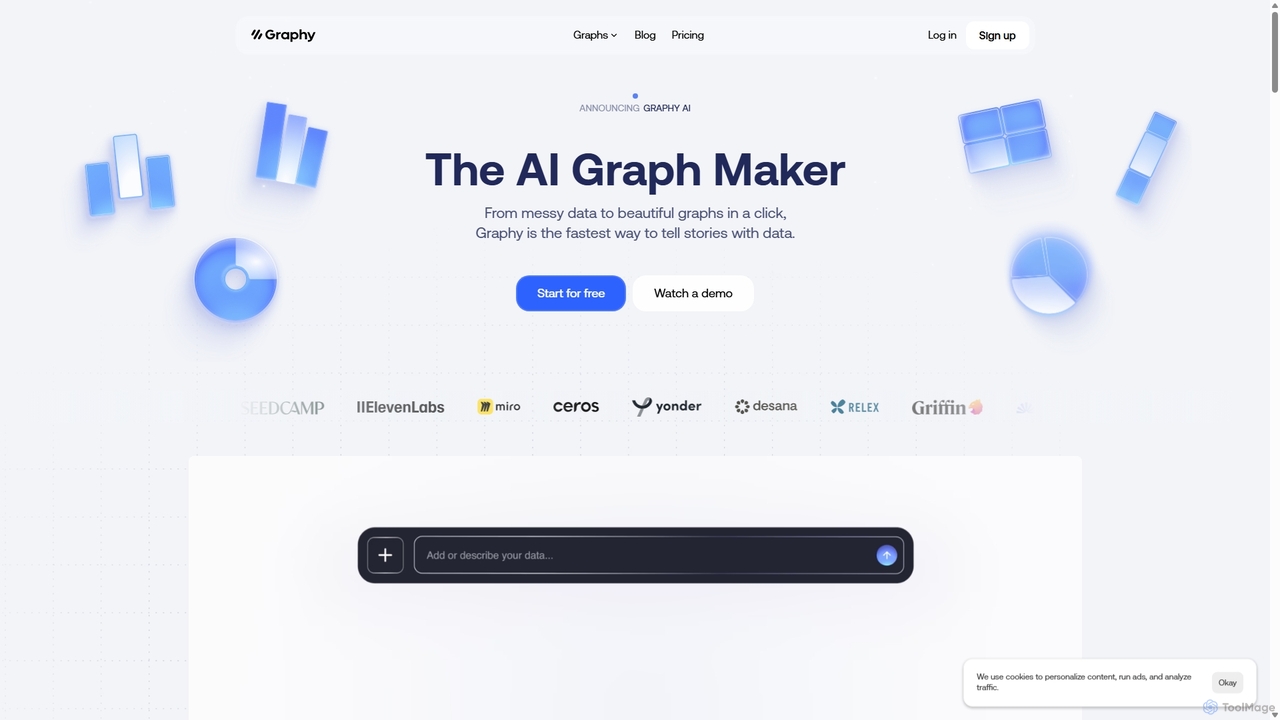
Graphyは、AIを搭載したデータ可視化ツールで、生データを数秒で美しくインタラクティブなチャートやグラフに変換します。主要なインサイトを自動的に特定し、ユーザーがデータと対話し、広範なカスタマイズを提供することで、データストーリーテリングを簡素化します。複雑なソフトウェアなしで魅力的なビジュアルレポートやプレゼンテーションを作成する必要があるマーケター、アナリスト、チームに最適です。
aigraphmakerは、AIを搭載したプラットフォームで、生データやテキストプロンプトを多種多様なプロフェッショナルでインタラクティブなチャートや図に変換します。初心者から専門家まで、コーディングやデザインのスキルがなくても、棒グラフ、マインドマップ、フローチャート、ナレッジグラフなどの見事なビジュアルを数秒で簡単に作成できます。
Graphyは、AIを搭載したデータ可視化ツールで、生データを数秒で美しくインタラクティブなチャートやグラフに変換します。主要なインサイトを自動的に特定し、ユーザーがデータと対話し、広範なカスタマイズを提供することで、データストーリーテリングを簡素化します。複雑なソフトウェアなしで魅力的なビジュアルレポートやプレゼンテーションを作成する必要があるマーケター、アナリスト、チームに最適です。
| Feature | aigraphmaker | Graphy |
|---|---|---|
| 主要カテゴリー | 分析 | 3D |
| 追加日 | 2025-08-06 | 2025-09-21 |
| 価格 | フリーミアム | フリーミアム |
| 公式サイト | aigraphmaker.net | graphy.app |
| 製品タイプ | ウェブサイト | ウェブサイト |
| Performance data | ||
| ユーザー評価 | 未確認 | 未確認 |
| コメント | 0 | 0 |
| 月間訪問数 | 24.6K | 167.6K |
| 月間成長率 | 19.2% | -16.3% |
| お気に入り | 137 | 116 |
| Details | 詳細を見る | 詳細を見る |
Compare aigraphmaker and Graphy by monthly reach, traffic trend, visit depth, top regions, and acquisition sources.
In the aigraphmaker vs Graphy monthly traffic comparison, aigraphmaker currently shows 24.6K visits and Graphy shows 167.6K; Graphy has about 6.8 times the visible traffic of aigraphmaker, an absolute difference of about 143.1K visits. This reflects visible reach, not feature quality or paid users.
Both tools provide verified traffic details, so monthly trends, visit depth, regions, and acquisition sources can be compared on the same basis.
| Country/region | Percentage | Traffic |
|---|---|---|
| 🇷🇺Russia | 39.13% | 9.6K |
| 🇺🇸United States | 19.87% | 4.9K |
| 🇻🇳Vietnam | 15.3% | 3.8K |
| 🇪🇸Spain | 12.95% | 3.2K |
| 🇹🇼Taiwan | 12.75% | 3.1K |
| Country/region | Percentage | Traffic |
|---|---|---|
| 🇮🇳India | 34.73% | 58.2K |
| 🇰🇭Cambodia | 29.22% | 49K |
| 🇺🇸United States | 20.57% | 34.5K |
| 🇷🇺Russia | 8.1% | 13.6K |
| 🇲🇾Malaysia | 7.38% | 12.4K |
| Source type | Percentage | Traffic |
|---|---|---|
| ダイレクト | 86.47% | 144.9K |
| 参照元 | 11.57% | 19.4K |
| Eメール | 1.96% | 3.3K |
This in-depth aigraphmaker vs Graphy comparison uses only the product records, taxonomy, audience, traffic, and community signals available on this page. aigraphmaker is primarily listed under “分析”, while Graphy is primarily listed under “3D”, so the first decision is whether your actual task matches their recorded scope.
The structured fields currently show these decision-relevant differences: Primary category (aigraphmaker: 分析; Graphy: 3D); Monthly visits (aigraphmaker: 24.6K; Graphy: 167.6K); Monthly growth (aigraphmaker: 19.2%; Graphy: -16.3%); Favorites (aigraphmaker: 137; Graphy: 116); Website (aigraphmaker: aigraphmaker.net; Graphy: graphy.app). These facts are more useful for selection than brand visibility alone.
In the aigraphmaker vs Graphy monthly traffic comparison, aigraphmaker currently shows 24.6K visits and Graphy shows 167.6K; Graphy has about 6.8 times the visible traffic of aigraphmaker, an absolute difference of about 143.1K visits. This reflects visible reach, not feature quality or paid users.
Both tools provide verified traffic details, so monthly trends, visit depth, regions, and acquisition sources can be compared on the same basis.
If public market visibility is an important first-pass criterion, investigate Graphy first. The final choice should still follow taxonomy, use case, and a real trial because higher traffic does not prove broader capabilities or better workflow fit.
aigraphmaker and Graphy currently overlap in shared categories: レポート; shared tags: ビジネスインテリジェンス、チャートメーカー、データ分析、データ視覚化. This can place both on the same shortlist, but it does not prove equal implementation, depth, or cost.
aigraphmaker's unique categories/tags are 分析、教育、データ視覚化、AIチャート、図作成ツール、フローチャート、ガントチャート、グラフジェネレーター; Graphy's are 3D、ビジネスインテリジェンス、プレゼンテーション、AI、ダッシュボード、データストーリーテリング、Excel、Google スプレッドシート. These unique fields are the strongest differentiators: validate the product whose recorded scope matches the task instead of following traffic alone.
aigraphmaker has no verified rating, 0 comments, 137 favorites, and 126 likes;Graphy has no verified rating, 0 comments, 116 favorites, and 123 likes。
Neither product has enough rating or comment samples for a credible reputation ranking.
Put aigraphmaker on the priority trial list when the task aligns with “分析” and especially 分析、教育、データ視覚化、AIチャート、図作成ツール、フローチャート. This follows recorded positioning and does not imply unlisted capabilities are absent.
aigraphmaker also currently records: pricing is freemium, product type is website, 24.6K verified monthly visits, no verified user rating. Verify any hard requirement around price, platform, or reach before trial, and do not let sparse review data substitute for testing.
Put Graphy on the priority trial list when the task aligns with “3D” and especially 3D、ビジネスインテリジェンス、プレゼンテーション、AI、ダッシュボード、データストーリーテリング, or the users include 事業主、コンサルタント、コンテンツクリエイター、データアナリスト. This follows recorded positioning and does not imply unlisted capabilities are absent.
Graphy also currently records: pricing is freemium, product type is website, 167.6K verified monthly visits, no verified user rating. Verify any hard requirement around price, platform, or reach before trial, and do not let sparse review data substitute for testing.
The available data describes positioning, public visibility, and community signals, but it cannot prove output quality, speed, integration effort, privacy, or long-term cost in your workflow. Before deciding, run the same representative tasks in aigraphmaker and Graphy, then record completion time, accuracy, manual corrections, and the real paid threshold. A like-for-like trial turns this comparison into a defensible adoption decision.
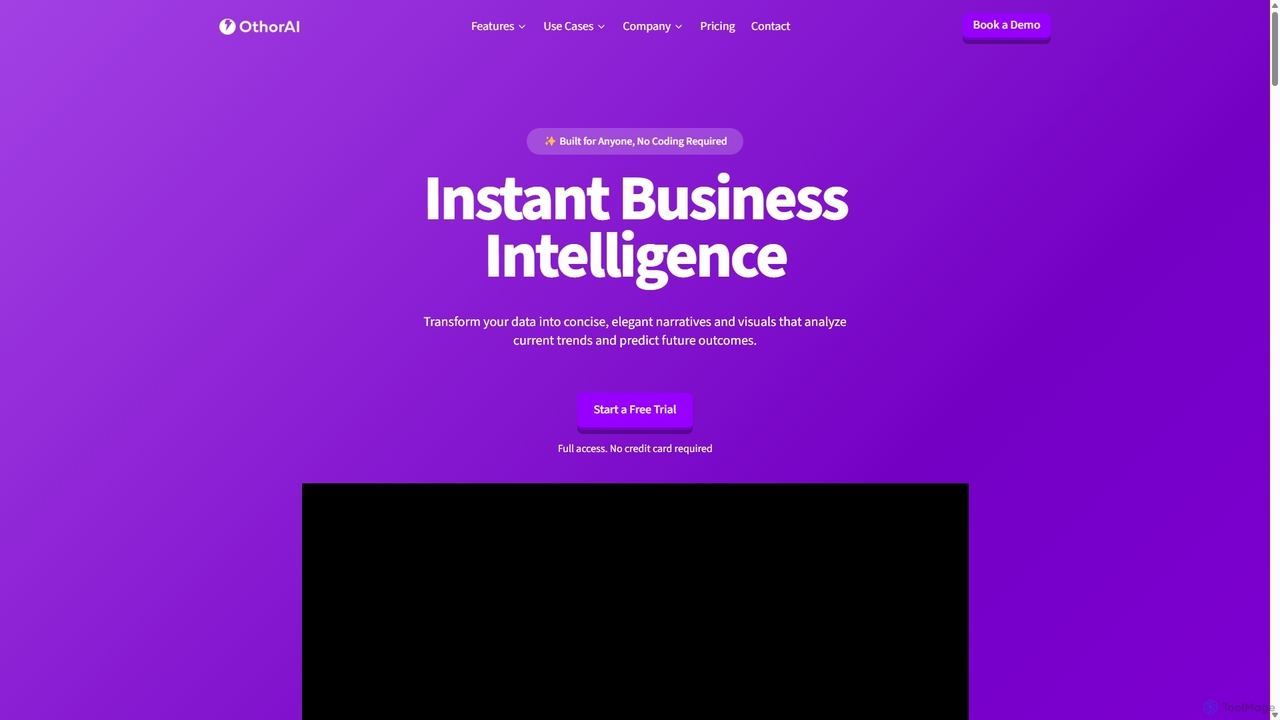
Othor AIは、ノーコードのビジネスインテリジェンスプラットフォームで、データを数秒で実用的なインサイトに変換します。物語形式のレポート、スマートチャート、予測分析を自動生成し、組織の誰もが技術的な専門知識なしで、より迅速にデータに基づいた意思決定を行えるようにします。データソースを接続するだけで、即座にダッシュボードとエグゼクティブサマリーを入手できます。
ビジネスインテリジェンス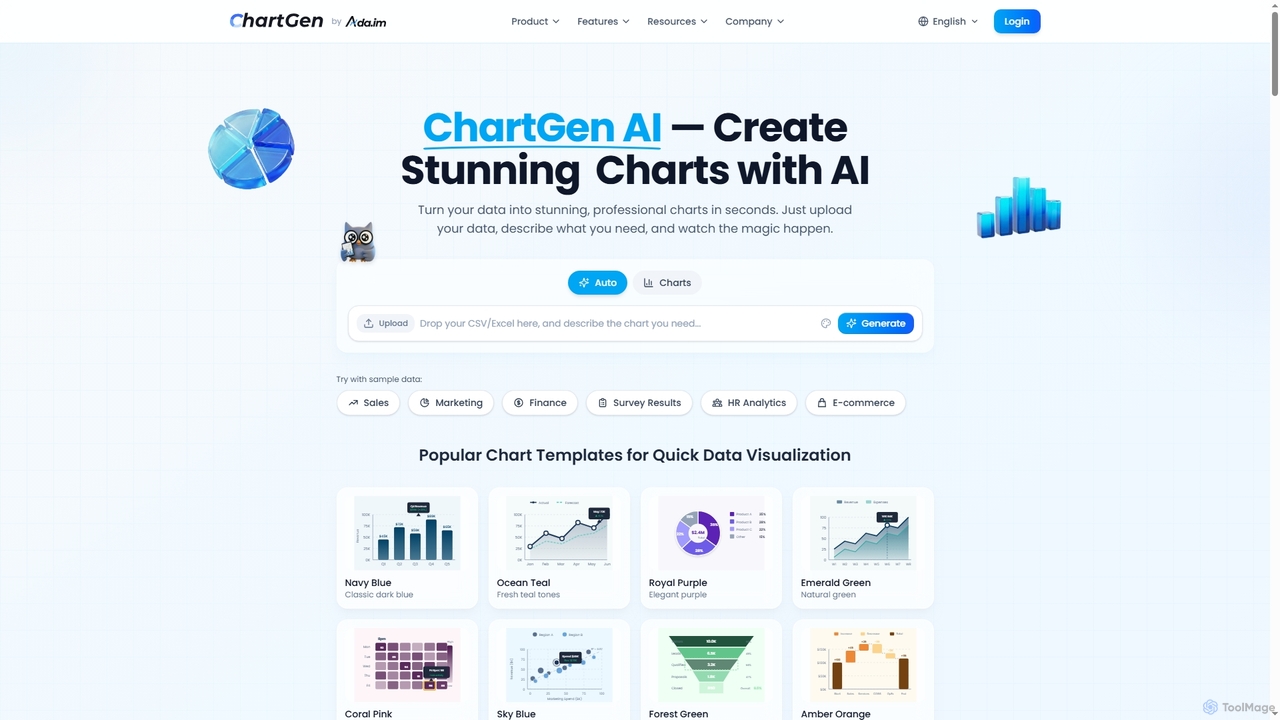
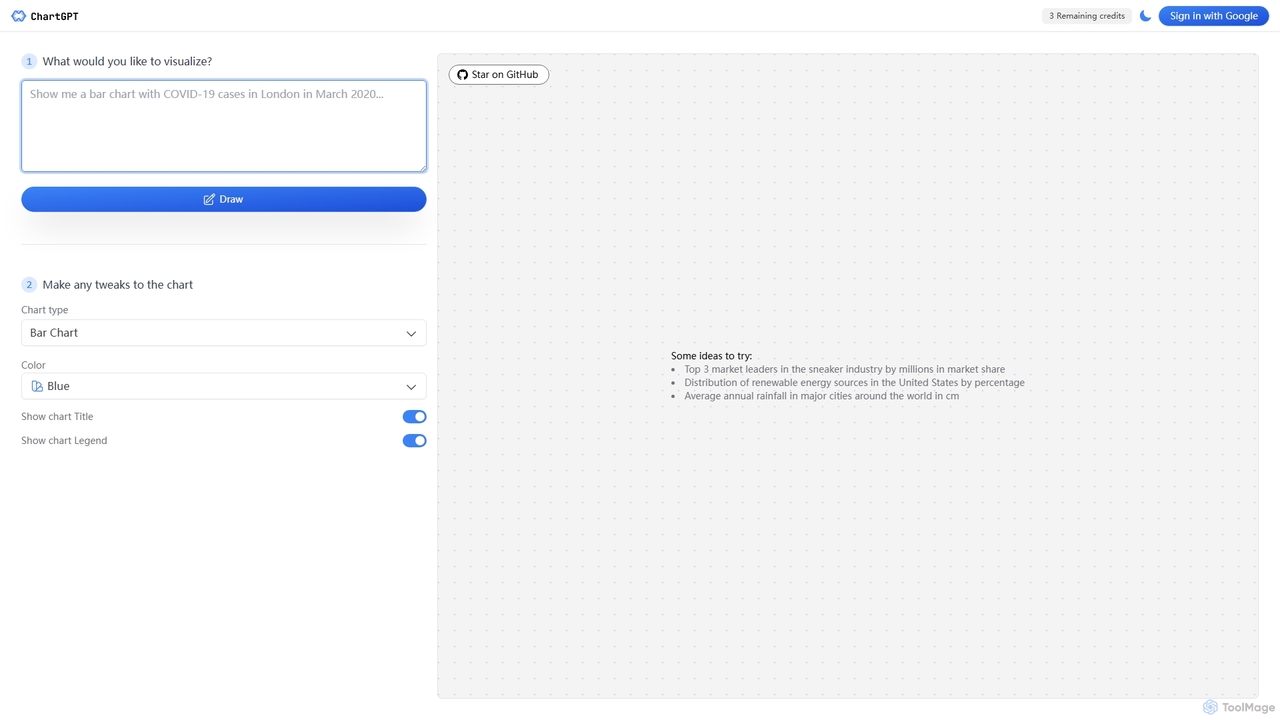
ChartGPTは、自然言語のテキストプロンプトを多様で美しいチャートやグラフに変換するAI搭載ツールです。視覚化したいデータを説明するだけで、ChartGPTが即座にカスタマイズ可能なチャートを生成し、技術的なスキルに関係なく誰もがデータ視覚化を利用できるようにします。
ビジネスインテリジェンス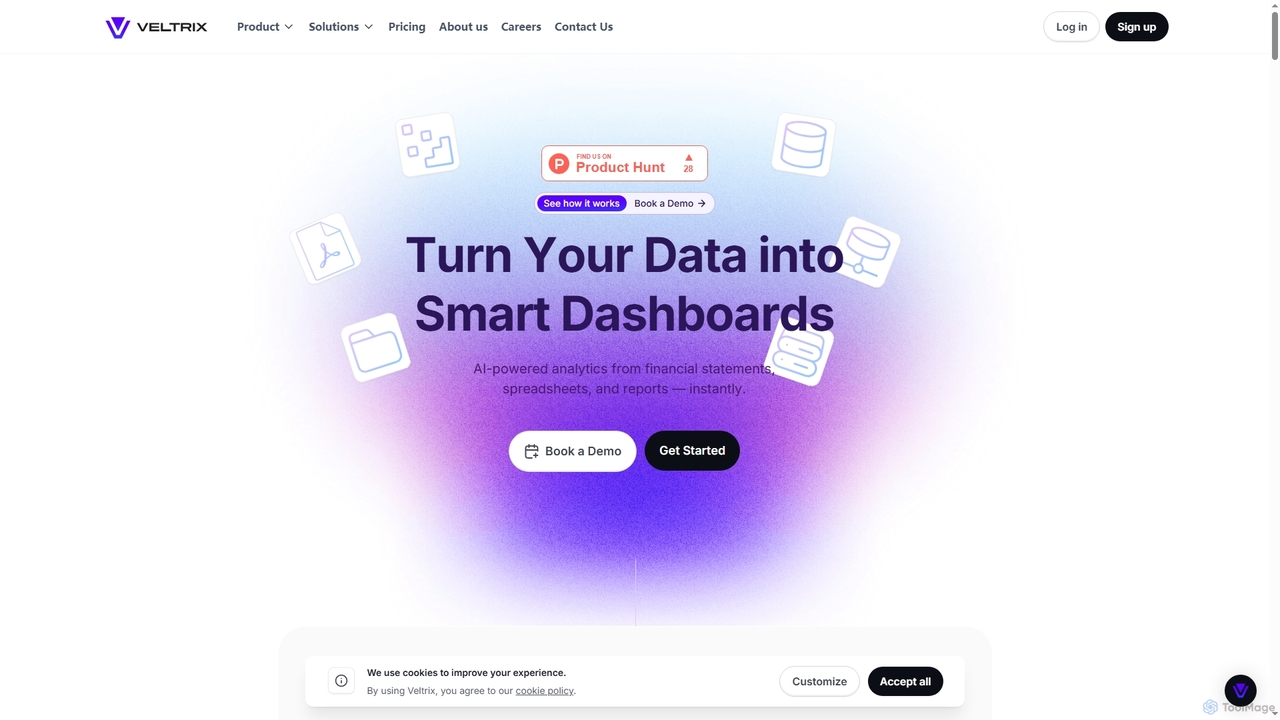
Veltrixは、ファイルや接続されたソースからの生データを対話型ダッシュボードに変換するAI搭載のノーコードプラットフォームです。ユーザーは平易な言葉で質問し、ビジネスインテリジェンスや財務分析のための視覚化された回答を即座に得ることができます。
ビジネスインテリジェンス
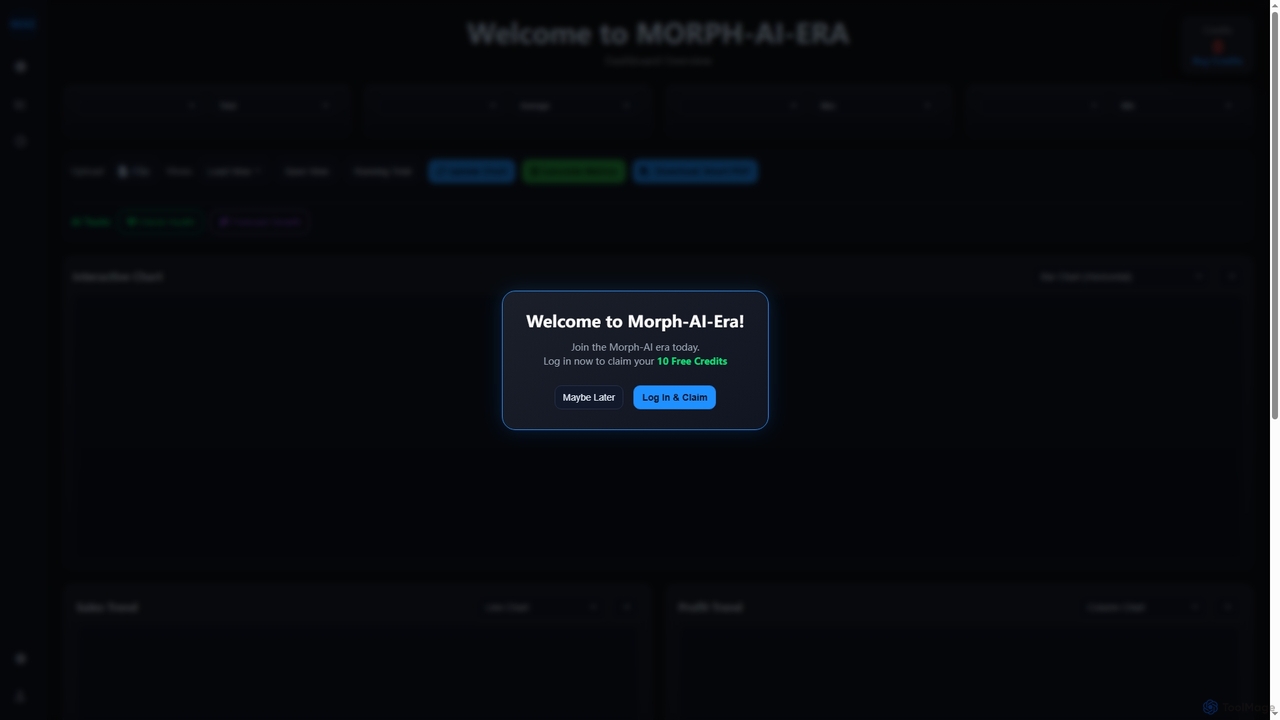
Morph Ai Eraは、AIを搭載したインタラクティブなデータ分析ダッシュボードです。ユーザーはデータをアップロードし、多種多様な視覚化を作成し、AIツールを活用して自動的な洞察、成長予測、異常検出を行うことができます。生データを実用的なビジネスインテリジェンスに変換するために設計されています。
ビジネスインテリジェンス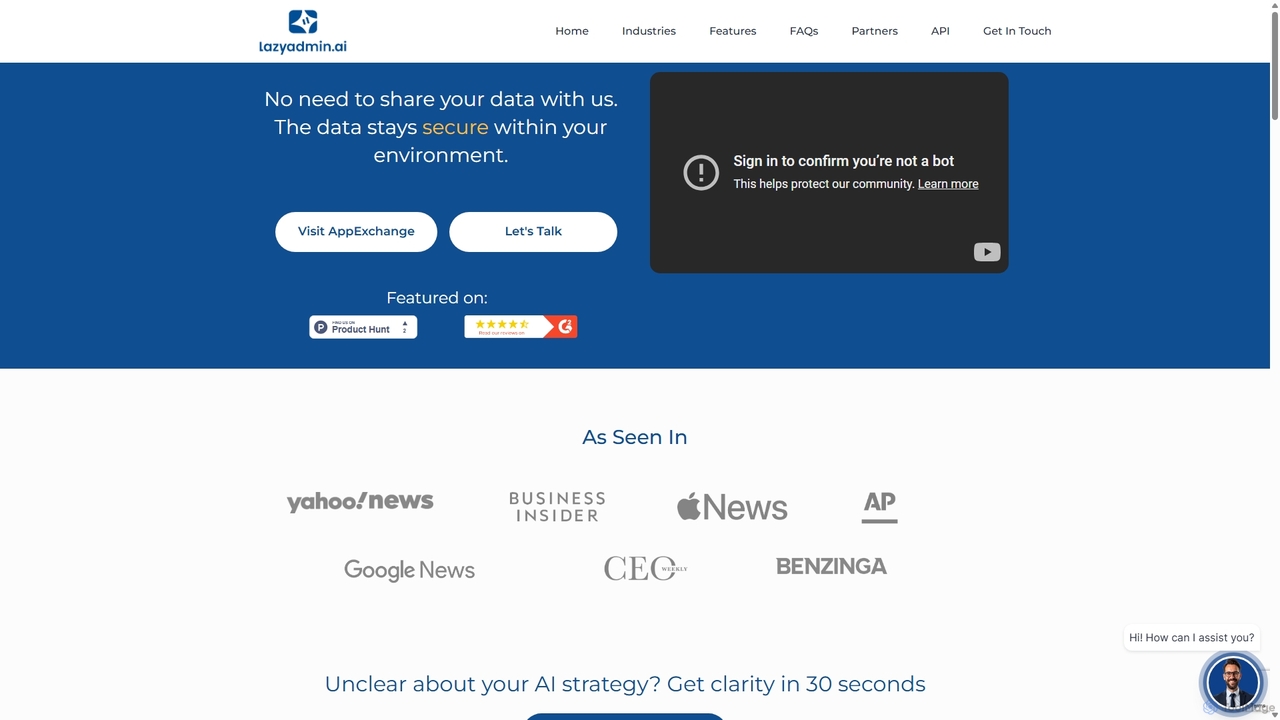
Lazy Adminは、主にSalesforce向けに設計されたAI搭載のデータ分析およびレポートソリューションです。自然言語を使用してデータをクエリし、チャートを生成し、ダッシュボードを作成できます。このツールは、すべてのデータを環境内に保持することでセキュリティを重視し、特定のビジネス用語を理解するようにパーソナライズできるため、チームの誰もがデータインサイトに簡単にアクセスできます。
ビジネスインテリジェンス
Flarelightは、データ分析と可視化のためのAI搭載ノーコード・ビジネスインテリジェンスプラットフォームです。あらゆるソースからデータをインポートし、視覚的に準備し、詳細な分析を行い、インタラクティブなレポートを作成できます。このオールインワンツールはクラウドとオンプレミスの両方のデプロイをサポートし、ワークフローの自動化と自然言語設定により、複雑なデータを実用的な意思決定に変えます。
ノーコード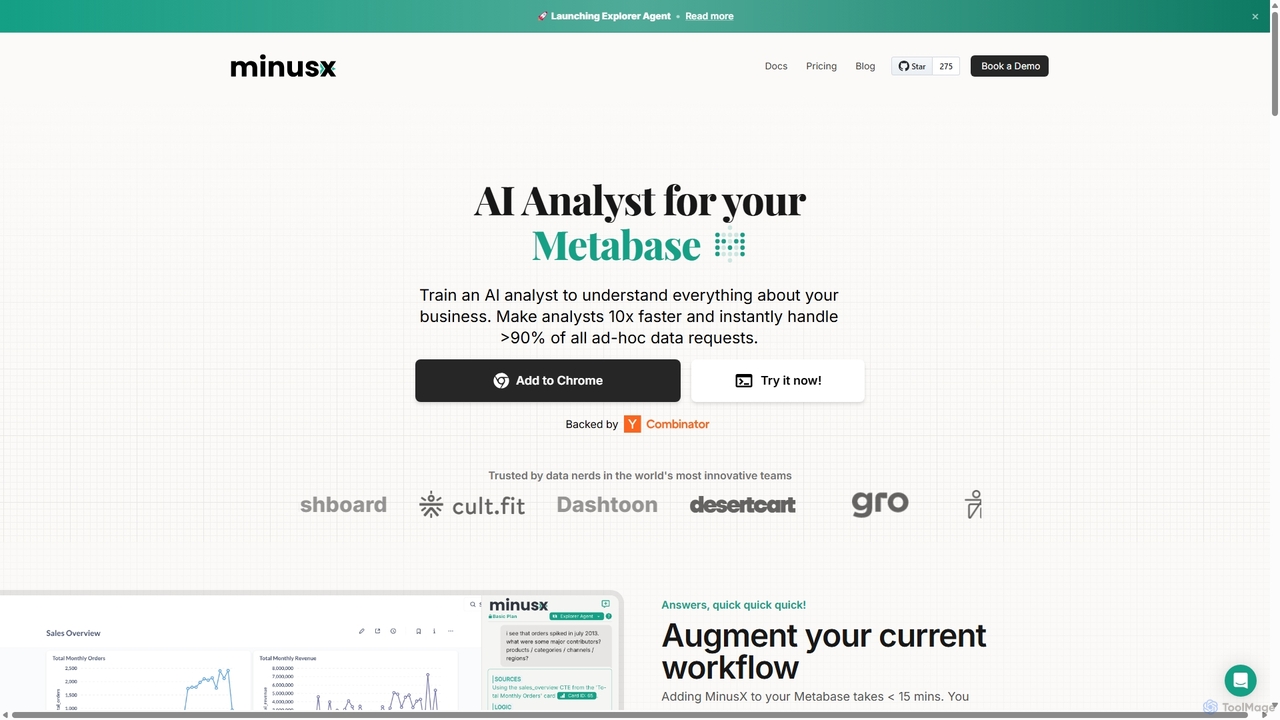
ChartGPTは、自然言語のプロンプトや生データを、見事でカスタマイズ可能なチャートやグラフに変換するAI搭載ツールです。コーディングは一切不要で、見たいものを説明するだけで、棒グラフ、折れ線グラフ、円グラフなどの複雑な視覚化を簡単に作成できます。
インフォグラフィックス
簡単な自然言語の対話を通じて、データを洞察に満ちた視覚化や要約に変換するAI搭載チャットボットです。データセットをアップロードして質問するだけで、即座にチャートやグラフ、主要な指標を受け取ることができ、複雑なソフトウェアやコーディングスキルがなくても誰もがデータ分析を行えます。
ビジネスインテリジェンス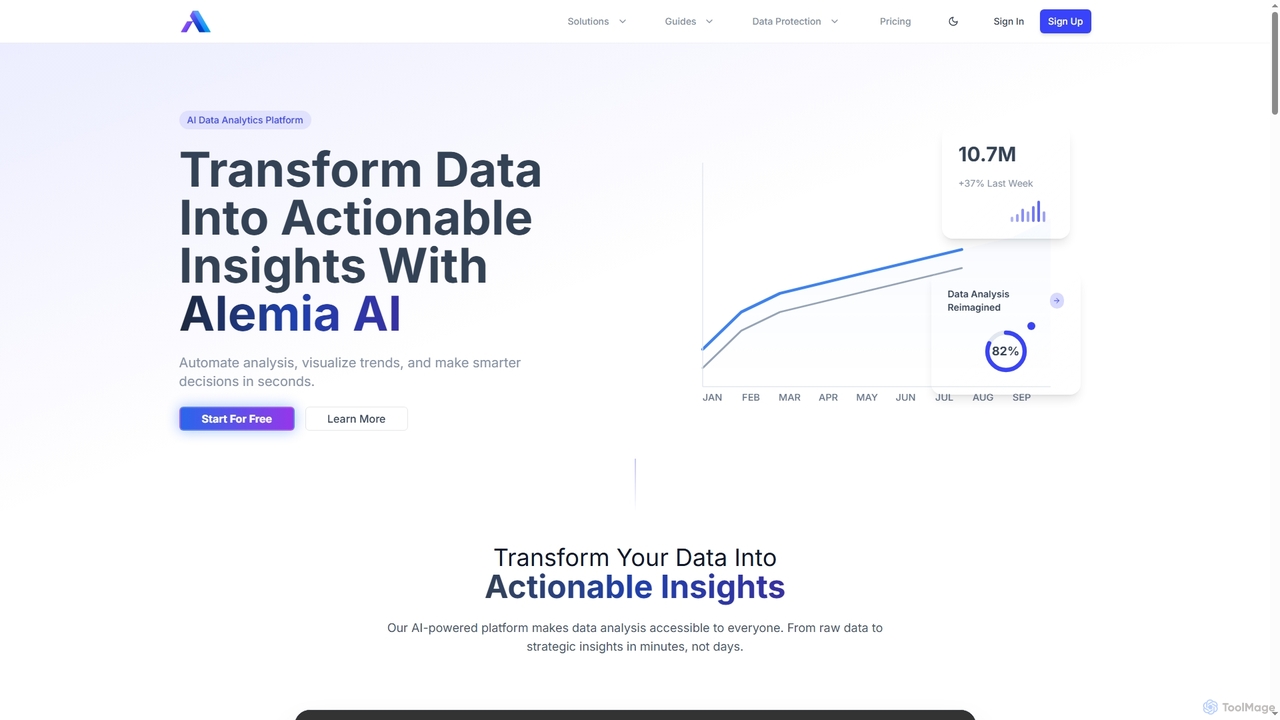
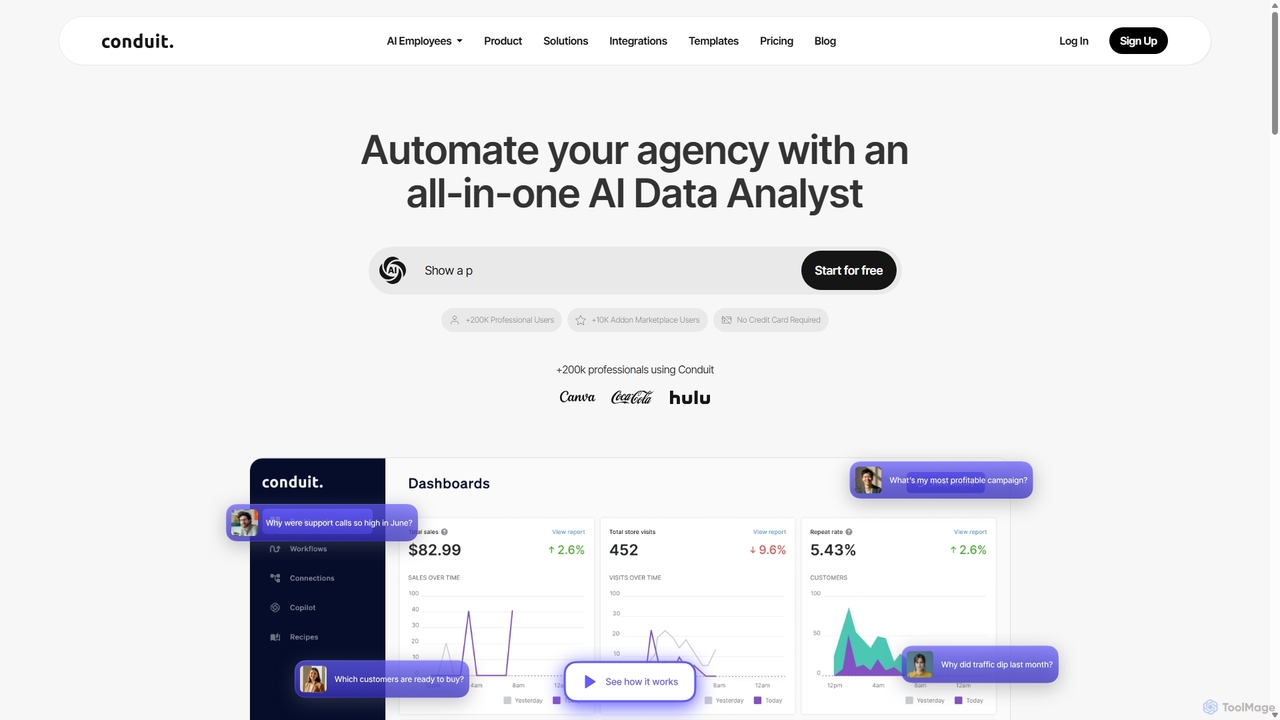
Conduitは、代理店やビジネスを自動化するために設計されたオールインワンのAIデータアナリストプラットフォームです。CRM、広告プラットフォーム、データベースなど数百のソースからのデータを一元化し、ユーザーが自動化されたワークフローを構築し、インタラクティブなダッシュボードを作成し、自然言語のAIコパイロットを使用してデータを照会できるようにします。マーケティングチーム、データアナリスト、開発者が時間を節約し、精度を向上させ、より迅速なデータ駆動型の意思決定を行えるように構築されています。
ビジネスインテリジェンス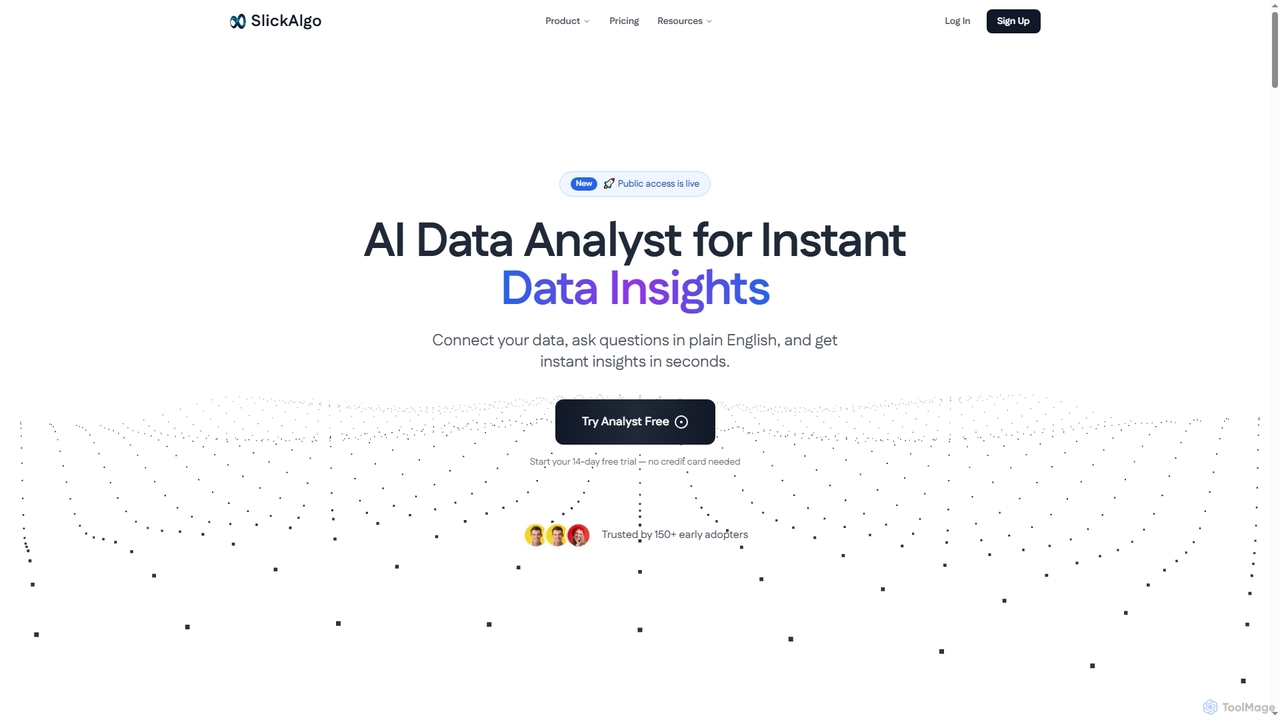
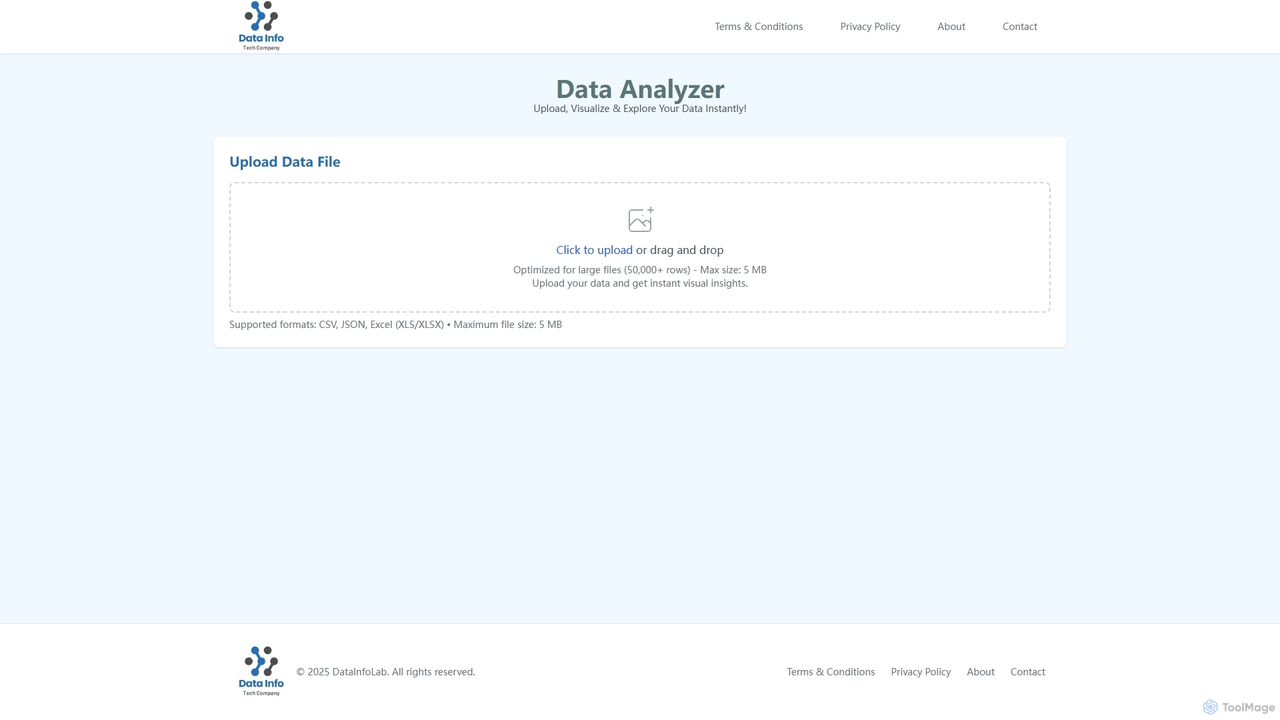
Data Analyzerは、即座のデータ視覚化と探索のために設計された直感的なAI搭載ツールです。ユーザーはCSV、JSON、Excelなどの様々なデータファイル形式をアップロードし、視覚的な洞察を素早く得て、グローバルな統計、トレンド、データパターンを理解できます。大規模なデータセットの処理に最適化されており、複雑なデータ分析をアクセスしやすく効率的にします。
視覚化