Biyond
クリプト · 1.7K 月間訪問数
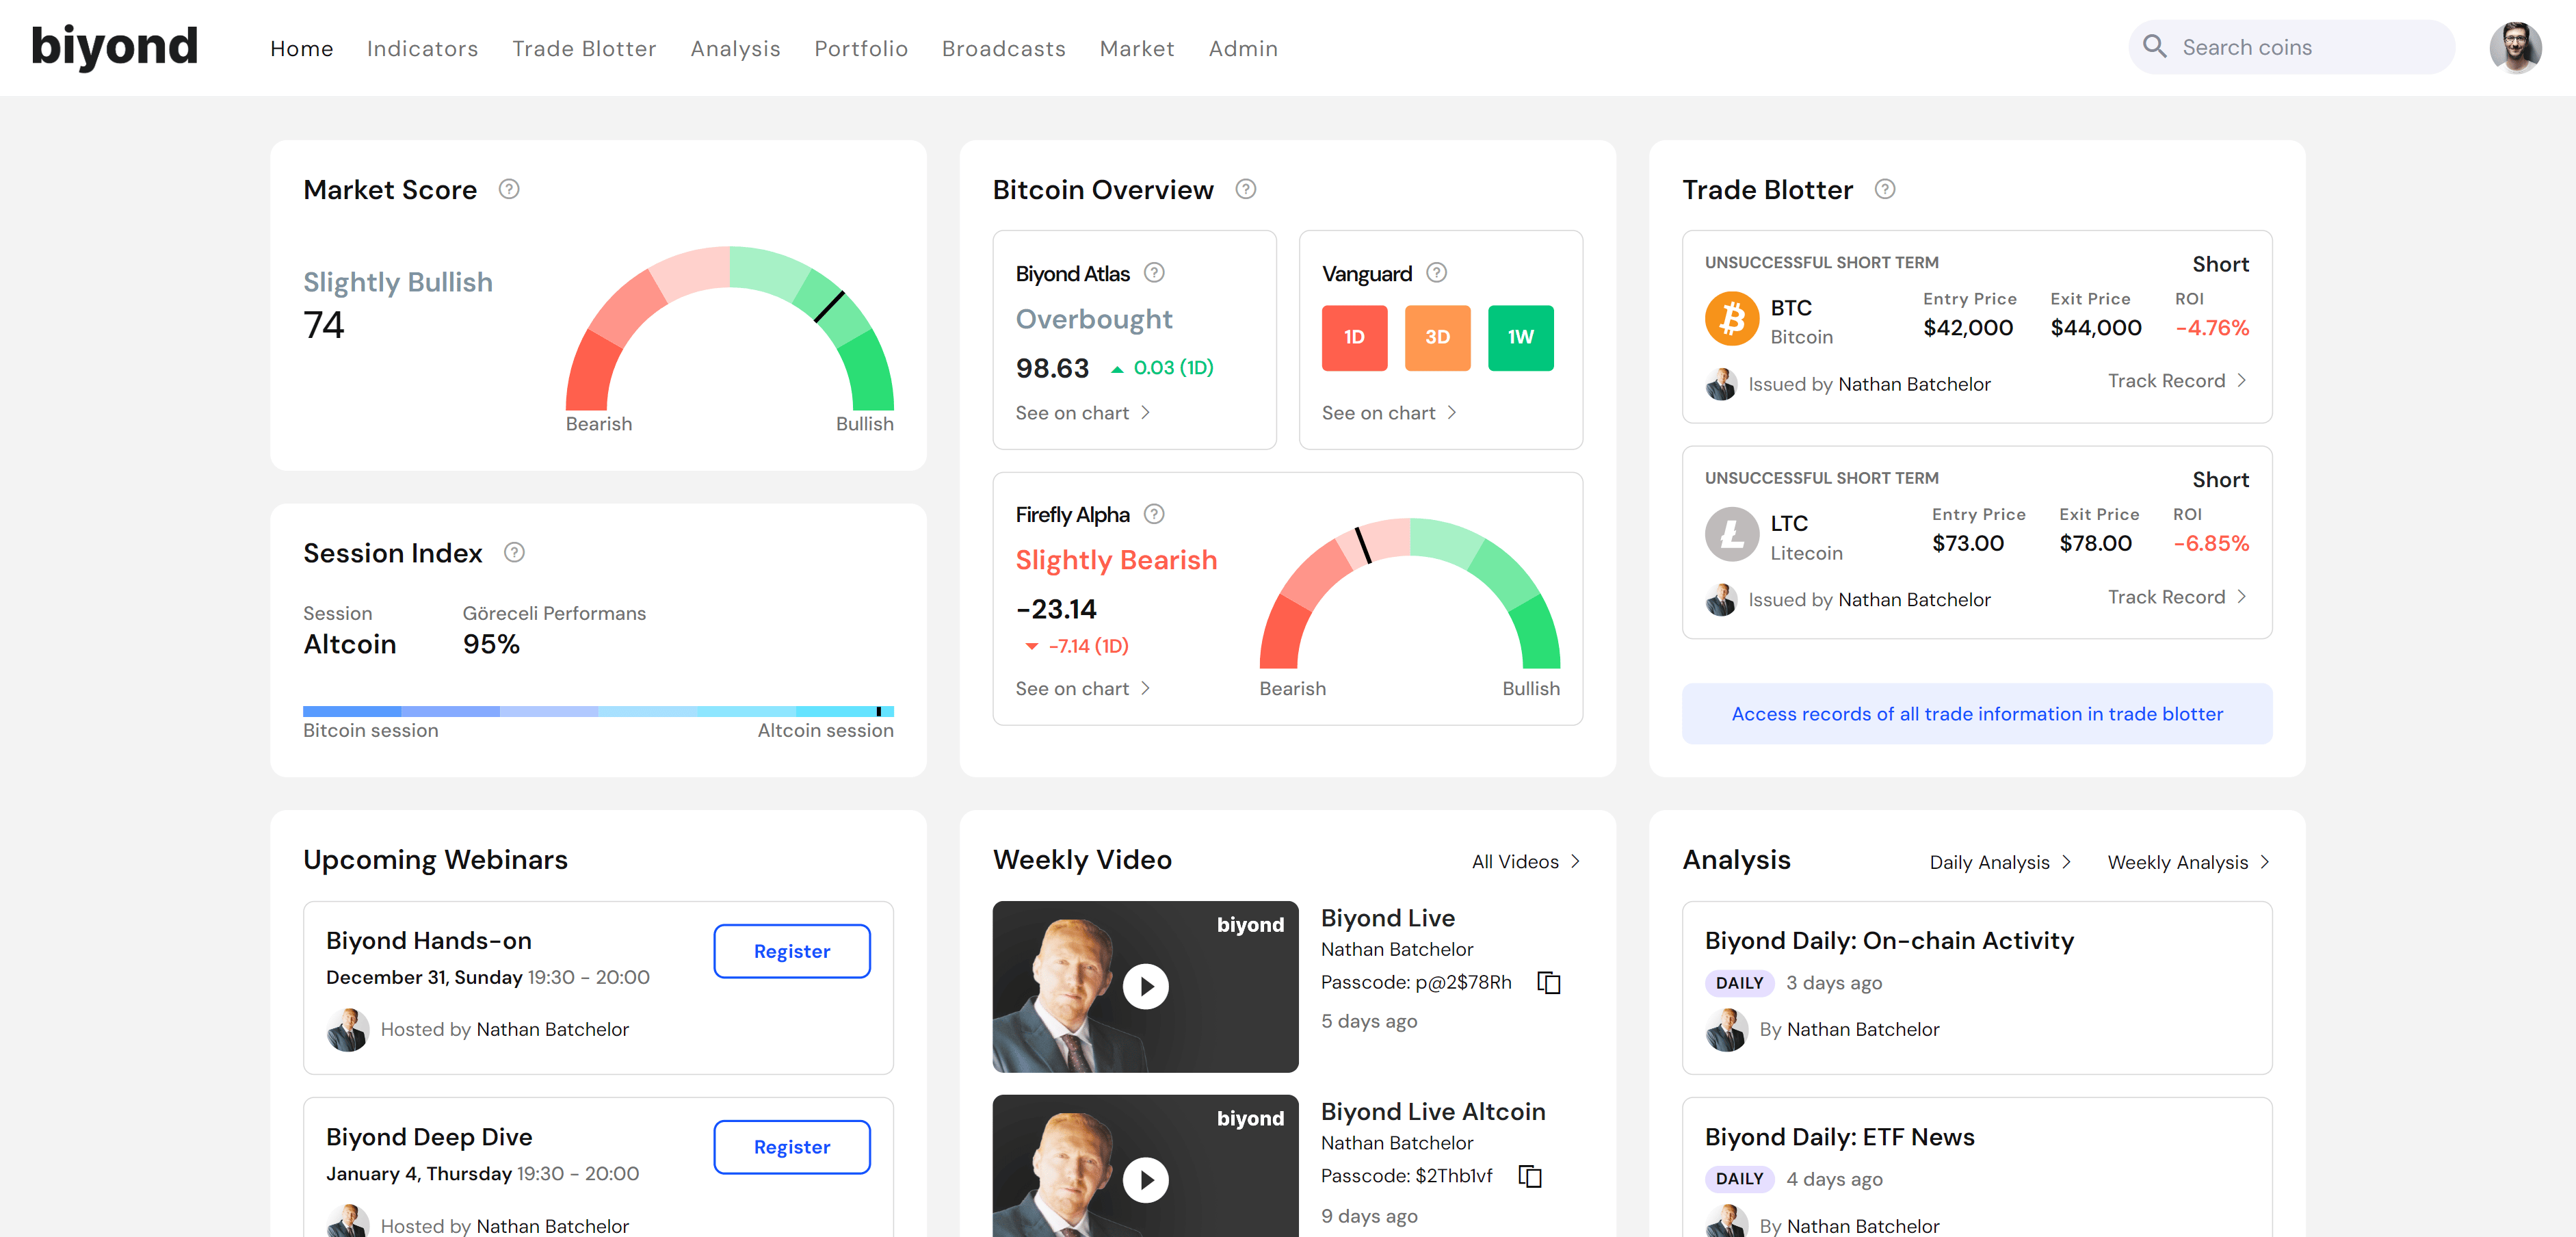
Biyondは、独自の取引指標、専門的な市場インテリジェンス、実行可能な投資戦略を提供するAI搭載の定量的暗号資産分析プラットフォームです。機械学習とプロのトレーダーの洞察を組み合わせ、あらゆるレベルの投資家が変動の激しい暗号資産市場を乗り切るのを支援します。
Biyondは、独自の取引指標、専門的な市場インテリジェンス、実行可能な投資戦略を提供するAI搭載の定量的暗号資産分析プラットフォームです。機械学習とプロのトレーダーの洞察を組み合わせ、あらゆるレベルの投資家が変動の激しい暗号資産市場を乗り切るのを支援します。
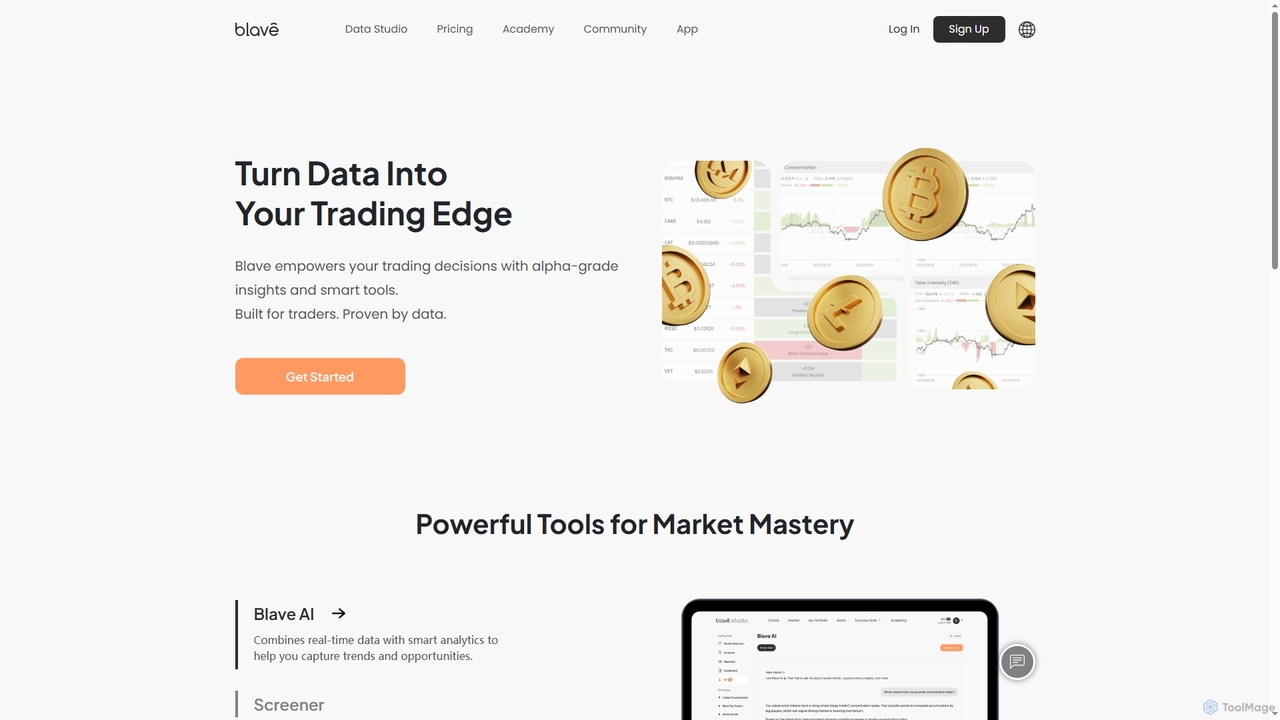
Blaveは、AI駆動の分析、高度なデータスクリーナー、ポートフォリオ管理ツールでトレーダーを支援する暗号資産インサイトスタジオです。リアルタイムの市場データを、初心者からプロのトレーダーまで、実用的な取引上の優位性に変えます。
Compare Biyond and Blave by monthly reach, traffic trend, visit depth, top regions, and acquisition sources.
In the Biyond vs Blave monthly traffic comparison, Biyond currently shows 1.7K visits and Blave shows 19K; Blave has about 11.4 times the visible traffic of Biyond, an absolute difference of about 17.3K visits. This reflects visible reach, not feature quality or paid users.
Both tools provide verified traffic details, so monthly trends, visit depth, regions, and acquisition sources can be compared on the same basis.
| Country/region | Percentage | Traffic |
|---|---|---|
| 🇺🇸United States | 100% | 1.7K |
| Country/region | Percentage | Traffic |
|---|---|---|
| 🇹🇼Taiwan | 94.58% | 18K |
| 🇺🇸United States | 5.34% | 1K |
| 🇨🇦Canada | 0.08% | 15 |
| Source type | Percentage | Traffic |
|---|---|---|
| ダイレクト | 94.75% | 18K |
| Eメール | 4.89% | 929 |
| 参照元 | 0.36% | 68 |
This in-depth Biyond vs Blave comparison uses only the product records, taxonomy, audience, traffic, and community signals available on this page. Biyond is primarily listed under “クリプト”, while Blave is primarily listed under “クリプト”, so the first decision is whether your actual task matches their recorded scope.
The structured fields currently show these decision-relevant differences: Monthly visits (Biyond: 1.7K; Blave: 19K); Monthly growth (Biyond: -24.5%; Blave: 8.1%); Favorites (Biyond: 118; Blave: 109); Website (Biyond: biyond.co; Blave: www.blave.org); Added (Biyond: 2025-08-14; Blave: 2025-11-03). These facts are more useful for selection than brand visibility alone.
In the Biyond vs Blave monthly traffic comparison, Biyond currently shows 1.7K visits and Blave shows 19K; Blave has about 11.4 times the visible traffic of Biyond, an absolute difference of about 17.3K visits. This reflects visible reach, not feature quality or paid users.
Both tools provide verified traffic details, so monthly trends, visit depth, regions, and acquisition sources can be compared on the same basis.
If public market visibility is an important first-pass criterion, investigate Blave first. The final choice should still follow taxonomy, use case, and a real trial because higher traffic does not prove broader capabilities or better workflow fit.
Biyond and Blave currently overlap in shared categories: クリプト、投資、データ分析; shared tags: ブロックチェーン、クリプト、データ分析、取引. This can place both on the same shortlist, but it does not prove equal implementation, depth, or cost.
Biyond's unique categories/tags are AIアナリスト、ビットコイン、イーサリアム、財務分析、投資、市場インテリジェンス、定量分析; Blave's are AI、投資ツール、市場インサイト、ポートフォリオ管理、スクリーナー. These unique fields are the strongest differentiators: validate the product whose recorded scope matches the task instead of following traffic alone.
Biyond has no verified rating, 0 comments, 118 favorites, and 105 likes;Blave has no verified rating, 0 comments, 109 favorites, and 100 likes。
Neither product has enough rating or comment samples for a credible reputation ranking.
Put Biyond on the priority trial list when the task aligns with “クリプト” and especially AIアナリスト、ビットコイン、イーサリアム、財務分析、投資、市場インテリジェンス. This follows recorded positioning and does not imply unlisted capabilities are absent.
Biyond also currently records: pricing is freemium, product type is website, 1.7K verified monthly visits, no verified user rating. Verify any hard requirement around price, platform, or reach before trial, and do not let sparse review data substitute for testing.
Put Blave on the priority trial list when the task aligns with “クリプト” and especially AI、投資ツール、市場インサイト、ポートフォリオ管理、スクリーナー, or the users include 暗号資産トレーダー、データアナリスト、金融アナリスト、投資運用担当者. This follows recorded positioning and does not imply unlisted capabilities are absent.
Blave also currently records: pricing is freemium, product type is website, 19K verified monthly visits, no verified user rating. Verify any hard requirement around price, platform, or reach before trial, and do not let sparse review data substitute for testing.
The available data describes positioning, public visibility, and community signals, but it cannot prove output quality, speed, integration effort, privacy, or long-term cost in your workflow. Before deciding, run the same representative tasks in Biyond and Blave, then record completion time, accuracy, manual corrections, and the real paid threshold. A like-for-like trial turns this comparison into a defensible adoption decision.
newmoney.aiは、現代の投資家向けに設計されたAI搭載の金融インテリジェンスプラットフォームです。リアルタイムの暗号資産市場分析、予測的インサイト、高度なポートフォリオ管理ツールを提供し、ユーザーが変動の激しいデジタル資産の世界を乗りこなし、データに基づいた投資判断を下すのを支援します。
クリプト

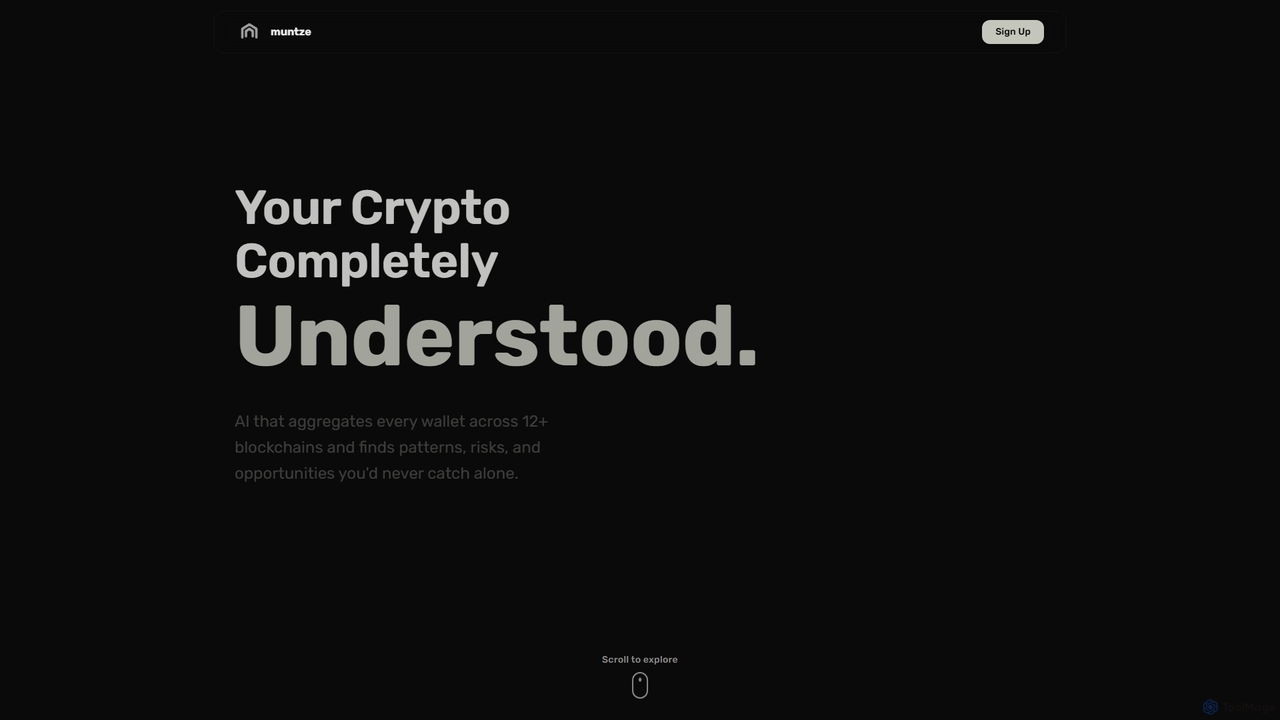
Muntzeは、12以上のブロックチェーンにわたるウォレットを統合するAI搭載の暗号通貨ポートフォリオインテリジェンスプラットフォームです。統合された洞察を提供し、パターン、リスク、機会を特定し、将来の自律取引のための自然言語戦略定義を可能にします。
Portfolio Analysis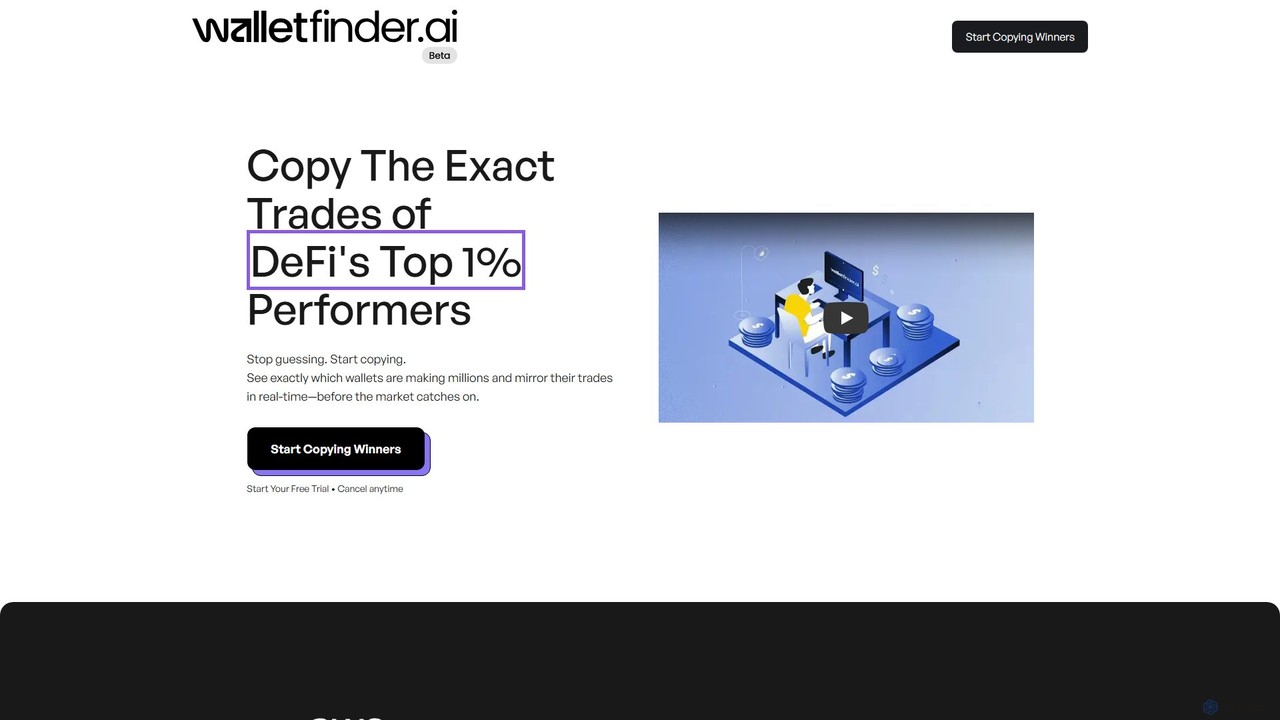
Wallet Finder.aiは、仮想通貨トレーダーが収益性の高いブロックチェーンウォレットを発見・分析するのを支援するDeFi分析プラットフォームです。イーサリアムやソラナなどのチェーンからデータを集約し、高度なフィルタリング、詳細なパフォーマンス統計(PNL)、過去の洞察を提供します。ユーザーはトップトレーダーを追跡し、成功戦略を特定し、リアルタイムのアラートを受け取ることで、より賢明でデータに基づいた取引決定を下すことができます。
クリプト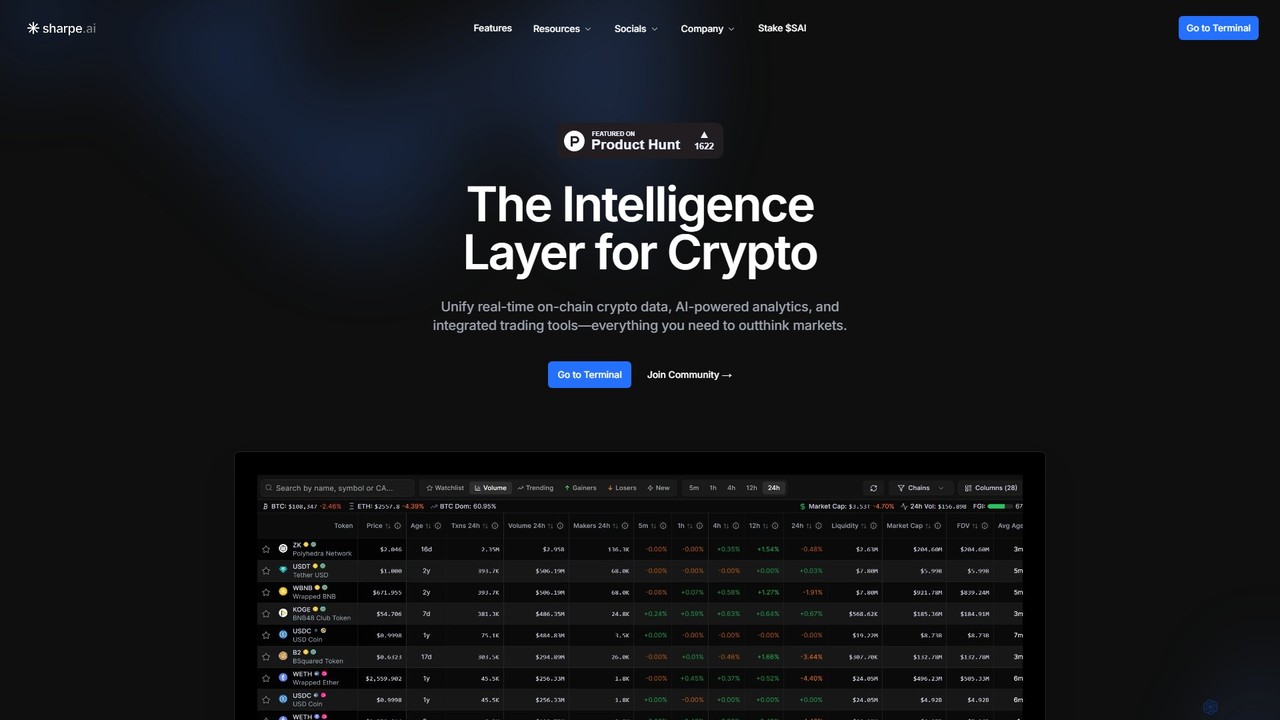
Sharpe AIは、オールインワンの暗号資産インテリジェンスおよび取引プラットフォームです。リアルタイムのオンチェーンおよびオフチェーンデータ、AIによる分析、シームレスな取引執行を単一のターミナルに統合します。個人トレーダーと機関投資家の両方向けに設計されており、市場トレンドの分析、機会の発見、迅速かつ正確な取引の実行に必要なツールを提供します。
市場インテリジェンス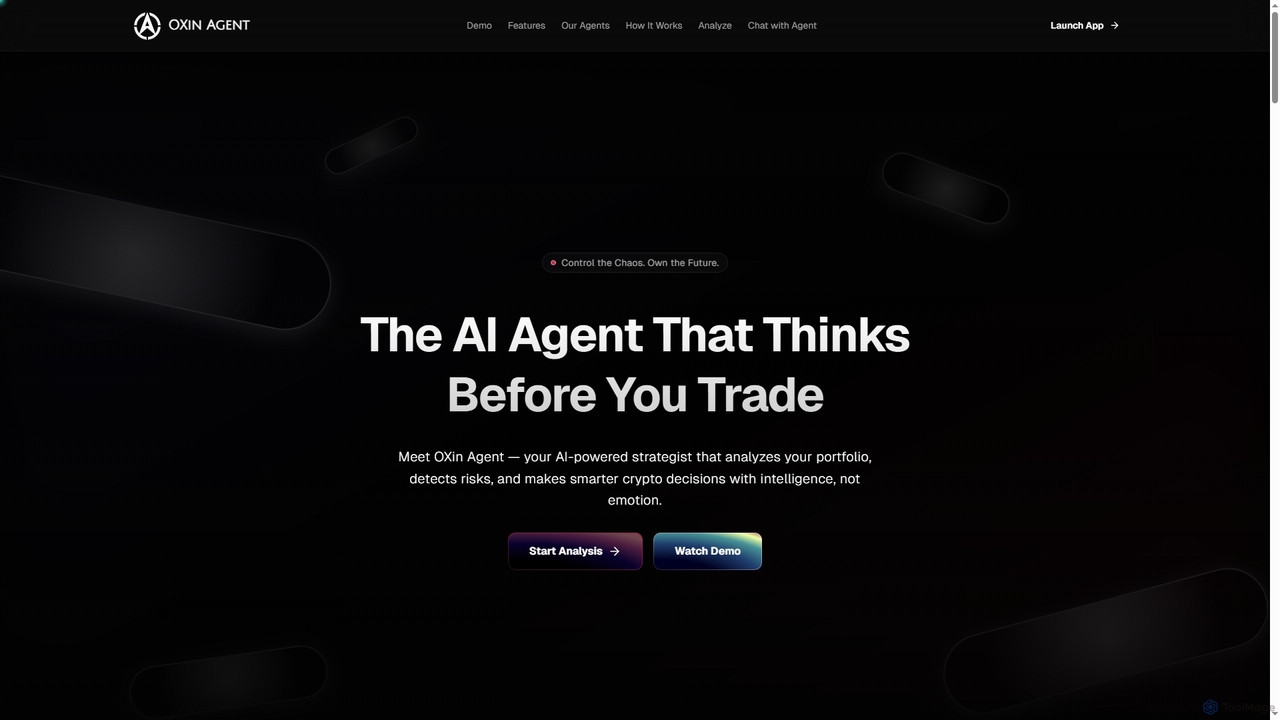
OXin Agentは、暗号通貨投資家がポートフォリオを管理・最適化するために設計されたAI搭載のストラテジストです。リアルタイムデータと高度なAIモデルを活用し、保有資産を分析し、リスクを検出し、感情に左右されないインテリジェントな取引推奨を提供することで、意思決定能力を向上させます。
財務分析
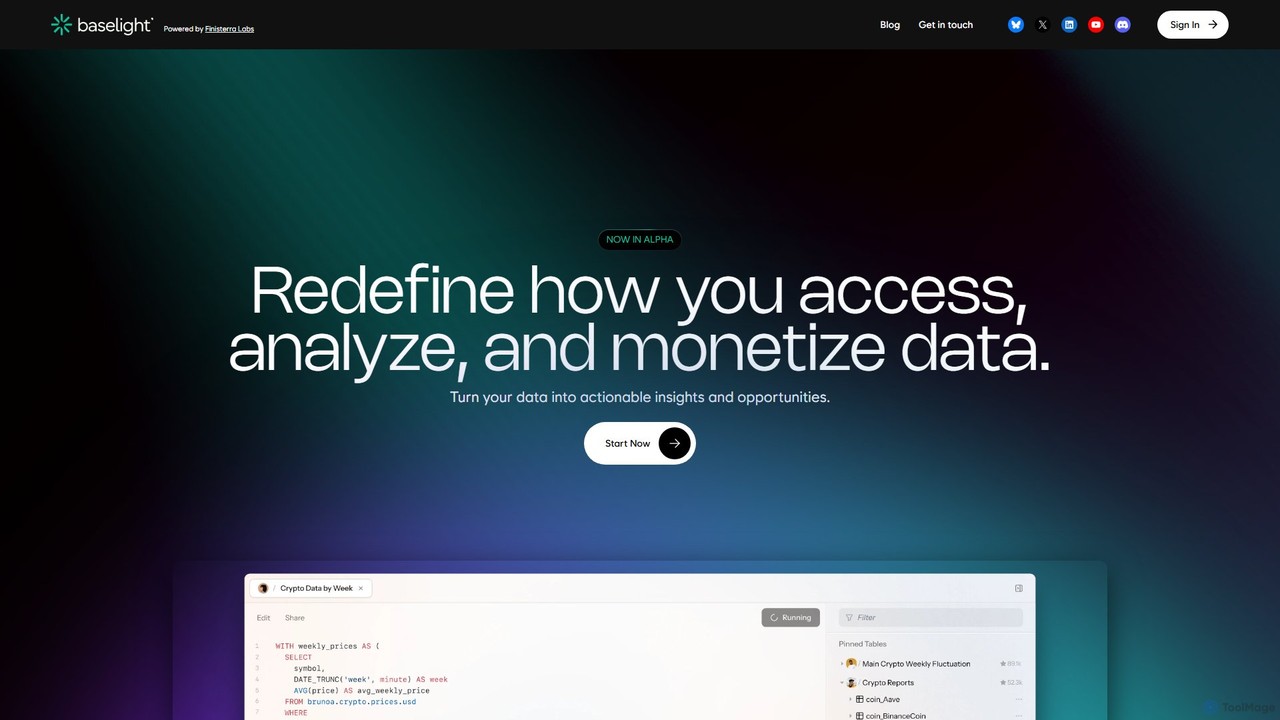
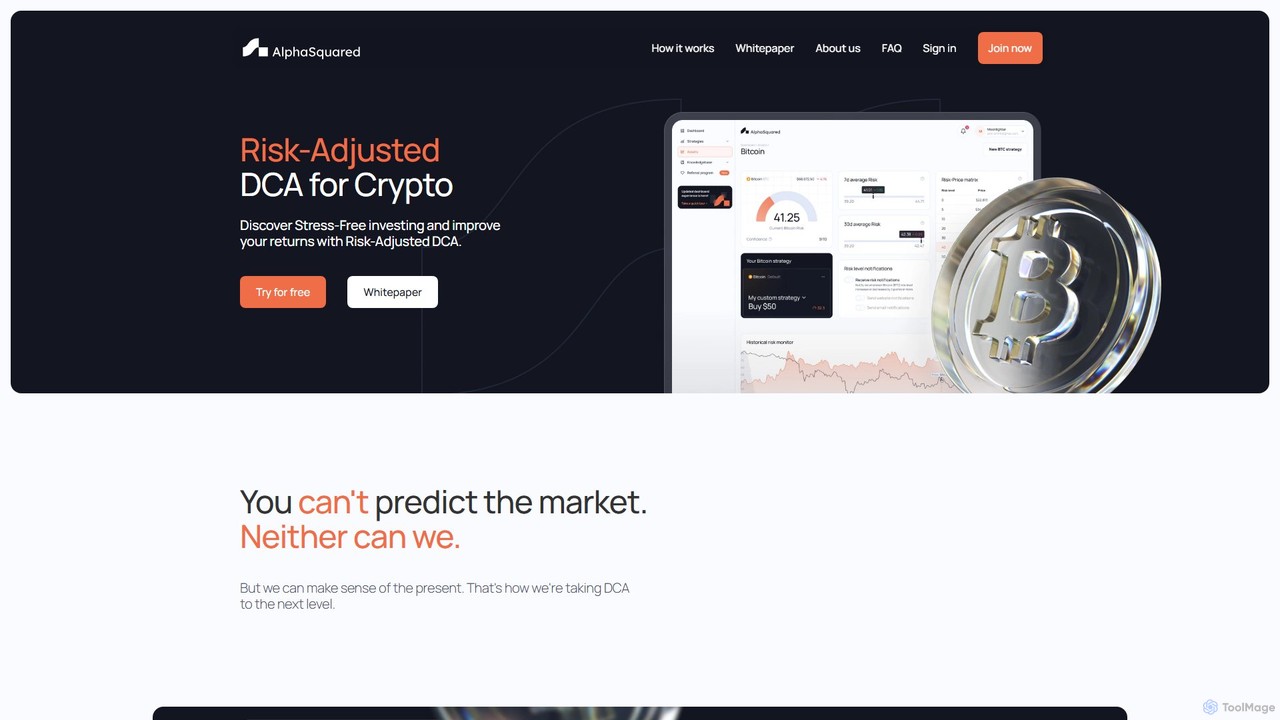
alphasquaredは、ビットコインやイーサリアムなどの暗号資産に独自のAIリスク指標を提供するプラットフォームです。リアルタイムの市場リスクに基づいて投資額を調整することで、投資家がドルコスト平均法(DCA)戦略を最適化し、ストレスフリーでデータに基づいた意思決定を行い、リターンを向上させ、ポートフォリオを効果的に管理するのを支援します。
分析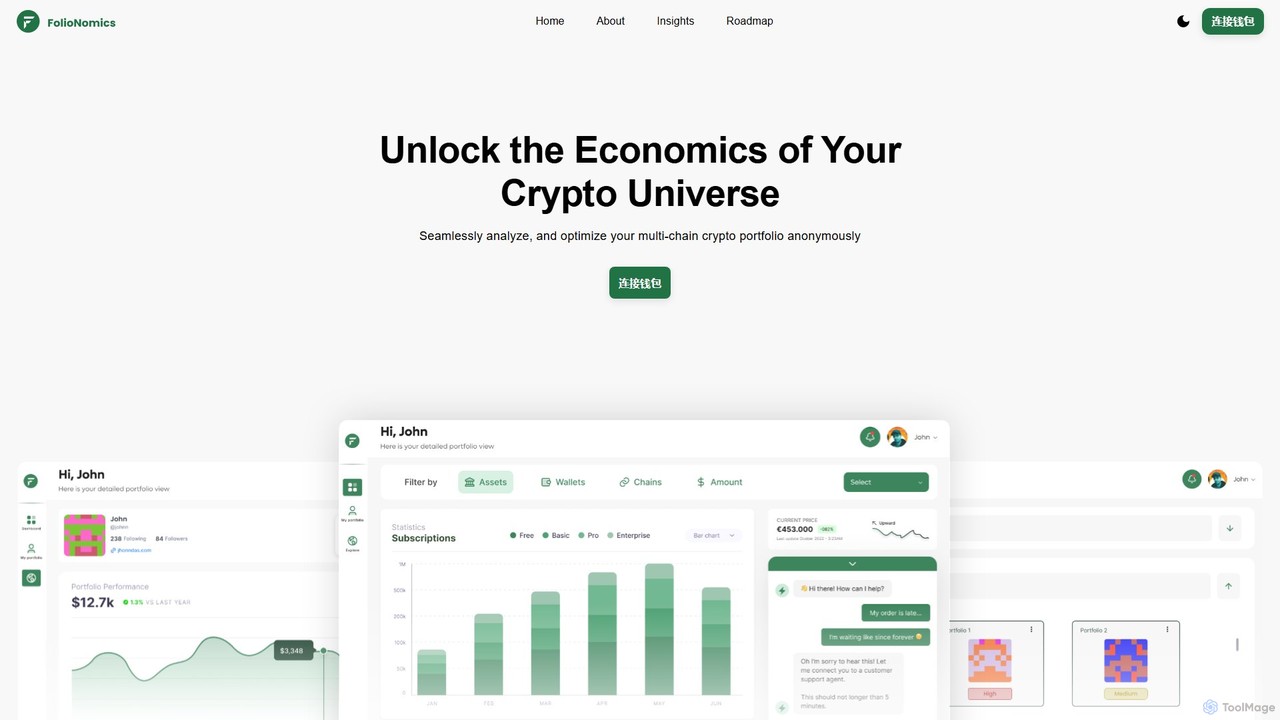
FolionomicsはAIを活用した暗号資産ポートフォリオ管理プラットフォームです。ユーザーは50以上のブロックチェーンにまたがるマルチチェーンの暗号資産を匿名で分析、管理、最適化でき、AIチャットボットを通じてパーソナライズされた洞察やリスク管理の推奨を得られます。
投資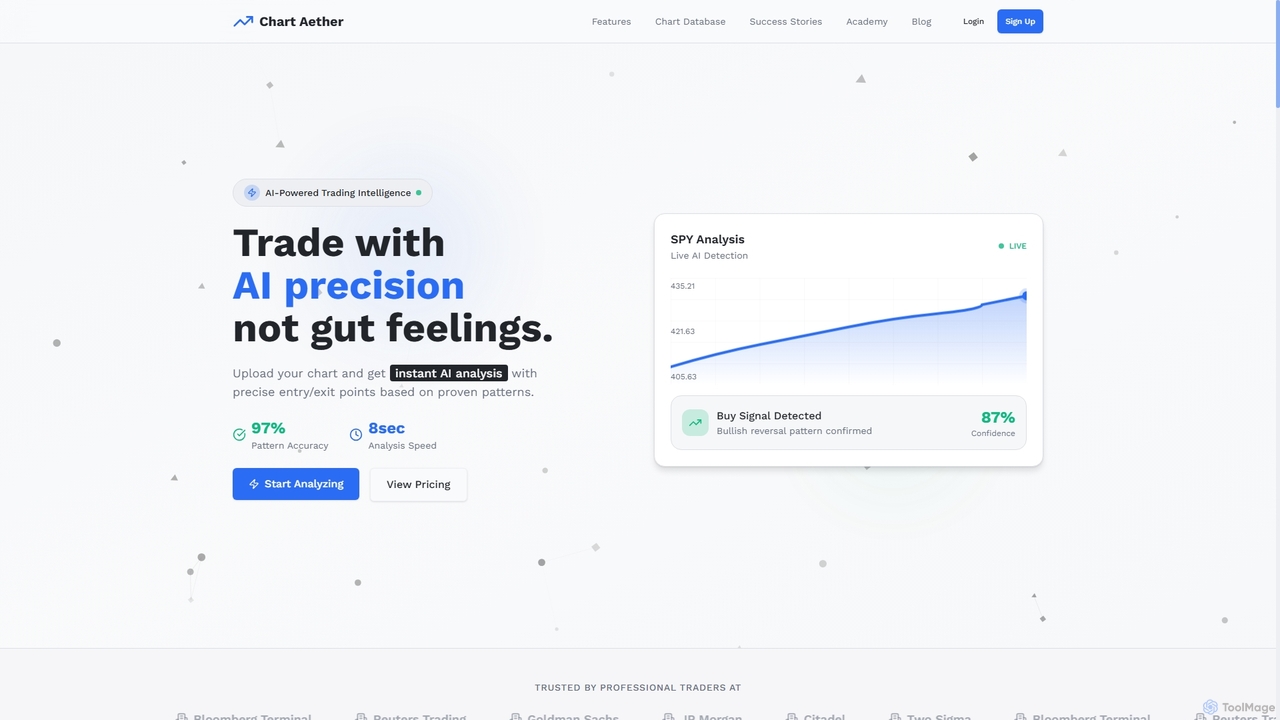
Chart Aetherは、AIを活用したトレーディングインテリジェンスプラットフォームで、トレーディングチャートの即時かつ正確な分析を提供します。任意のチャートスクリーンショットをアップロードするだけで、50以上の実績あるチャートパターンに基づき、最大97%の精度で、エントリー/エグジットポイント、ストップロスレベル、利益目標を含むAI生成のトレードプランを受け取ることができます。複数の資産と時間枠をサポートし、トレーダーがデータに基づいた意思決定を行えるように支援します。
市場分析