ChartAI
視覚化 · 29.5K 月間訪問数
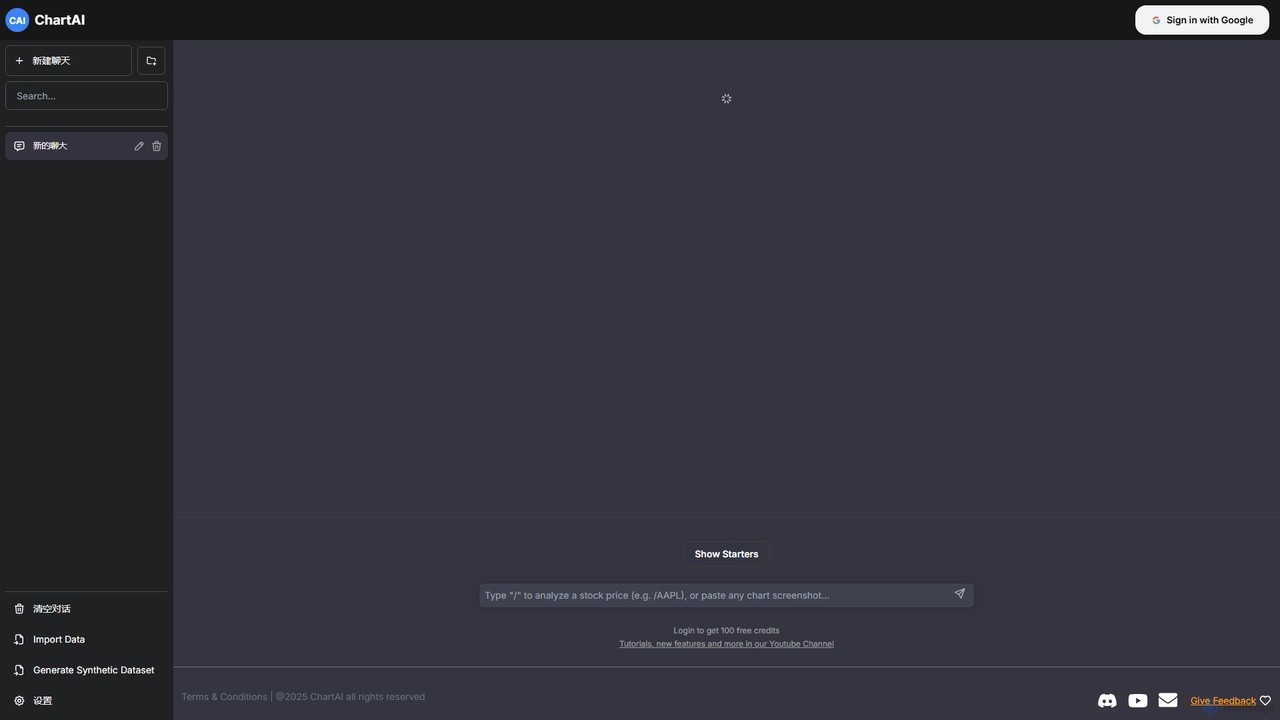
ChartAIは、自然言語のプロンプトを見事なチャートやグラフに変換するAI搭載のデータ可視化ツールです。独自のデータをインポートするか、合成データセットを生成し、AIとチャットするだけで情報を分析し、即座に可視化を作成できます。コーディングなしで迅速にデータを理解し提示する必要があるアナリストや研究者に最適です。
ChartAIは、自然言語のプロンプトを見事なチャートやグラフに変換するAI搭載のデータ可視化ツールです。独自のデータをインポートするか、合成データセットを生成し、AIとチャットするだけで情報を分析し、即座に可視化を作成できます。コーディングなしで迅速にデータを理解し提示する必要があるアナリストや研究者に最適です。
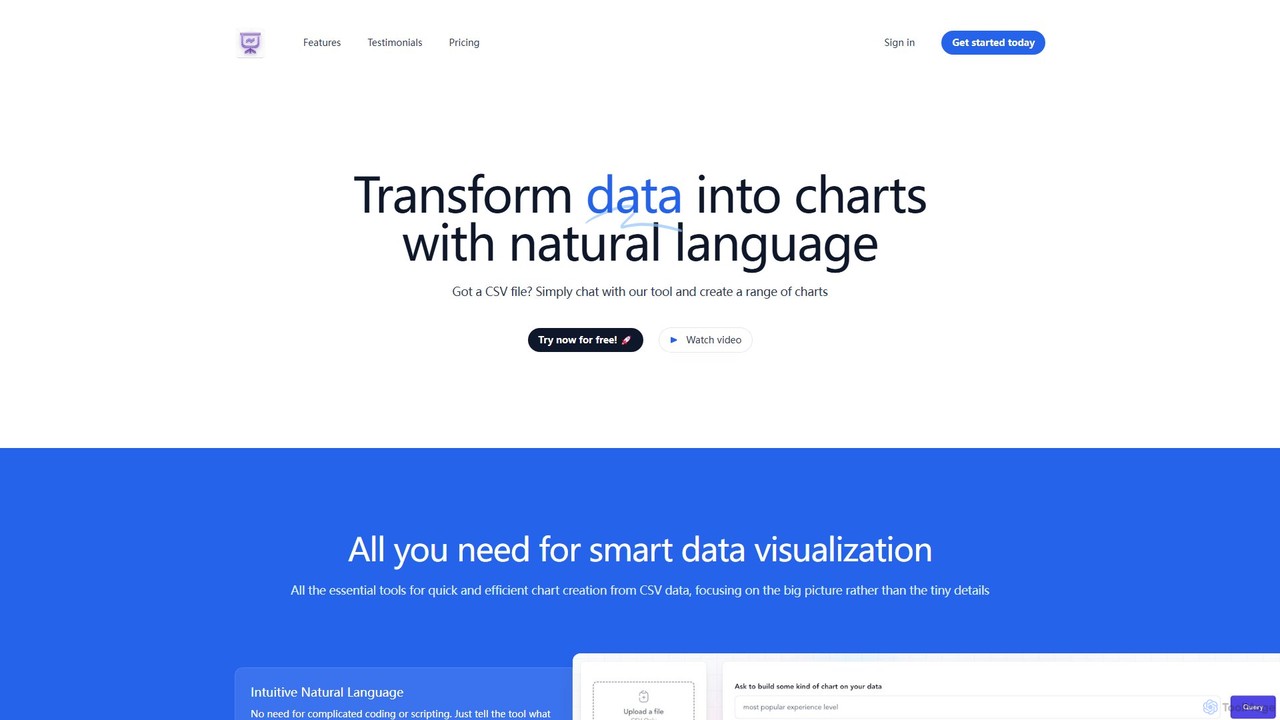
chat2csvは、簡単な自然言語コマンドを使用してCSVファイルを様々なチャートに変換するAI搭載のデータ可視化ツールです。コーディングは不要で、データをアップロードし、AIとチャットするだけで、棒グラフ、円グラフ、折れ線グラフなどを即座に生成できます。ユーザーデータのプライバシーを優先しながら、迅速で直感的な分析を実現するために設計されています。
ChartAIは、自然言語のプロンプトを見事なチャートやグラフに変換するAI搭載のデータ可視化ツールです。独自のデータをインポートするか、合成データセットを生成し、AIとチャットするだけで情報を分析し、即座に可視化を作成できます。コーディングなしで迅速にデータを理解し提示する必要があるアナリストや研究者に最適です。
chat2csvは、簡単な自然言語コマンドを使用してCSVファイルを様々なチャートに変換するAI搭載のデータ可視化ツールです。コーディングは不要で、データをアップロードし、AIとチャットするだけで、棒グラフ、円グラフ、折れ線グラフなどを即座に生成できます。ユーザーデータのプライバシーを優先しながら、迅速で直感的な分析を実現するために設計されています。
| Feature | ChartAI | chat2csv |
|---|---|---|
| 主要カテゴリー | 視覚化 | ビジネスインテリジェンス |
| 追加日 | 2025-08-09 | 2025-08-15 |
| 価格 | フリーミアム | フリーミアム |
| 公式サイト | chartai.io | chat2csv.com |
| 製品タイプ | ウェブサイト | ウェブサイト |
| Performance data | ||
| ユーザー評価 | 未確認 | 未確認 |
| コメント | 0 | 0 |
| 月間訪問数 | 29.5K | 358 |
| 月間成長率 | 7.1% | -78.5% |
| お気に入り | 137 | 98 |
| Details | 詳細を見る | 詳細を見る |
Compare ChartAI and chat2csv by monthly reach, traffic trend, visit depth, top regions, and acquisition sources.
In the ChartAI vs chat2csv monthly traffic comparison, ChartAI currently shows 29.5K visits and chat2csv shows 358; ChartAI has about 82.4 times the visible traffic of chat2csv, an absolute difference of about 29.1K visits. This reflects visible reach, not feature quality or paid users.
Both tools provide verified traffic details, so monthly trends, visit depth, regions, and acquisition sources can be compared on the same basis.
ChartAI is registered at the chartai.io/zh subpage. Because the current data does not state whether other host pages are excluded, treat this as domain-level context rather than independent traffic for one product or project.
| Country/region | Percentage | Traffic |
|---|---|---|
| 🇺🇸United States | 31.98% | 9.4K |
| 🇮🇳India | 26.97% | 8K |
| 🇹🇷Turkey | 20.25% | 6K |
| 🇧🇷Brazil | 10.79% | 3.2K |
| 🇷🇴Romania | 10.01% | 3K |
| Source type | Percentage | Traffic |
|---|---|---|
| 参照元 | 84.7% | 25K |
| ダイレクト | 14.82% | 4.4K |
| Eメール | 0.48% | 142 |
| Country/region | Percentage | Traffic |
|---|---|---|
| 🇺🇸United States | 100% | 358 |
This in-depth ChartAI vs chat2csv comparison uses only the product records, taxonomy, audience, traffic, and community signals available on this page. ChartAI is primarily listed under “視覚化”, while chat2csv is primarily listed under “ビジネスインテリジェンス”, so the first decision is whether your actual task matches their recorded scope.
The structured fields currently show these decision-relevant differences: Primary category (ChartAI: 視覚化; chat2csv: ビジネスインテリジェンス); Monthly visits (ChartAI: 29.5K; chat2csv: 358); Monthly growth (ChartAI: 7.1%; chat2csv: -78.5%); Favorites (ChartAI: 137; chat2csv: 98); Website (ChartAI: chartai.io; chat2csv: chat2csv.com). These facts are more useful for selection than brand visibility alone.
In the ChartAI vs chat2csv monthly traffic comparison, ChartAI currently shows 29.5K visits and chat2csv shows 358; ChartAI has about 82.4 times the visible traffic of chat2csv, an absolute difference of about 29.1K visits. This reflects visible reach, not feature quality or paid users.
Both tools provide verified traffic details, so monthly trends, visit depth, regions, and acquisition sources can be compared on the same basis.
ChartAI is registered at the chartai.io/zh subpage. Because the current data does not state whether other host pages are excluded, treat this as domain-level context rather than independent traffic for one product or project.
ChartAI is registered under a chartai.io subpath, so its large visible total may include the host platform. The current data does not justify choosing ChartAI for traffic alone; shortlist by unique taxonomy and use case, then validate with the same tasks.
ChartAI and chat2csv currently overlap in shared categories: 視覚化; shared tags: AIチャート、ビジネスインテリジェンス、チャートジェネレーター、データ分析、データ視覚化、自然言語処理. This can place both on the same shortlist, but it does not prove equal implementation, depth, or cost.
ChartAI's unique categories/tags are コード生成、分析、CSVをチャートに、レポート生成、合成データ; chat2csv's are ビジネスインテリジェンス、ビルダー、データ分析、CSV、NLP、ノーコード、レポートジェネレーター. These unique fields are the strongest differentiators: validate the product whose recorded scope matches the task instead of following traffic alone.
ChartAI has no verified rating, 0 comments, 137 favorites, and 126 likes;chat2csv has no verified rating, 0 comments, 98 favorites, and 102 likes。
Neither product has enough rating or comment samples for a credible reputation ranking.
Put ChartAI on the priority trial list when the task aligns with “視覚化” and especially コード生成、分析、CSVをチャートに、レポート生成、合成データ. This follows recorded positioning and does not imply unlisted capabilities are absent.
ChartAI also currently records: pricing is freemium, product type is website, 29.5K monthly visits shown for the registered host (subpage scope unknown), no verified user rating. Verify any hard requirement around price, platform, or reach before trial, and do not let sparse review data substitute for testing.
Put chat2csv on the priority trial list when the task aligns with “ビジネスインテリジェンス” and especially ビジネスインテリジェンス、ビルダー、データ分析、CSV、NLP、ノーコード. This follows recorded positioning and does not imply unlisted capabilities are absent.
chat2csv also currently records: pricing is freemium, product type is website, 358 verified monthly visits, no verified user rating. Verify any hard requirement around price, platform, or reach before trial, and do not let sparse review data substitute for testing.
The available data describes positioning, public visibility, and community signals, but it cannot prove output quality, speed, integration effort, privacy, or long-term cost in your workflow. Before deciding, run the same representative tasks in ChartAI and chat2csv, then record completion time, accuracy, manual corrections, and the real paid threshold. A like-for-like trial turns this comparison into a defensible adoption decision.