ChartAI
視覚化 · 29.5K 月間訪問数
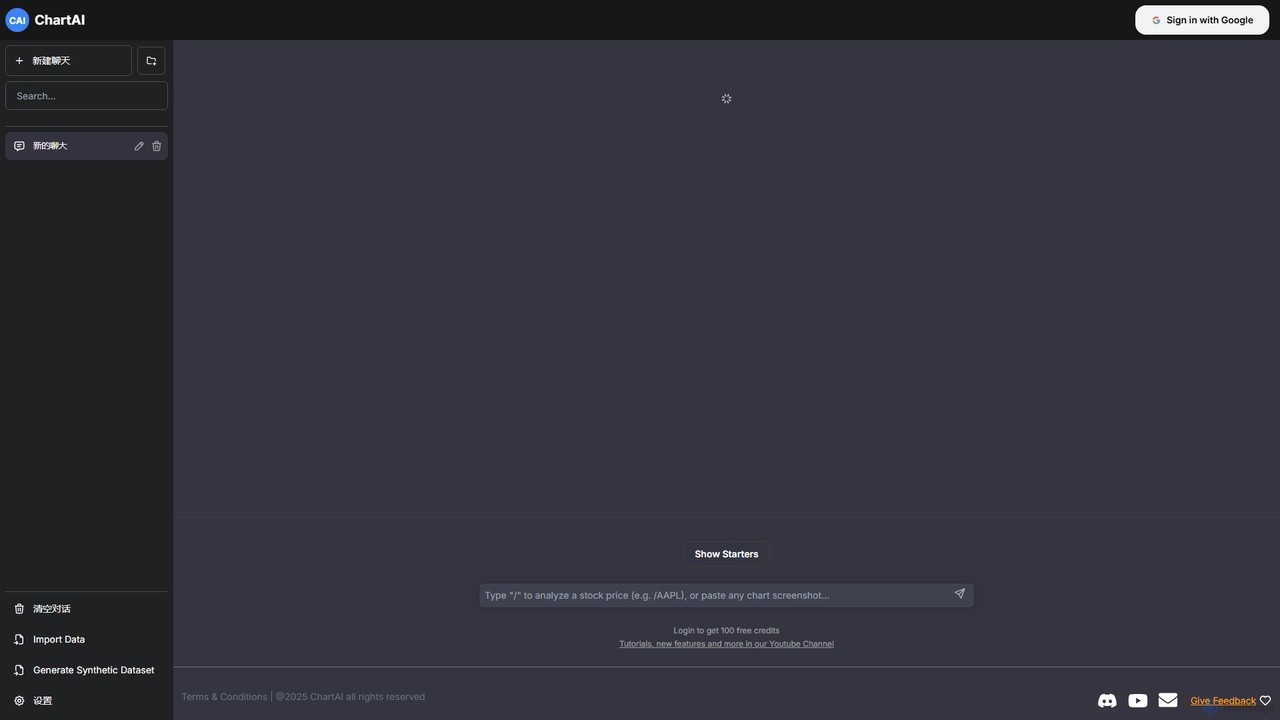
ChartAIは、自然言語のプロンプトを見事なチャートやグラフに変換するAI搭載のデータ可視化ツールです。独自のデータをインポートするか、合成データセットを生成し、AIとチャットするだけで情報を分析し、即座に可視化を作成できます。コーディングなしで迅速にデータを理解し提示する必要があるアナリストや研究者に最適です。
ChartAIは、自然言語のプロンプトを見事なチャートやグラフに変換するAI搭載のデータ可視化ツールです。独自のデータをインポートするか、合成データセットを生成し、AIとチャットするだけで情報を分析し、即座に可視化を作成できます。コーディングなしで迅速にデータを理解し提示する必要があるアナリストや研究者に最適です。
workviz.ioは、AIを活用したワークフォース分析およびプロジェクト可視化プラットフォームです。複雑な業務データを明確でインタラクティブなダッシュボードに変換し、インテリジェントな洞察と予測分析を通じて、チームのワークフロー最適化、プロジェクト進捗の監視、生産性向上を支援します。
ChartAIは、自然言語のプロンプトを見事なチャートやグラフに変換するAI搭載のデータ可視化ツールです。独自のデータをインポートするか、合成データセットを生成し、AIとチャットするだけで情報を分析し、即座に可視化を作成できます。コーディングなしで迅速にデータを理解し提示する必要があるアナリストや研究者に最適です。
workviz.ioは、AIを活用したワークフォース分析およびプロジェクト可視化プラットフォームです。複雑な業務データを明確でインタラクティブなダッシュボードに変換し、インテリジェントな洞察と予測分析を通じて、チームのワークフロー最適化、プロジェクト進捗の監視、生産性向上を支援します。
| Feature | ChartAI | workviz.io |
|---|---|---|
| 主要カテゴリー | 視覚化 | プロジェクト管理 |
| 追加日 | 2025-08-09 | 2025-08-13 |
| 価格 | フリーミアム | フリーミアム |
| 公式サイト | chartai.io | ww25.workviz.io |
| 製品タイプ | ウェブサイト | ウェブサイト |
| Performance data | ||
| ユーザー評価 | 未確認 | 未確認 |
| コメント | 0 | 0 |
| 月間訪問数 | 29.5K | 4.4K |
| 月間成長率 | 7.1% | 未確認 |
| お気に入り | 147 | 129 |
| Details | 詳細を見る | 詳細を見る |
Compare ChartAI and workviz.io by monthly reach, traffic trend, visit depth, top regions, and acquisition sources.
In the ChartAI vs workviz.io monthly traffic comparison, ChartAI currently shows 29.5K visits and workviz.io shows 4.4K; ChartAI has about 6.8 times the visible traffic of workviz.io, an absolute difference of about 25.1K visits. This reflects visible reach, not feature quality or paid users.
Only ChartAI has complete third-party traffic details; workviz.io uses visits recorded inside ToolMage. These scopes cannot estimate market share directly, and on-site views should not be treated as the product’s total website traffic.
ChartAI is registered at the chartai.io/zh subpage. Because the current data does not state whether other host pages are excluded, treat this as domain-level context rather than independent traffic for one product or project.
| Country/region | Percentage | Traffic |
|---|---|---|
| 🇺🇸United States | 31.98% | 9.4K |
| 🇮🇳India | 26.97% | 8K |
| 🇹🇷Turkey | 20.25% | 6K |
| 🇧🇷Brazil | 10.79% | 3.2K |
| 🇷🇴Romania | 10.01% | 3K |
| Source type | Percentage | Traffic |
|---|---|---|
| 参照元 | 84.7% | 25K |
| ダイレクト | 14.82% | 4.4K |
| Eメール | 0.48% | 142 |
This in-depth ChartAI vs workviz.io comparison uses only the product records, taxonomy, audience, traffic, and community signals available on this page. ChartAI is primarily listed under “視覚化”, while workviz.io is primarily listed under “プロジェクト管理”, so the first decision is whether your actual task matches their recorded scope.
The structured fields currently show these decision-relevant differences: Primary category (ChartAI: 視覚化; workviz.io: プロジェクト管理); Monthly visits (ChartAI: 29.5K; workviz.io: 4.4K); Favorites (ChartAI: 147; workviz.io: 129); Website (ChartAI: chartai.io; workviz.io: ww25.workviz.io); Added (ChartAI: 2025-08-09; workviz.io: 2025-08-13). These facts are more useful for selection than brand visibility alone.
In the ChartAI vs workviz.io monthly traffic comparison, ChartAI currently shows 29.5K visits and workviz.io shows 4.4K; ChartAI has about 6.8 times the visible traffic of workviz.io, an absolute difference of about 25.1K visits. This reflects visible reach, not feature quality or paid users.
Only ChartAI has complete third-party traffic details; workviz.io uses visits recorded inside ToolMage. These scopes cannot estimate market share directly, and on-site views should not be treated as the product’s total website traffic.
ChartAI is registered at the chartai.io/zh subpage. Because the current data does not state whether other host pages are excluded, treat this as domain-level context rather than independent traffic for one product or project.
ChartAI is registered under a chartai.io subpath, so its large visible total may include the host platform. The current data does not justify choosing ChartAI for traffic alone; shortlist by unique taxonomy and use case, then validate with the same tasks.
ChartAI and workviz.io currently overlap in shared categories: 視覚化、分析; shared tags: ビジネスインテリジェンス、データ視覚化. This can place both on the same shortlist, but it does not prove equal implementation, depth, or cost.
ChartAI's unique categories/tags are コード生成、AIチャート、チャートジェネレーター、CSVをチャートに、データ分析、自然言語処理、レポート生成、合成データ; workviz.io's are プロジェクト管理、ダッシュボード、予測分析、生産性、レポート、ワークフロー最適化、人材分析. These unique fields are the strongest differentiators: validate the product whose recorded scope matches the task instead of following traffic alone.
ChartAI has no verified rating, 0 comments, 147 favorites, and 132 likes;workviz.io has no verified rating, 0 comments, 129 favorites, and 113 likes。
Neither product has enough rating or comment samples for a credible reputation ranking.
Put ChartAI on the priority trial list when the task aligns with “視覚化” and especially コード生成、AIチャート、チャートジェネレーター、CSVをチャートに、データ分析、自然言語処理. This follows recorded positioning and does not imply unlisted capabilities are absent.
ChartAI also currently records: pricing is freemium, product type is website, 29.5K monthly visits shown for the registered host (subpage scope unknown), no verified user rating. Verify any hard requirement around price, platform, or reach before trial, and do not let sparse review data substitute for testing.
Put workviz.io on the priority trial list when the task aligns with “プロジェクト管理” and especially プロジェクト管理、ダッシュボード、予測分析、生産性、レポート、ワークフロー最適化. This follows recorded positioning and does not imply unlisted capabilities are absent.
workviz.io also currently records: pricing is freemium, product type is website, 4.4K on-site monthly views, no verified user rating. Verify any hard requirement around price, platform, or reach before trial, and do not let sparse review data substitute for testing.
The available data describes positioning, public visibility, and community signals, but it cannot prove output quality, speed, integration effort, privacy, or long-term cost in your workflow. Before deciding, run the same representative tasks in ChartAI and workviz.io, then record completion time, accuracy, manual corrections, and the real paid threshold. A like-for-like trial turns this comparison into a defensible adoption decision.
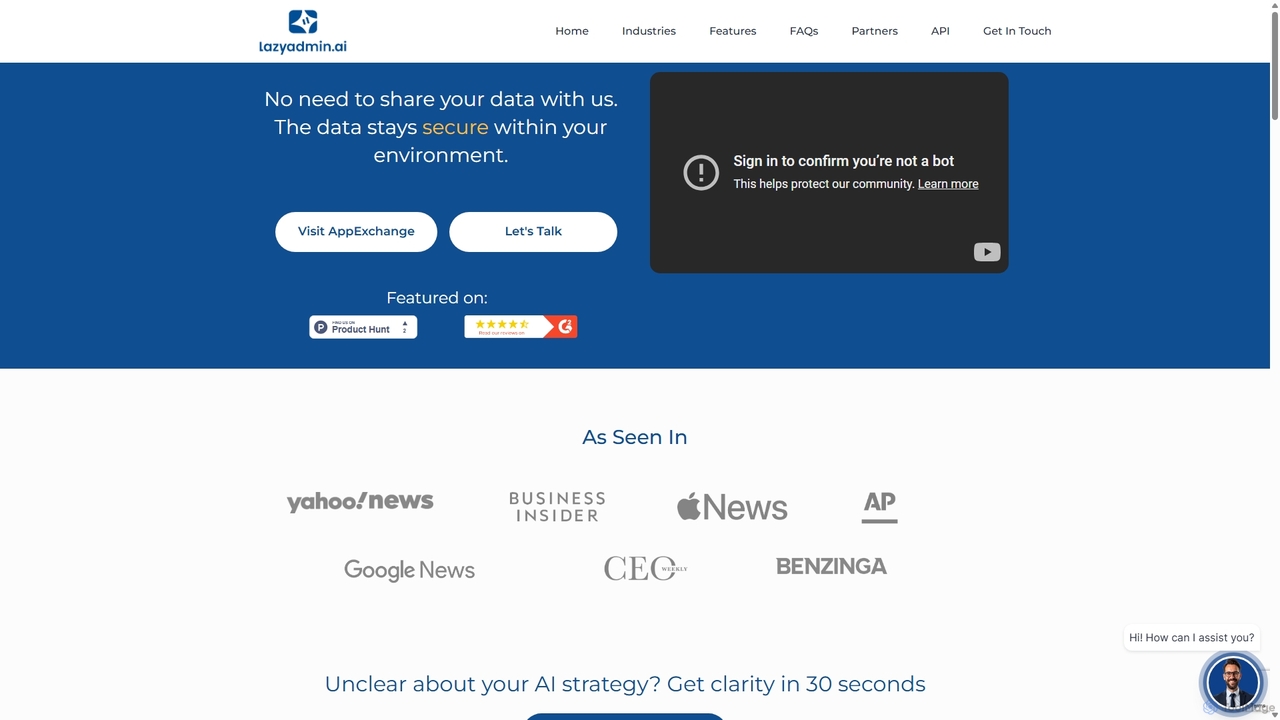
Lazy Adminは、主にSalesforce向けに設計されたAI搭載のデータ分析およびレポートソリューションです。自然言語を使用してデータをクエリし、チャートを生成し、ダッシュボードを作成できます。このツールは、すべてのデータを環境内に保持することでセキュリティを重視し、特定のビジネス用語を理解するようにパーソナライズできるため、チームの誰もがデータインサイトに簡単にアクセスできます。
ビジネスインテリジェンス
Othor AIは、ノーコードのビジネスインテリジェンスプラットフォームで、データを数秒で実用的なインサイトに変換します。物語形式のレポート、スマートチャート、予測分析を自動生成し、組織の誰もが技術的な専門知識なしで、より迅速にデータに基づいた意思決定を行えるようにします。データソースを接続するだけで、即座にダッシュボードとエグゼクティブサマリーを入手できます。
ビジネスインテリジェンス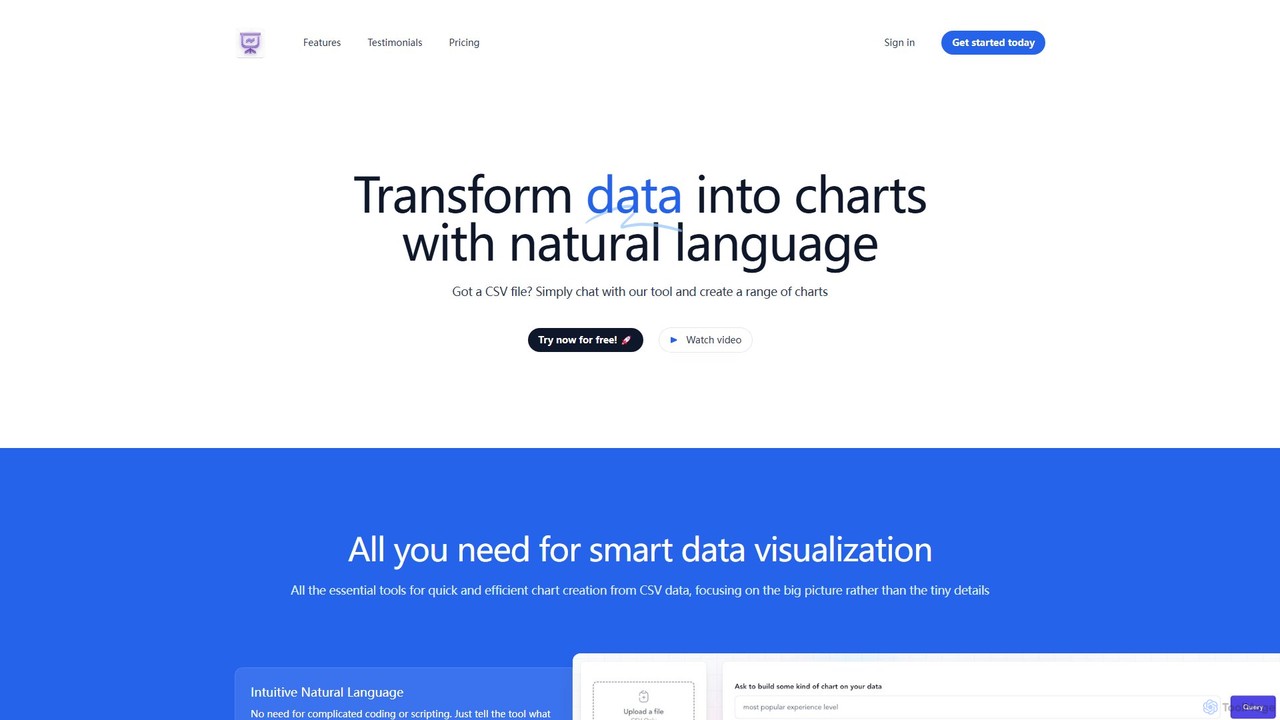
chat2csvは、簡単な自然言語コマンドを使用してCSVファイルを様々なチャートに変換するAI搭載のデータ可視化ツールです。コーディングは不要で、データをアップロードし、AIとチャットするだけで、棒グラフ、円グラフ、折れ線グラフなどを即座に生成できます。ユーザーデータのプライバシーを優先しながら、迅速で直感的な分析を実現するために設計されています。
ビジネスインテリジェンス
ChatExcelは、簡単なチャットインターフェースを通じてスプレッドシートの処理やデータ分析を可能にするAI搭載のデータ分析ツールです。データクレンジング、マージ、分析などのタスクを自動化し、自然言語のコマンドから100種類以上のチャートやビジュアライゼーションを生成します。コーディングや複雑な数式は不要で、生産性を最大90%向上させます。
ビジネスインテリジェンス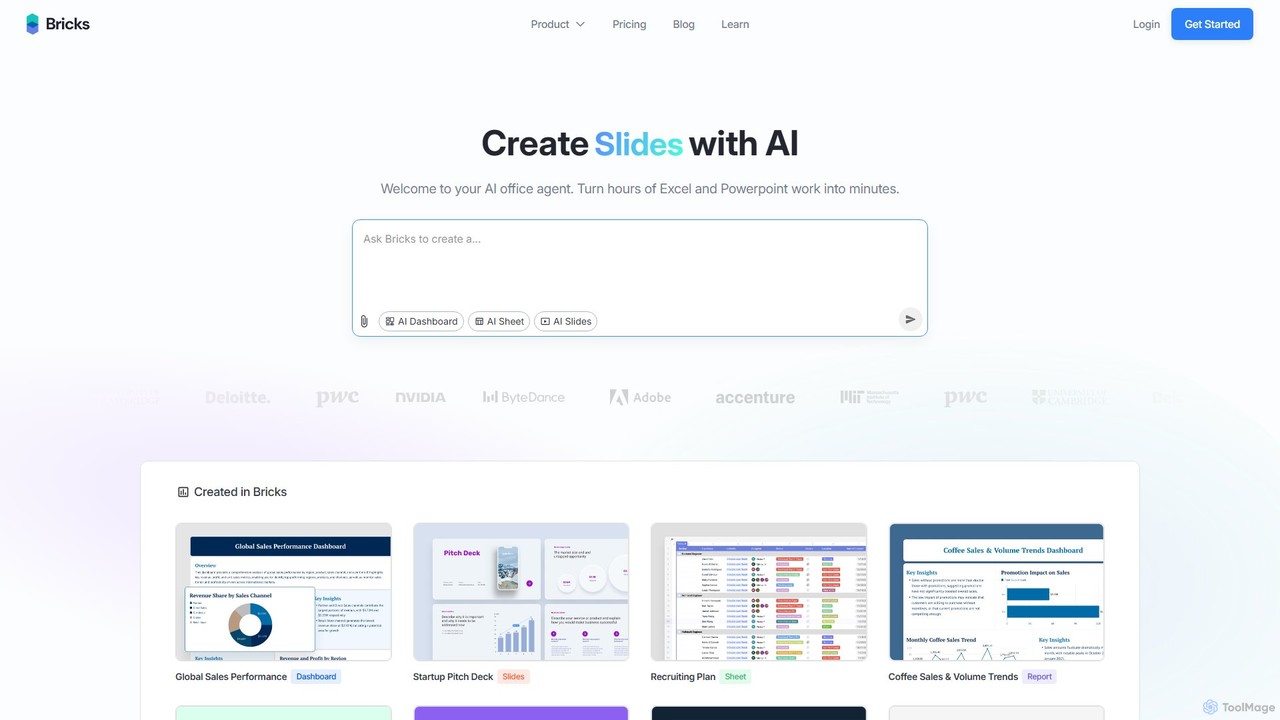
thebricksは、データ分析とレポート作成を変革するAI搭載のワークスペースです。ユーザーは簡単な自然言語のプロンプトを使用して、インタラクティブなダッシュボード、動的なスプレッドシート、プロフェッショナルなスライドを作成できます。ExcelやPowerPointでの数時間にわたる手作業を数分に短縮し、ワークフローを合理化して生産性を向上させます。
ビジネスインテリジェンス
Crackerjackは、AIを搭載したビジネスインテリジェンスおよびデータ分析プラットフォームです。複雑なデータからインサイトを自動的に発見し、専門家レベルのレポートを生成し、予測分析を提供することで、あらゆる規模の企業の戦略的意思決定を加速させます。
ビジネスインテリジェンス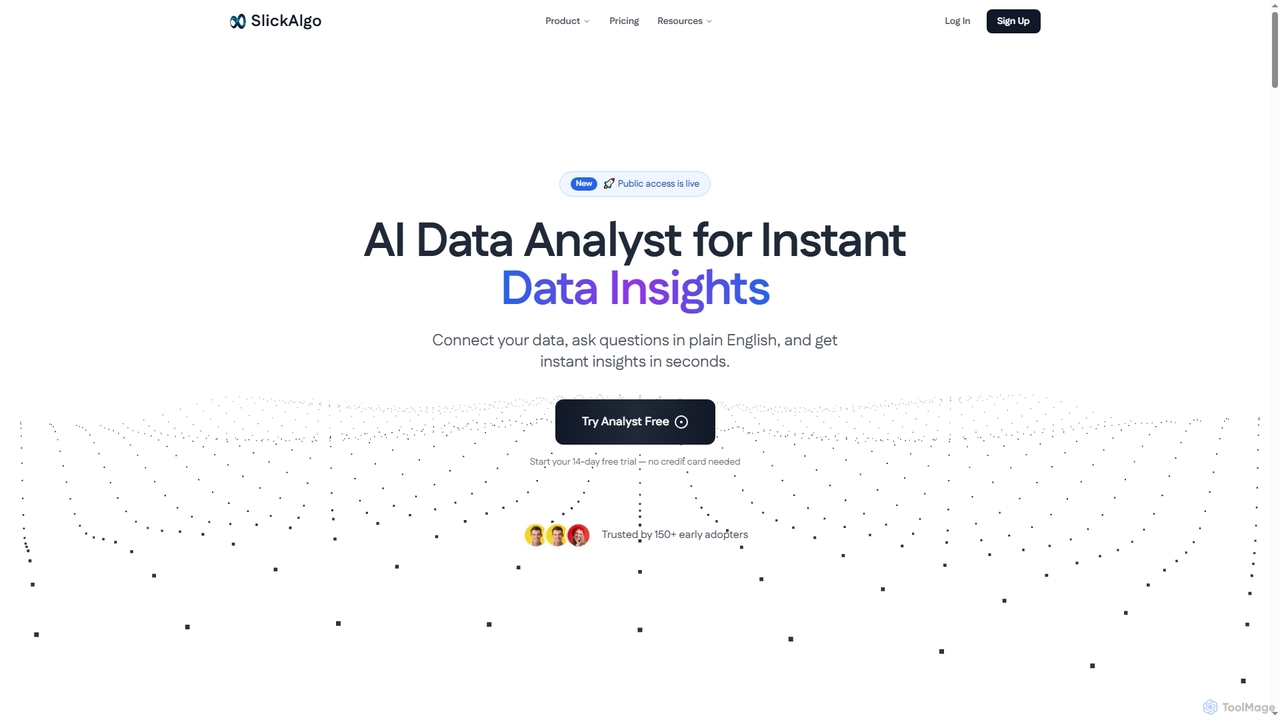
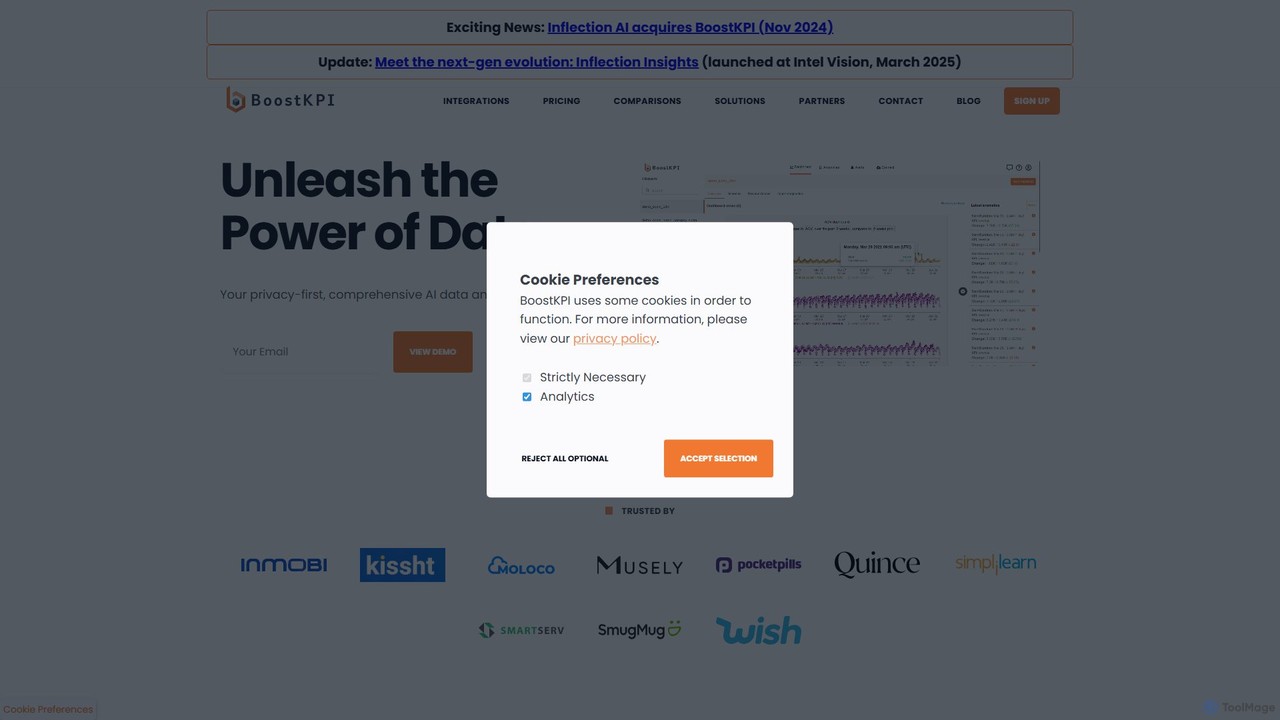
BoostKPIは、AIアシスタントADAを搭載したプライバシーファーストのAIデータ分析プラットフォームです。異常検知、根本原因分析、データ可視化を自動化し、企業がデータから実用的なインサイトを迅速に発見できるよう支援します。様々なデータウェアハウスに接続したり、ファイルをアップロードしたりすることで、BoostKPIは複雑なデータセットを明確なレポート、ヒートマップ、ドリルダウン分析に変換し、あらゆる規模のチームがより迅速かつ容易にデータ駆動型の意思決定を行えるようにします。
ビジネスインテリジェンス
Prisms.aiは、複雑なデータを明確でインタラクティブなダッシュボードに変換するAI搭載のデータ分析・可視化プラットフォームです。自然言語で質問するだけで、AIが生成したインサイト、チャート、レポートを即座に受け取ることができ、組織の誰もがデータに基づいた意思決定を行えるようになります。
ビジネスインテリジェンス
insyteは、複雑なデータを明確で実行可能なインサイトに変換するAI搭載のビジネスインテリジェンスプラットフォームです。データサイエンティストを必要とせず、自然言語で質問し、インタラクティブなダッシュボードを作成し、隠れたトレンドを発見してビジネスの成長を促進します。
ビジネスインテリジェンス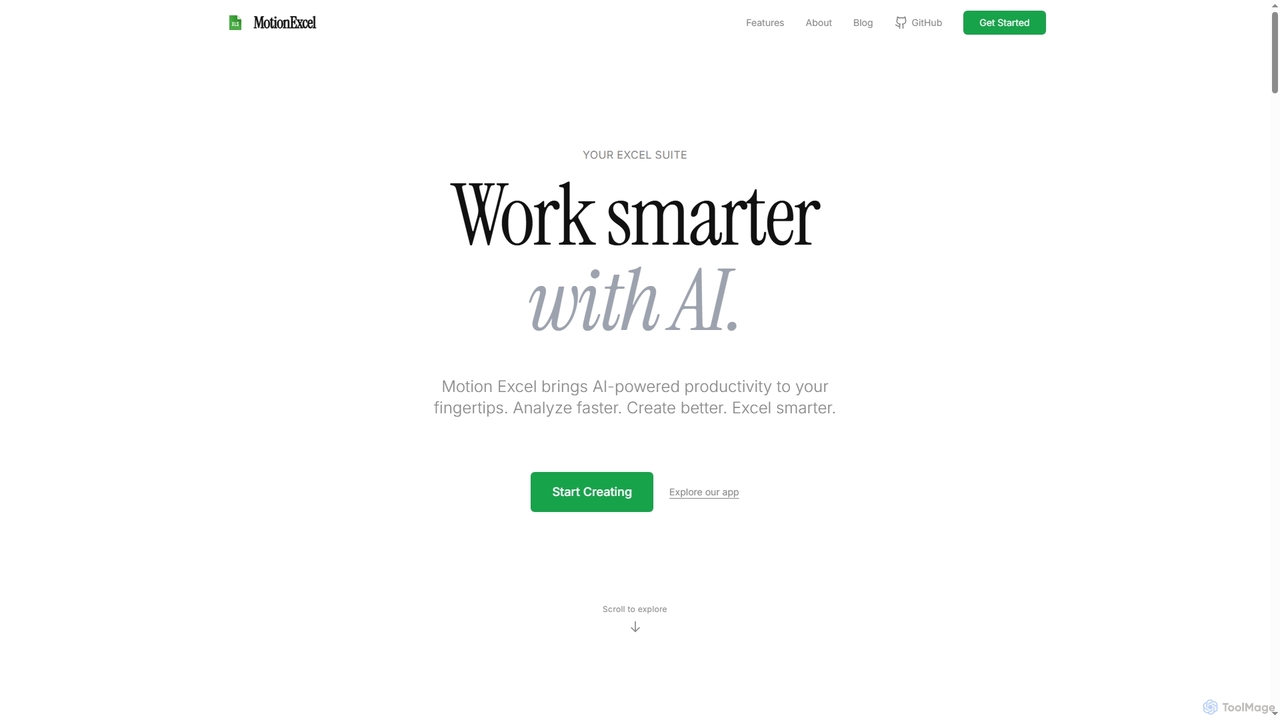
MotionExcelは、AI、Python、SQLを統合し、データ分析と自動化を革新するAI搭載スプレッドシートエディタです。インテリジェントなエージェントと高度な機能により、ユーザーはデータをより迅速に分析し、より良い洞察を生成し、よりスマートに作業できるようになります。
スプレッドシート
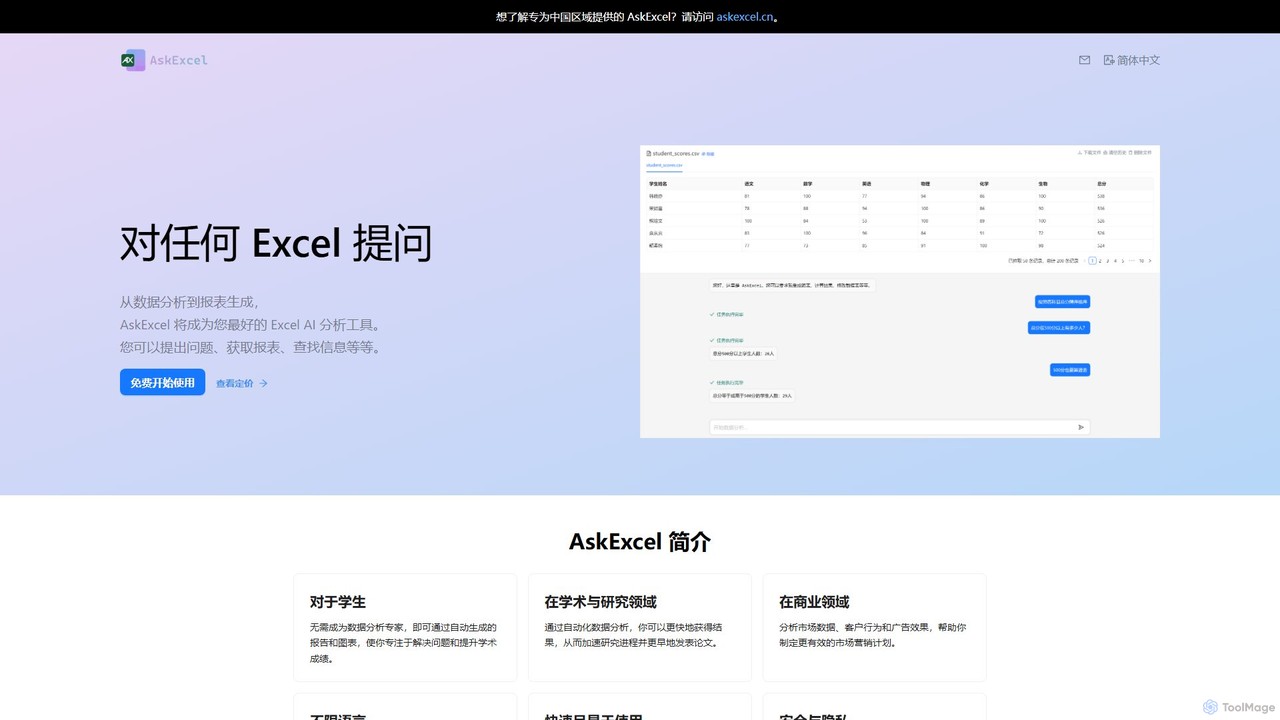
AskExcelは、AIを活用したデータ分析ツールで、Excelスプレッドシートを対話型の会話に変えます。ファイルをアップロードし、自然言語で質問するだけで、数式やコードを書くことなく、即座にデータ分析、レポート、視覚化を取得できます。
ビジネスインテリジェンス
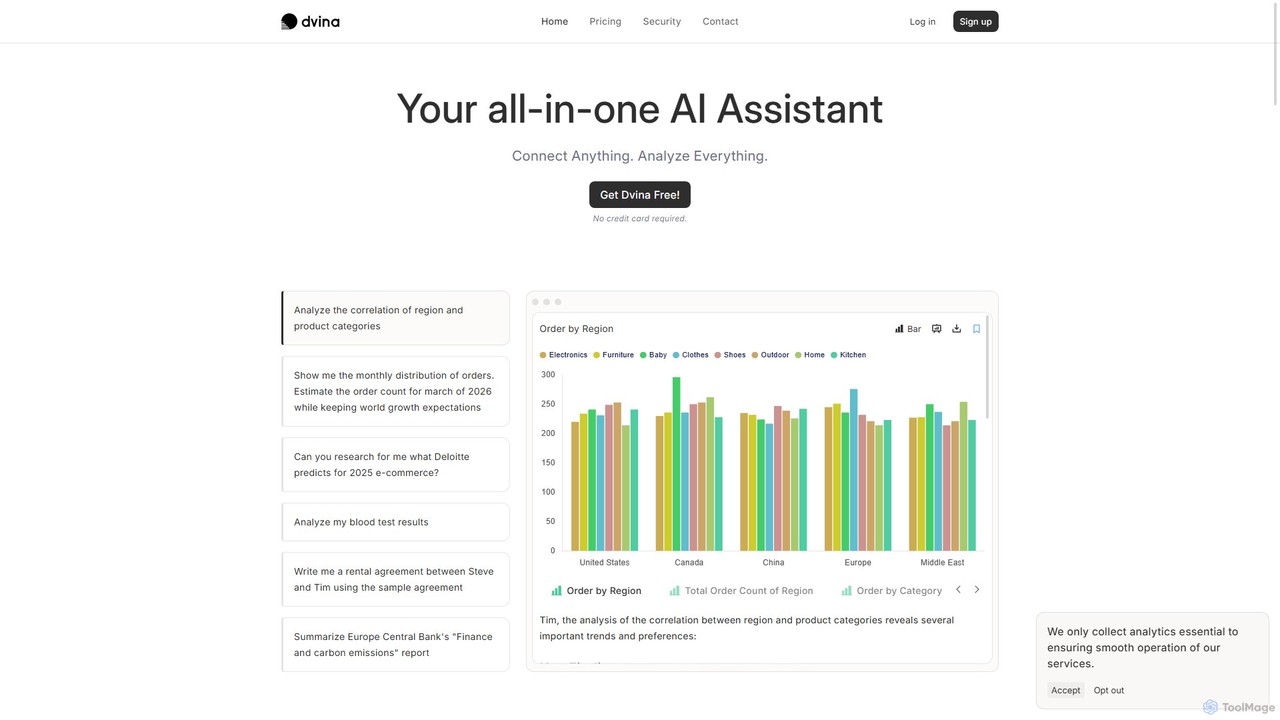
Dvinaは、データとの対話方法を変革するオールインワンAIアシスタントです。ファイル、データベース、アプリなどの様々なソースに接続し、自然言語を使ってコーディングなしで複雑なデータ分析、レポート生成、予測、タスク自動化を実行します。
ビジネスインテリジェンス