ChartDB
視覚化 · 130K 月間訪問数
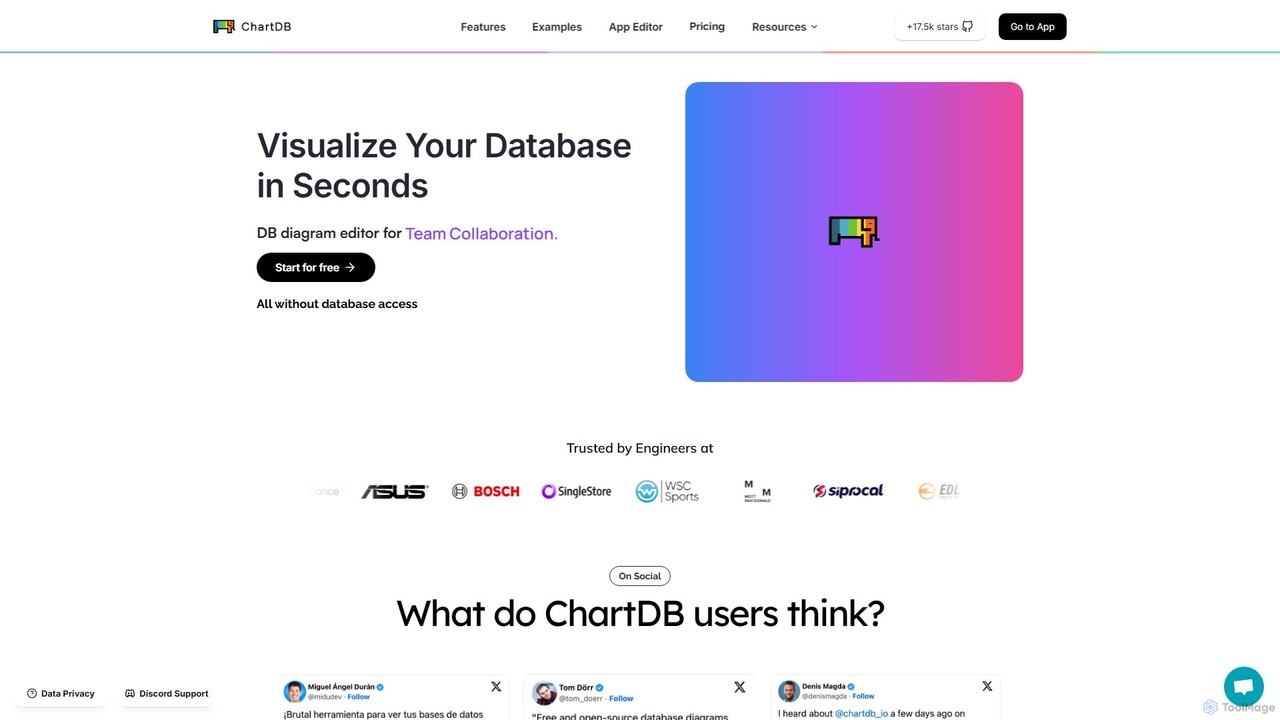
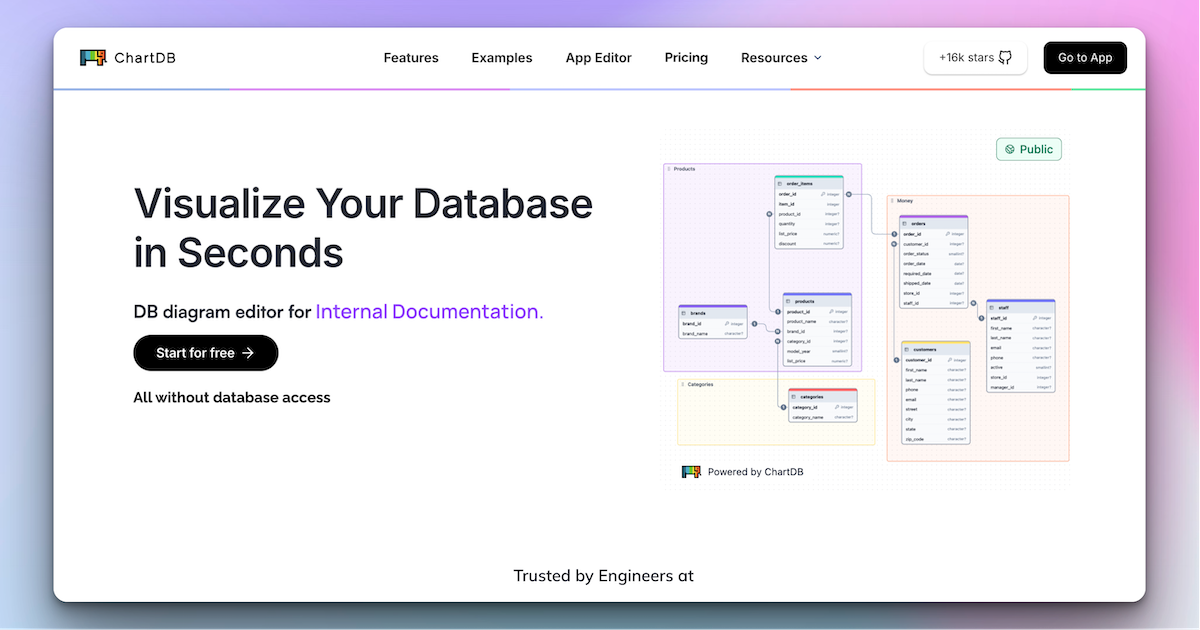
ChartDBは、単一のクエリからインタラクティブなER図を即座に生成するAI搭載のデータベーススキーマ可視化ツールです。開発者やチームがデータベース構造を設計、文書化、共同作業するために作られました。リアルタイムコラボレーション、データベース同期、スキーマ設計を最適化するAIアシスタントを備えています。クラウド版とセルフホストのオープンソース版の両方が利用可能です。
ChartDBは、単一のクエリからインタラクティブなER図を即座に生成するAI搭載のデータベーススキーマ可視化ツールです。開発者やチームがデータベース構造を設計、文書化、共同作業するために作られました。リアルタイムコラボレーション、データベース同期、スキーマ設計を最適化するAIアシスタントを備えています。クラウド版とセルフホストのオープンソース版の両方が利用可能です。
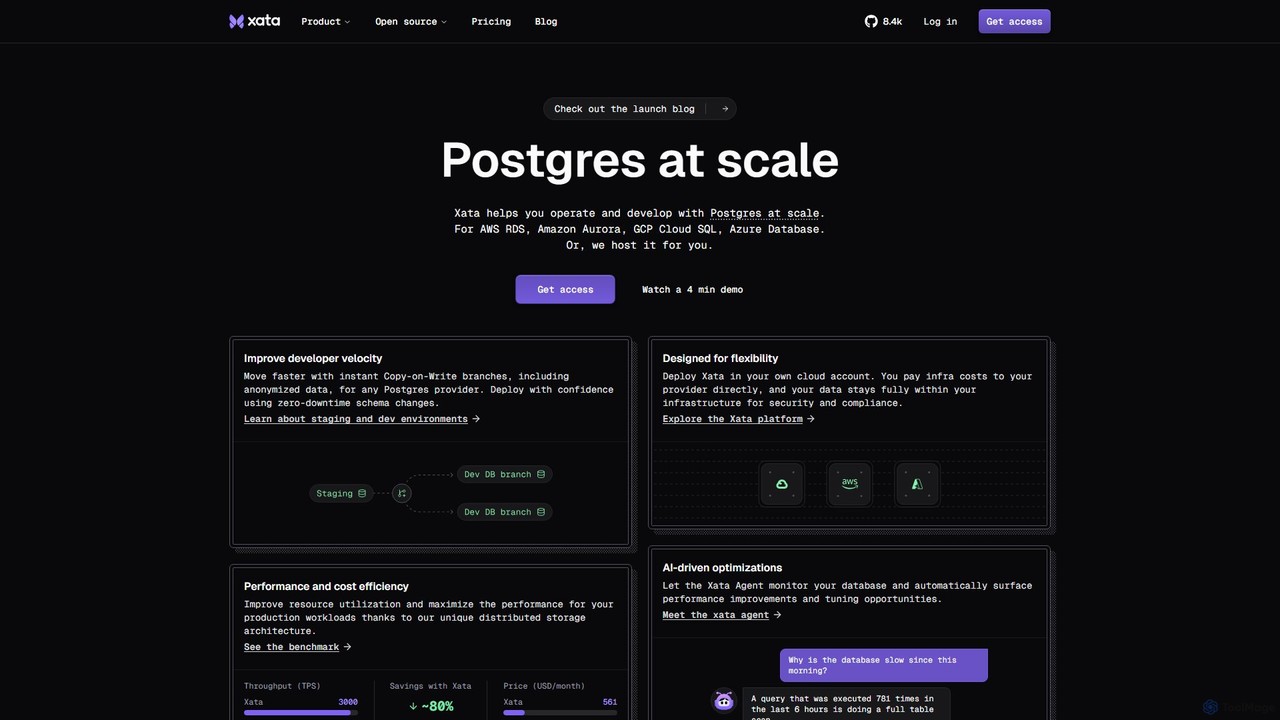
Xataは、開発者のベロシティを向上させ、データベースのパフォーマンスを最適化するために設計された「Postgres at scale」プラットフォームです。PII匿名化を伴う即時コピーオンライトブランチ、ゼロダウンタイムのスキーマ移行、自動パフォーマンスチューニング用のAI搭載エージェントなどのユニークな機能を提供します。Xataのインフラまたは独自のクラウドにデプロイして、最大限の柔軟性とコンプライアンスを実現します。
ChartDBは、単一のクエリからインタラクティブなER図を即座に生成するAI搭載のデータベーススキーマ可視化ツールです。開発者やチームがデータベース構造を設計、文書化、共同作業するために作られました。リアルタイムコラボレーション、データベース同期、スキーマ設計を最適化するAIアシスタントを備えています。クラウド版とセルフホストのオープンソース版の両方が利用可能です。
Xataは、開発者のベロシティを向上させ、データベースのパフォーマンスを最適化するために設計された「Postgres at scale」プラットフォームです。PII匿名化を伴う即時コピーオンライトブランチ、ゼロダウンタイムのスキーマ移行、自動パフォーマンスチューニング用のAI搭載エージェントなどのユニークな機能を提供します。Xataのインフラまたは独自のクラウドにデプロイして、最大限の柔軟性とコンプライアンスを実現します。
Compare ChartDB and Xata by monthly reach, traffic trend, visit depth, top regions, and acquisition sources.
In the ChartDB vs Xata monthly traffic comparison, ChartDB currently shows 130K visits and Xata shows 59.9K; ChartDB has about 2.2 times the visible traffic of Xata, an absolute difference of about 70.1K visits. This reflects visible reach, not feature quality or paid users.
Both tools provide verified traffic details, so monthly trends, visit depth, regions, and acquisition sources can be compared on the same basis.
| Country/region | Percentage | Traffic |
|---|---|---|
| 🇺🇸United States | 25.46% | 33.1K |
| 🇮🇳India | 21.92% | 28.5K |
| 🇪🇸Spain | 21.67% | 28.2K |
| 🇷🇺Russia | 15.79% | 20.5K |
| 🇮🇩Indonesia | 15.16% | 19.7K |
| Source type | Percentage | Traffic |
|---|---|---|
| ダイレクト | 73.39% | 95.4K |
| 参照元 | 26.45% | 34.4K |
| Eメール | 0.16% | 208 |
| Country/region | Percentage | Traffic |
|---|---|---|
| 🇮🇳India | 25.57% | 15.3K |
| 🇳🇬Nigeria | 24.58% | 14.7K |
| 🇻🇳Vietnam | 17.39% | 10.4K |
| 🇺🇸United States | 17.18% | 10.3K |
| 🇮🇩Indonesia | 15.28% | 9.2K |
| Source type | Percentage | Traffic |
|---|---|---|
| ダイレクト | 79.31% | 47.5K |
| 参照元 | 12.72% | 7.6K |
| Eメール | 7.97% | 4.8K |
This in-depth ChartDB vs Xata comparison uses only the product records, taxonomy, audience, traffic, and community signals available on this page. ChartDB is primarily listed under “視覚化”, while Xata is primarily listed under “データベース最適化”, so the first decision is whether your actual task matches their recorded scope.
The structured fields currently show these decision-relevant differences: Primary category (ChartDB: 視覚化; Xata: データベース最適化); Monthly visits (ChartDB: 130K; Xata: 59.9K); Monthly growth (ChartDB: -14.6%; Xata: 3.8%); Favorites (ChartDB: 114; Xata: 124); Website (ChartDB: chartdb.io; Xata: xata.io). These facts are more useful for selection than brand visibility alone.
In the ChartDB vs Xata monthly traffic comparison, ChartDB currently shows 130K visits and Xata shows 59.9K; ChartDB has about 2.2 times the visible traffic of Xata, an absolute difference of about 70.1K visits. This reflects visible reach, not feature quality or paid users.
Both tools provide verified traffic details, so monthly trends, visit depth, regions, and acquisition sources can be compared on the same basis.
If public market visibility is an important first-pass criterion, investigate ChartDB first. The final choice should still follow taxonomy, use case, and a real trial because higher traffic does not prove broader capabilities or better workflow fit.
ChartDB and Xata currently overlap in shared categories: データベース; shared tags: データベース、開発者ツール、PostgreSQL. This can place both on the same shortlist, but it does not prove equal implementation, depth, or cost.
ChartDB's unique categories/tags are 視覚化、図形描画、AIアシスタント、コラボレーション、データベース設計、データモデリング、ER図、MySQL; Xata's are データベース最適化、インフラ、AIエージェント、PC持参、クラウドインフラ、データ分岐、PII匿名化、無停止移行. These unique fields are the strongest differentiators: validate the product whose recorded scope matches the task instead of following traffic alone.
ChartDB has no verified rating, 0 comments, 114 favorites, and 122 likes;Xata has no verified rating, 0 comments, 124 favorites, and 112 likes。
Neither product has enough rating or comment samples for a credible reputation ranking.
Put ChartDB on the priority trial list when the task aligns with “視覚化” and especially 視覚化、図形描画、AIアシスタント、コラボレーション、データベース設計、データモデリング. This follows recorded positioning and does not imply unlisted capabilities are absent.
ChartDB also currently records: pricing is freemium, product type is website, 130K verified monthly visits, no verified user rating. Verify any hard requirement around price, platform, or reach before trial, and do not let sparse review data substitute for testing.
Put Xata on the priority trial list when the task aligns with “データベース最適化” and especially データベース最適化、インフラ、AIエージェント、PC持参、クラウドインフラ、データ分岐. This follows recorded positioning and does not imply unlisted capabilities are absent.
Xata also currently records: pricing is freemium, product type is website, 59.9K verified monthly visits, no verified user rating. Verify any hard requirement around price, platform, or reach before trial, and do not let sparse review data substitute for testing.
The available data describes positioning, public visibility, and community signals, but it cannot prove output quality, speed, integration effort, privacy, or long-term cost in your workflow. Before deciding, run the same representative tasks in ChartDB and Xata, then record completion time, accuracy, manual corrections, and the real paid threshold. A like-for-like trial turns this comparison into a defensible adoption decision.
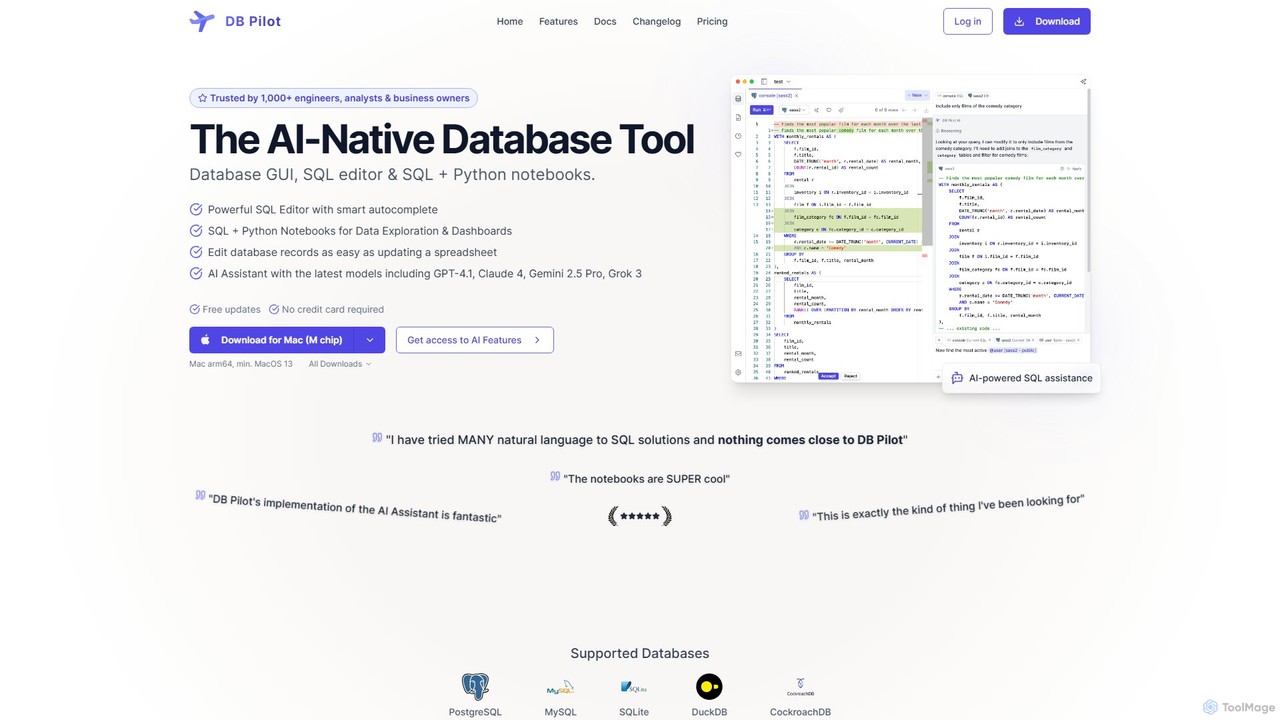
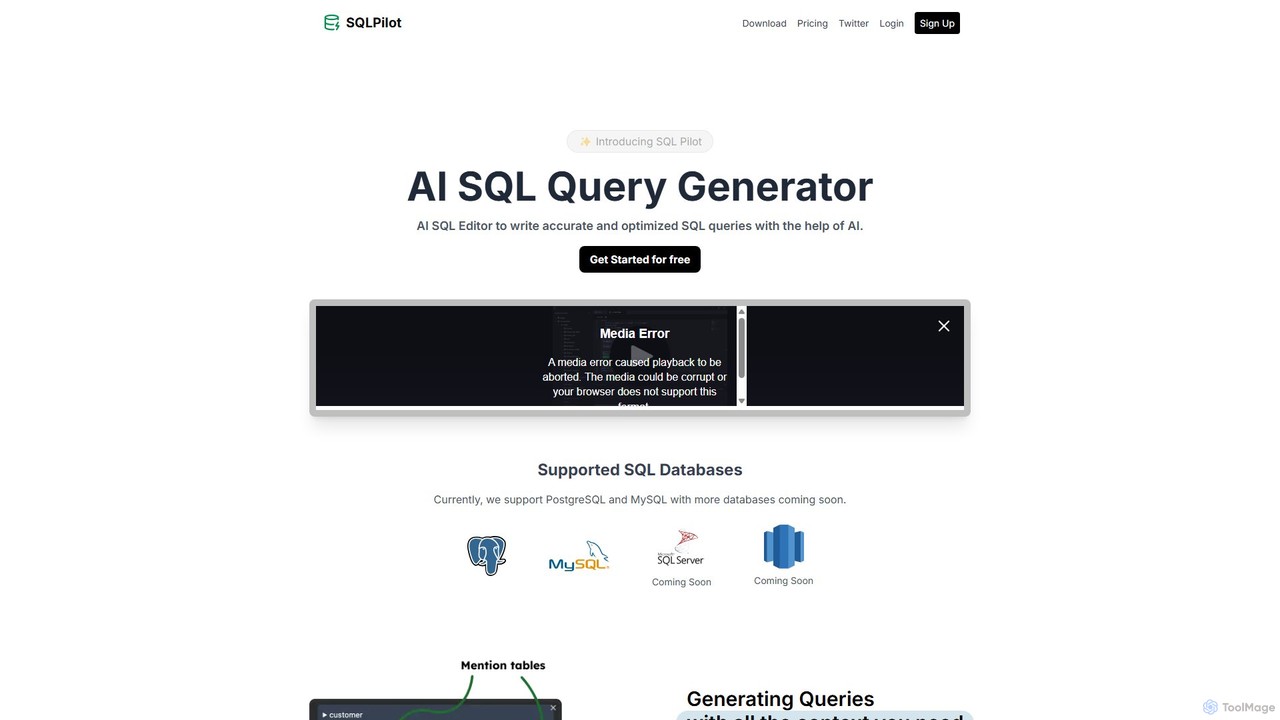
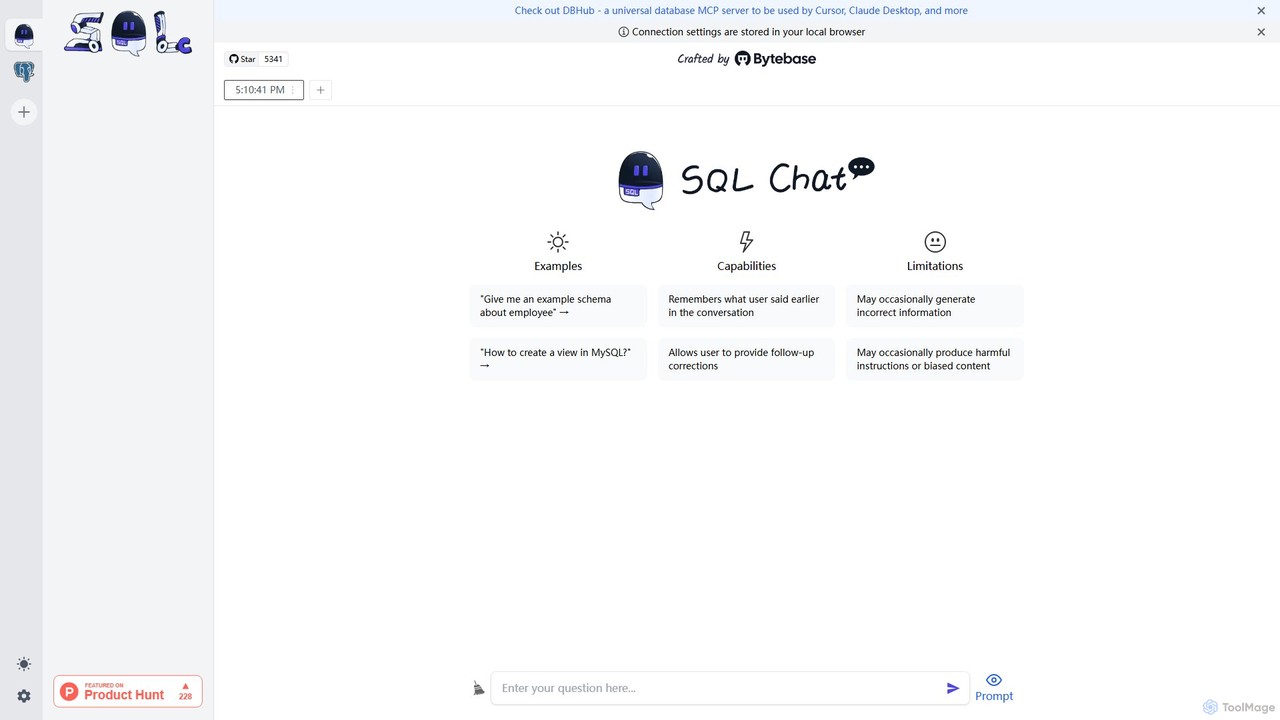
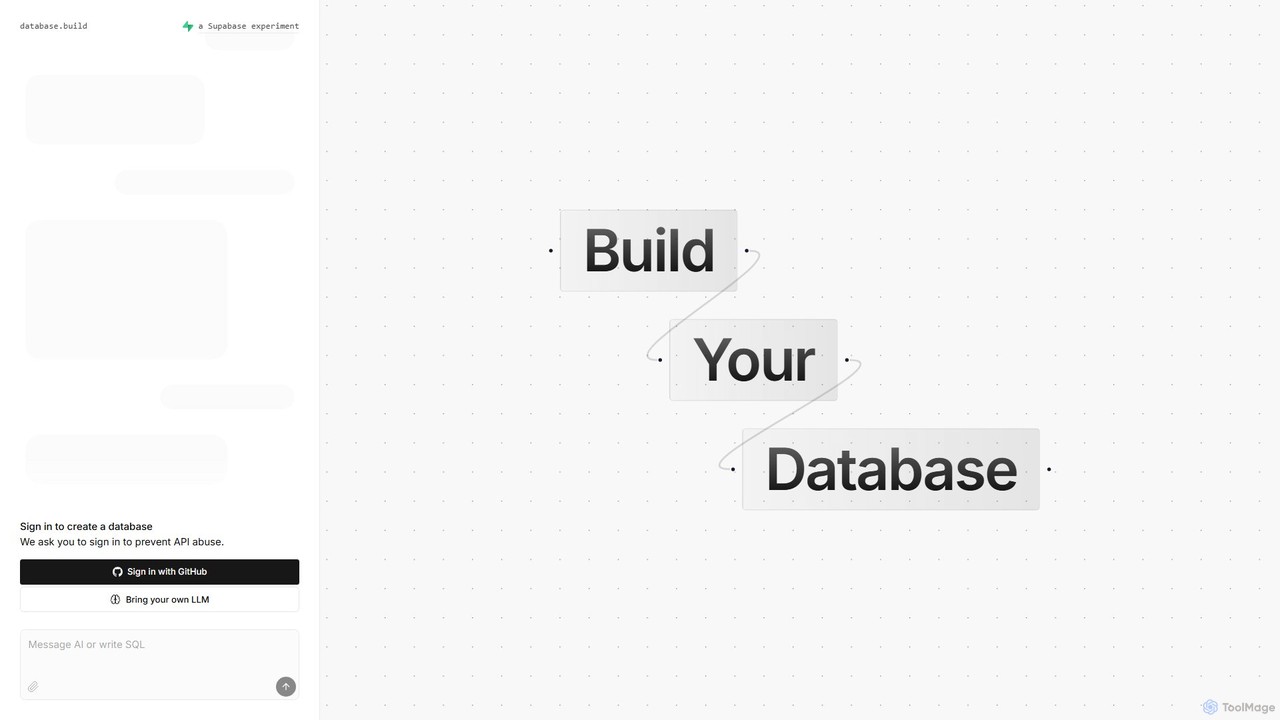
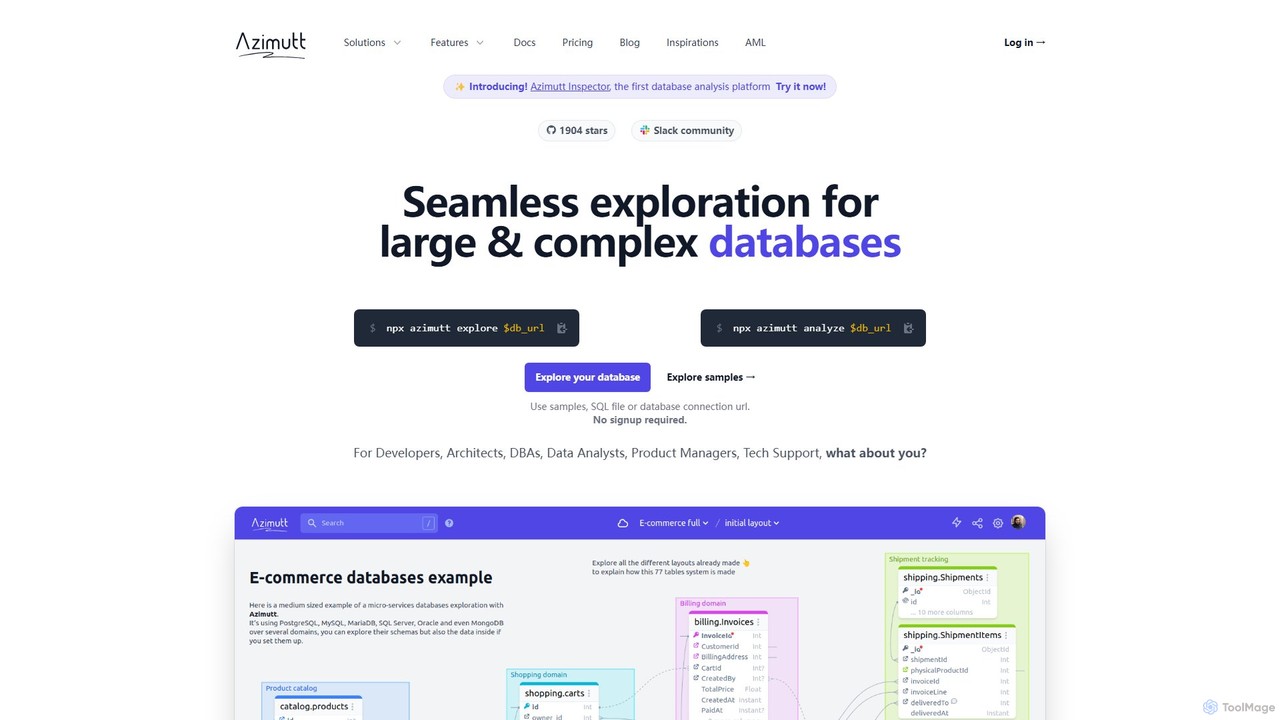
PostgreSQLデータベーススキーマの設計、プロトタイピング、実験を行うための直感的なウェブベースのビジュアルツールです。リスクのないサンドボックス環境でテーブルを作成し、リレーションシップを定義し、SQLコードを生成します。開発者、DBA、学生に最適です。
データベース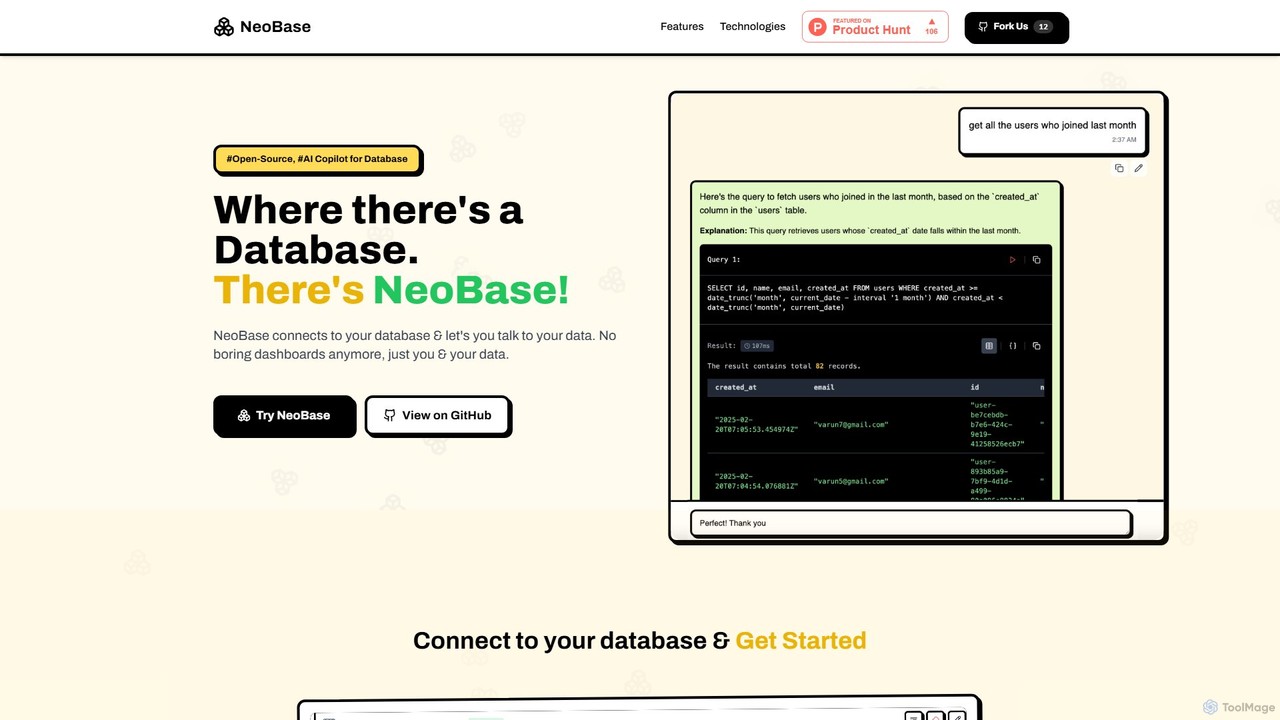
QueryGenieは、自然言語をSQLクエリに変換するAI搭載アシスタントです。開発者、データアナリスト、ビジネスユーザーが複雑なSQLコードを簡単に生成、最適化、理解するのを助け、生産性を大幅に向上させ、データアクセスを民主化します。
コードアシスタント
sqltroughaiは、自然言語をSQLクエリに変換し、既存のコードを最適化し、複雑なクエリを平易な日本語で説明するAI搭載アシスタントです。開発者、アナリスト、ビジネスユーザーがデータベースを簡単かつ効率的に操作できるよう支援します。
コードアシスタント

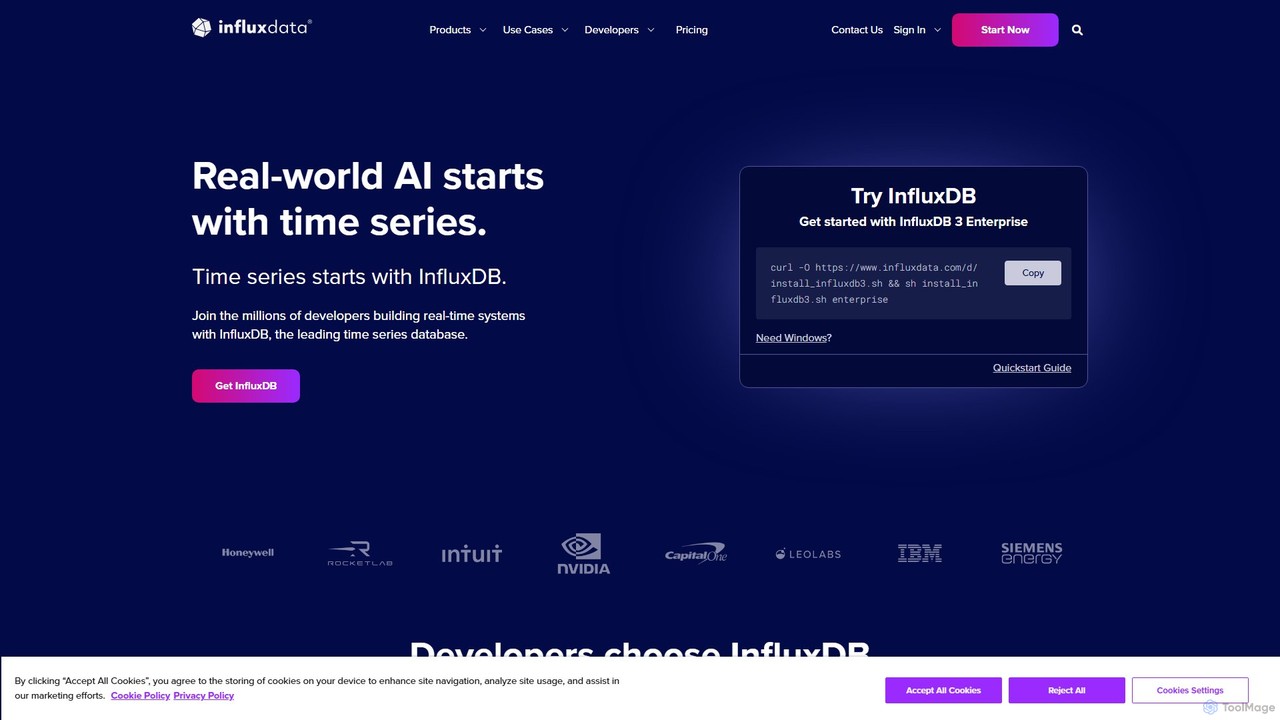
InfluxDataは、リアルタイムデータとAIアプリケーション向けに構築された、主要な時系列データベースプラットフォームであるInfluxDBを提供しています。開発者は、IoT、アプリケーション、インフラから大量の高速データを投入、保存、分析できます。高性能なクエリ、優れたデータ圧縮、データレイクやAI/MLパイプラインとのシームレスな統合を特徴とし、異常検知、予知保全、自律システムのエンジンとなります。
データ管理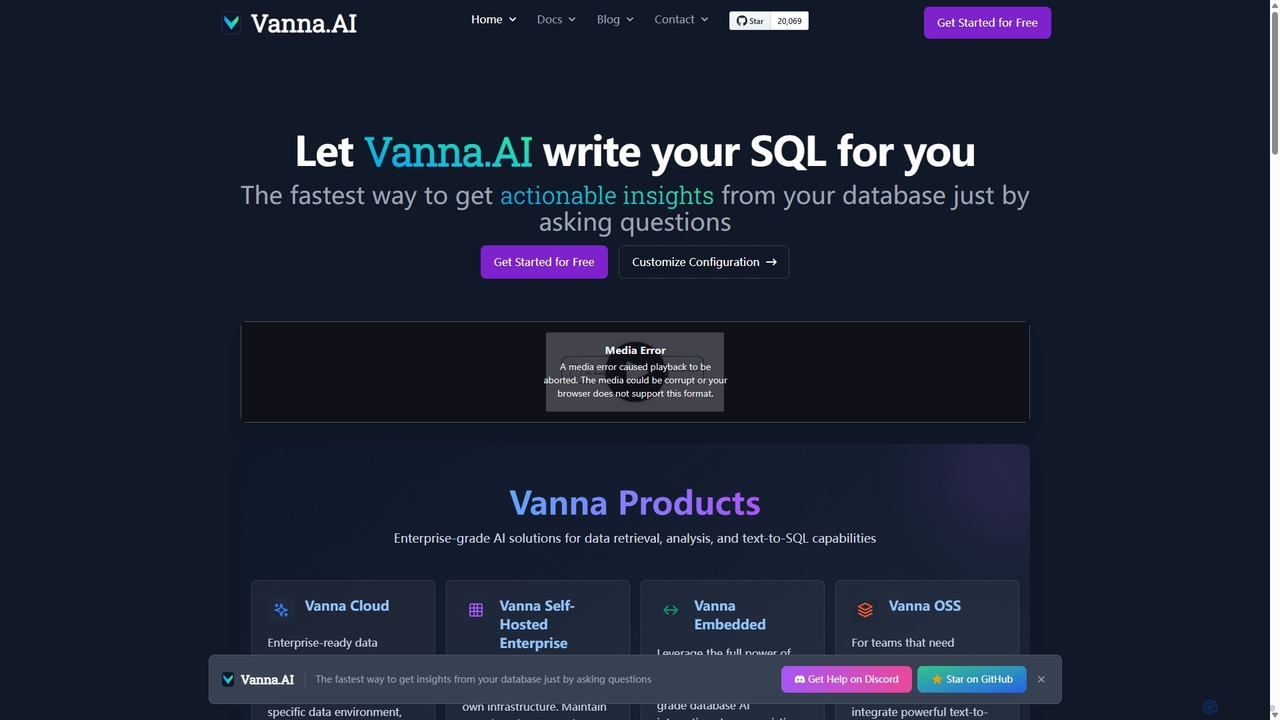
Vanna.AIは、自然言語の質問を正確なSQLクエリに変換する、オープンソースのパーソナライズされたAI SQLエージェントです。特定のデータベーススキーマ、ドキュメント、過去のクエリでトレーニングされた検索拡張生成(RAG)モデルを使用し、複雑なデータセットで高い精度を実現します。セキュリティ、柔軟性、あらゆるアプリケーションへの容易な統合を目的として設計されており、技術者と非技術者の両方がデータから簡単に洞察を得られるようにします。
ビジネスインテリジェンス