charteye
金融学習 · 3.5K 月間訪問数
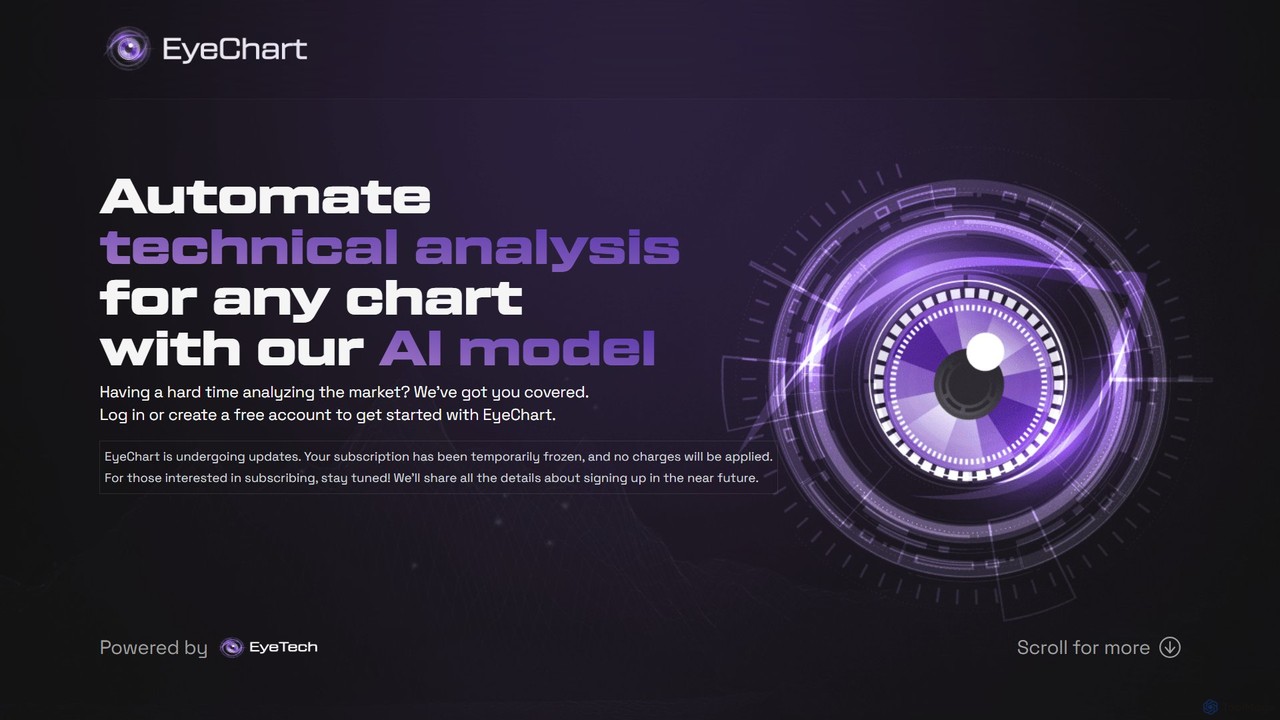
charteyeは、あらゆる金融チャートのテクニカル分析を自動化するAI搭載ツールです。チャート画像をアップロードするか、AIアシスタントのEyeGentと対話するだけで、即座に詳細な分析を受け、主要なパターン、トレンド、取引シグナルを特定できます。暗号資産、株式、その他の市場の初心者からプロまで、あらゆるレベルのトレーダー向けに設計されています。
charteyeは、あらゆる金融チャートのテクニカル分析を自動化するAI搭載ツールです。チャート画像をアップロードするか、AIアシスタントのEyeGentと対話するだけで、即座に詳細な分析を受け、主要なパターン、トレンド、取引シグナルを特定できます。暗号資産、株式、その他の市場の初心者からプロまで、あらゆるレベルのトレーダー向けに設計されています。
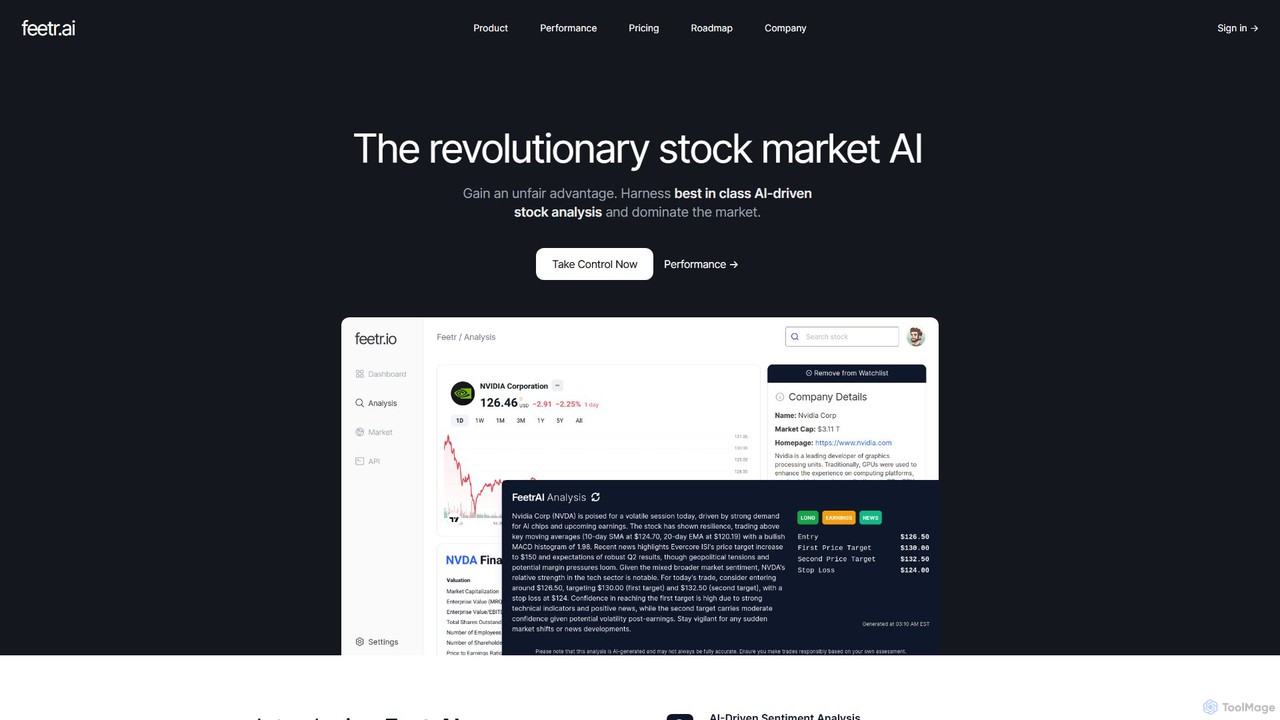
Feetrは、高度なAIを活用した株式市場分析プラットフォームです。リアルタイムのデータ駆動型インサイト、グローバルなセンチメント分析、正確な価格目標を提供し、トレーダーに競争上の優位性をもたらします。個人、大口、機関投資家向けに設計されています。
charteyeは、あらゆる金融チャートのテクニカル分析を自動化するAI搭載ツールです。チャート画像をアップロードするか、AIアシスタントのEyeGentと対話するだけで、即座に詳細な分析を受け、主要なパターン、トレンド、取引シグナルを特定できます。暗号資産、株式、その他の市場の初心者からプロまで、あらゆるレベルのトレーダー向けに設計されています。
Feetrは、高度なAIを活用した株式市場分析プラットフォームです。リアルタイムのデータ駆動型インサイト、グローバルなセンチメント分析、正確な価格目標を提供し、トレーダーに競争上の優位性をもたらします。個人、大口、機関投資家向けに設計されています。
Compare charteye and feetr by monthly reach, traffic trend, visit depth, top regions, and acquisition sources.
In the charteye vs feetr monthly traffic comparison, charteye currently shows 3.5K visits and feetr shows 3.3K; the two products have similar visible traffic, an absolute difference of about 117 visits. This reflects visible reach, not feature quality or paid users.
Both values come from visits recorded inside ToolMage. They can indicate relative interest on this site, but not total website traffic or global market share.
This in-depth charteye vs feetr comparison uses only the product records, taxonomy, audience, traffic, and community signals available on this page. charteye is primarily listed under “金融学習”, while feetr is primarily listed under “株式市場”, so the first decision is whether your actual task matches their recorded scope.
The structured fields currently show these decision-relevant differences: Primary category (charteye: 金融学習; feetr: 株式市場); Pricing (charteye: Freemium; feetr: Paid); Monthly visits (charteye: 3.5K; feetr: 3.3K); Favorites (charteye: 101; feetr: 127); Website (charteye: chart.eye.tech; feetr: feetr.io). These facts are more useful for selection than brand visibility alone.
In the charteye vs feetr monthly traffic comparison, charteye currently shows 3.5K visits and feetr shows 3.3K; the two products have similar visible traffic, an absolute difference of about 117 visits. This reflects visible reach, not feature quality or paid users.
Both values come from visits recorded inside ToolMage. They can indicate relative interest on this site, but not total website traffic or global market share.
The current traffic scope is not sufficient for a reliable product ranking. Treat monthly visits as a market-interest signal, then decide using taxonomy, use cases, pricing, and a like-for-like trial rather than reading exposure as product capability.
charteye and feetr currently overlap in shared categories: 取引、データ分析; shared tags: 金融、投資、株式市場、取引. This can place both on the same shortlist, but it does not prove equal implementation, depth, or cost.
charteye's unique categories/tags are 金融学習、AIアシスタント、チャート分析、暗号通貨、データ視覚化、テクニカル分析; feetr's are 株式市場、AI分析、アルゴリズム取引、API、金融データ、価格予測、感情分析、推奨銘柄. These unique fields are the strongest differentiators: validate the product whose recorded scope matches the task instead of following traffic alone.
charteye has no verified rating, 0 comments, 101 favorites, and 109 likes;feetr has no verified rating, 0 comments, 127 favorites, and 127 likes。
Neither product has enough rating or comment samples for a credible reputation ranking.
Put charteye on the priority trial list when the task aligns with “金融学習” and especially 金融学習、AIアシスタント、チャート分析、暗号通貨、データ視覚化、テクニカル分析. This follows recorded positioning and does not imply unlisted capabilities are absent.
charteye also currently records: pricing is freemium, product type is website, 3.5K on-site monthly views, no verified user rating. Verify any hard requirement around price, platform, or reach before trial, and do not let sparse review data substitute for testing.
Put feetr on the priority trial list when the task aligns with “株式市場” and especially 株式市場、AI分析、アルゴリズム取引、API、金融データ、価格予測. This follows recorded positioning and does not imply unlisted capabilities are absent.
feetr also currently records: pricing is paid, product type is website, 3.3K on-site monthly views, no verified user rating. Verify any hard requirement around price, platform, or reach before trial, and do not let sparse review data substitute for testing.
The available data describes positioning, public visibility, and community signals, but it cannot prove output quality, speed, integration effort, privacy, or long-term cost in your workflow. Before deciding, run the same representative tasks in charteye and feetr, then record completion time, accuracy, manual corrections, and the real paid threshold. A like-for-like trial turns this comparison into a defensible adoption decision.