ChartGen
チャートとグラフ · 148.3K 月間訪問数
ChartGenは、生のデータを数秒で魅力的なプロフェッショナルな視覚化チャートに変換するAI搭載のチャートジェネレーターです。ユーザーはCSVまたはExcelファイルをアップロードし、目的のチャートを平易な英語で記述するだけで、AIが棒グラフ、折れ線グラフ、円グラフなど、さまざまな種類のチャートを即座に作成します。デザインやコーディングスキルを必要とせず、迅速で簡単なデータ視覚化のために設計されています。
ChartGenは、生のデータを数秒で魅力的なプロフェッショナルな視覚化チャートに変換するAI搭載のチャートジェネレーターです。ユーザーはCSVまたはExcelファイルをアップロードし、目的のチャートを平易な英語で記述するだけで、AIが棒グラフ、折れ線グラフ、円グラフなど、さまざまな種類のチャートを即座に作成します。デザインやコーディングスキルを必要とせず、迅速で簡単なデータ視覚化のために設計されています。
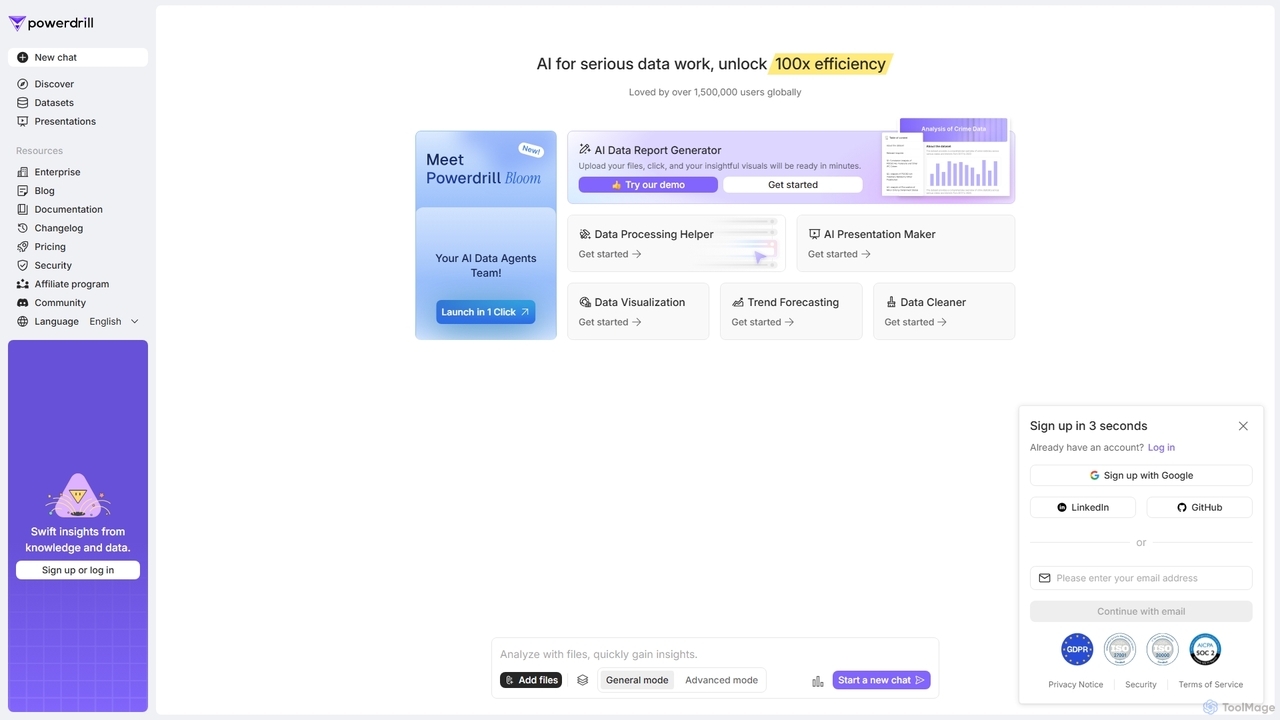
Powerdrillは、本格的なデータ作業のために設計されたAI搭載のデータ分析プラットフォームで、ユーザーが100倍の効率を実現できるよう支援します。データ処理やクリーニングから、可視化、レポート生成、トレンド予測までの全プロセスを自動化します。ファイル(Excel、CSV、PDF)をアップロードするか、データベースに接続するだけで、AIが数分で実用的なインサイト、インタラクティブなチャート、包括的なプレゼンテーションを生成します。
ChartGenは、生のデータを数秒で魅力的なプロフェッショナルな視覚化チャートに変換するAI搭載のチャートジェネレーターです。ユーザーはCSVまたはExcelファイルをアップロードし、目的のチャートを平易な英語で記述するだけで、AIが棒グラフ、折れ線グラフ、円グラフなど、さまざまな種類のチャートを即座に作成します。デザインやコーディングスキルを必要とせず、迅速で簡単なデータ視覚化のために設計されています。
Powerdrillは、本格的なデータ作業のために設計されたAI搭載のデータ分析プラットフォームで、ユーザーが100倍の効率を実現できるよう支援します。データ処理やクリーニングから、可視化、レポート生成、トレンド予測までの全プロセスを自動化します。ファイル(Excel、CSV、PDF)をアップロードするか、データベースに接続するだけで、AIが数分で実用的なインサイト、インタラクティブなチャート、包括的なプレゼンテーションを生成します。
| Feature | ChartGen | Powerdrill |
|---|---|---|
| 主要カテゴリー | チャートとグラフ | ビジネスインテリジェンス |
| 追加日 | 2026-01-06 | 2025-09-03 |
| 価格 | フリーミアム | フリーミアム |
| 公式サイト | chartgen.ai | powerdrill.ai |
| 製品タイプ | ウェブサイト | ウェブサイト |
| Performance data | ||
| ユーザー評価 | 未確認 | 未確認 |
| コメント | 0 | 0 |
| 月間訪問数 | 148.3K | 139.4K |
| 月間成長率 | 49.6% | 10.4% |
| お気に入り | 24 | 96 |
| Details | 詳細を見る | 詳細を見る |
Compare ChartGen and Powerdrill by monthly reach, traffic trend, visit depth, top regions, and acquisition sources.
In the ChartGen vs Powerdrill monthly traffic comparison, ChartGen currently shows 148.3K visits and Powerdrill shows 139.4K; the two products have similar visible traffic, an absolute difference of about 8.9K visits. This reflects visible reach, not feature quality or paid users.
Both tools provide verified traffic details, so monthly trends, visit depth, regions, and acquisition sources can be compared on the same basis.
| Country/region | Percentage | Traffic |
|---|---|---|
| 🇷🇺Russia | 27.78% | 41.2K |
| 🇺🇸United States | 25.7% | 38.1K |
| 🇸🇦Saudi Arabia | 19.54% | 29K |
| 🇮🇳India | 16.87% | 25K |
| 🇬🇧United Kingdom | 10.11% | 15K |
| Source type | Percentage | Traffic |
|---|---|---|
| ダイレクト | 82.55% | 122.4K |
| 参照元 | 16.19% | 24K |
| Eメール | 1.26% | 1.9K |
| Country/region | Percentage | Traffic |
|---|---|---|
| 🇪🇸Spain | 31.85% | 44.4K |
| 🇸🇦Saudi Arabia | 20.8% | 29K |
| 🇮🇳India | 20.58% | 28.7K |
| 🇺🇸United States | 16.31% | 22.7K |
| 🇻🇳Vietnam | 10.46% | 14.6K |
| Source type | Percentage | Traffic |
|---|---|---|
| 参照元 | 53.48% | 74.5K |
| ダイレクト | 43.77% | 61K |
| Eメール | 2.75% | 3.8K |
This in-depth ChartGen vs Powerdrill comparison uses only the product records, taxonomy, audience, traffic, and community signals available on this page. ChartGen is primarily listed under “チャートとグラフ”, while Powerdrill is primarily listed under “ビジネスインテリジェンス”, so the first decision is whether your actual task matches their recorded scope.
The structured fields currently show these decision-relevant differences: Primary category (ChartGen: チャートとグラフ; Powerdrill: ビジネスインテリジェンス); Monthly visits (ChartGen: 148.3K; Powerdrill: 139.4K); Monthly growth (ChartGen: 49.6%; Powerdrill: 10.4%); Favorites (ChartGen: 24; Powerdrill: 96); Website (ChartGen: chartgen.ai; Powerdrill: powerdrill.ai). These facts are more useful for selection than brand visibility alone.
In the ChartGen vs Powerdrill monthly traffic comparison, ChartGen currently shows 148.3K visits and Powerdrill shows 139.4K; the two products have similar visible traffic, an absolute difference of about 8.9K visits. This reflects visible reach, not feature quality or paid users.
Both tools provide verified traffic details, so monthly trends, visit depth, regions, and acquisition sources can be compared on the same basis.
The current traffic scope is not sufficient for a reliable product ranking. Treat monthly visits as a market-interest signal, then decide using taxonomy, use cases, pricing, and a like-for-like trial rather than reading exposure as product capability.
ChartGen and Powerdrill currently overlap in shared tags: ビジネスインテリジェンス、データ分析、データ視覚化; shared roles: ビジネスアナリスト、データアナリスト、金融アナリスト、人事マネージャー、マーケティングマネージャー、プロダクトマネージャー、研究者、営業担当者. This can place both on the same shortlist, but it does not prove equal implementation, depth, or cost.
ChartGen's unique categories/tags are チャートとグラフ、チャートとダイアグラム、AIチャートジェネレーター、アナリティクス、チャートメーカー、データセキュリティ、ドラッグ&ドロップ、財務報告; Powerdrill's are ビジネスインテリジェンス、データベース、データ分析、AIレポートジェネレーター、PDFとチャット、CSV分析、データクレンジング、Excel 分析. These unique fields are the strongest differentiators: validate the product whose recorded scope matches the task instead of following traffic alone.
ChartGen has no verified rating, 0 comments, 24 favorites, and 18 likes;Powerdrill has no verified rating, 0 comments, 96 favorites, and 104 likes。
Neither product has enough rating or comment samples for a credible reputation ranking.
Put ChartGen on the priority trial list when the task aligns with “チャートとグラフ” and especially チャートとグラフ、チャートとダイアグラム、AIチャートジェネレーター、アナリティクス、チャートメーカー、データセキュリティ, or the users include コンサルタント、役員. This follows recorded positioning and does not imply unlisted capabilities are absent.
ChartGen also currently records: pricing is freemium, product type is website, 148.3K verified monthly visits, no verified user rating. Verify any hard requirement around price, platform, or reach before trial, and do not let sparse review data substitute for testing.
Put Powerdrill on the priority trial list when the task aligns with “ビジネスインテリジェンス” and especially ビジネスインテリジェンス、データベース、データ分析、AIレポートジェネレーター、PDFとチャット、CSV分析, or the users include 学生. This follows recorded positioning and does not imply unlisted capabilities are absent.
Powerdrill also currently records: pricing is freemium, product type is website, 139.4K verified monthly visits, no verified user rating. Verify any hard requirement around price, platform, or reach before trial, and do not let sparse review data substitute for testing.
The available data describes positioning, public visibility, and community signals, but it cannot prove output quality, speed, integration effort, privacy, or long-term cost in your workflow. Before deciding, run the same representative tasks in ChartGen and Powerdrill, then record completion time, accuracy, manual corrections, and the real paid threshold. A like-for-like trial turns this comparison into a defensible adoption decision.