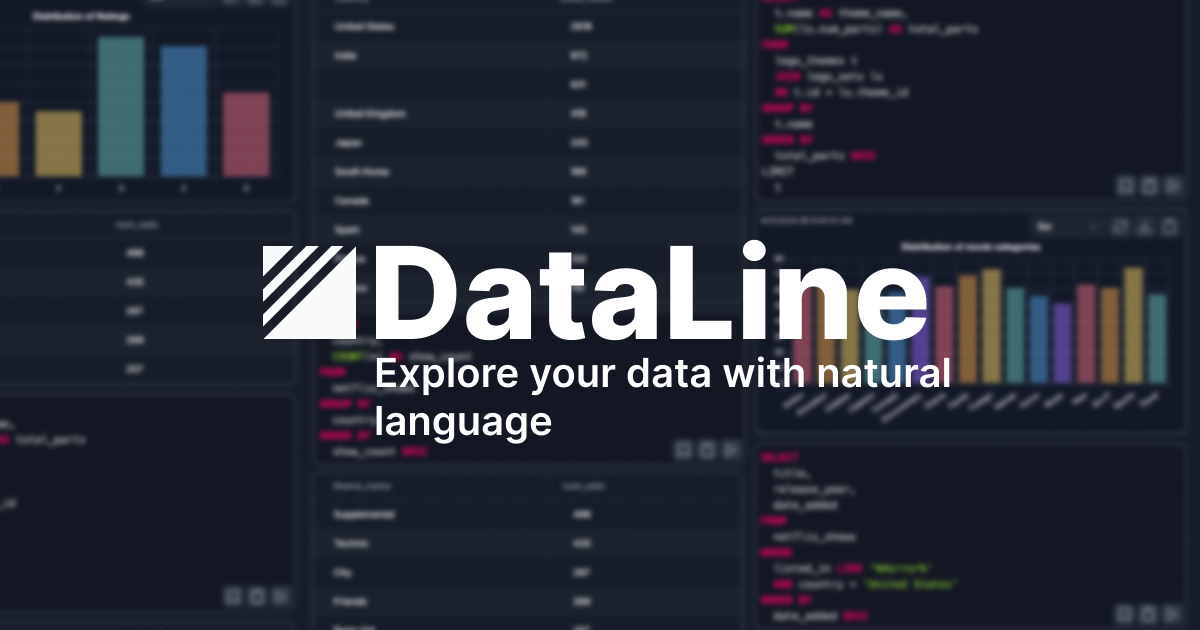
DataLine
分析 · 3.5K 月間訪問数
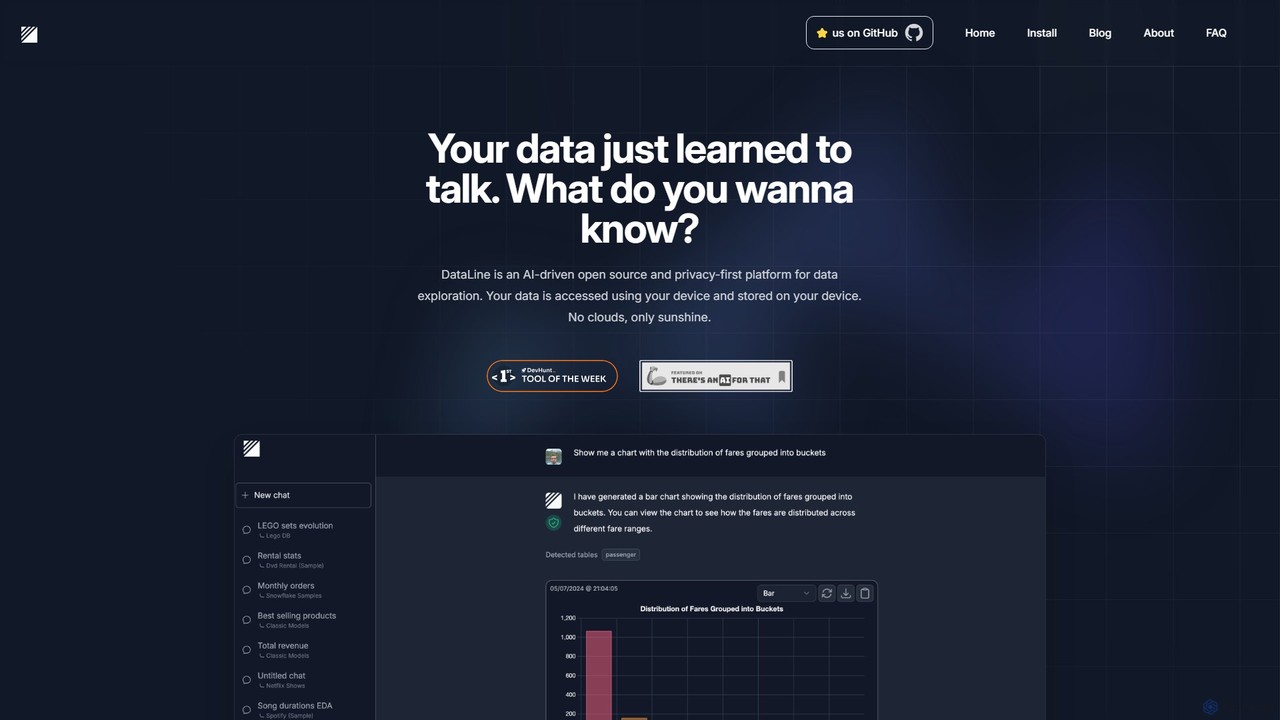
DataLineは、自然言語を通じてデータを探索できる、オープンソースでプライバシー第一のAIプラットフォームです。データベースやファイルに安全に接続し、質問するだけで、データがデバイスを離れることなく、即座にインサイトや可視化を得られます。
DataLineは、自然言語を通じてデータを探索できる、オープンソースでプライバシー第一のAIプラットフォームです。データベースやファイルに安全に接続し、質問するだけで、データがデバイスを離れることなく、即座にインサイトや可視化を得られます。
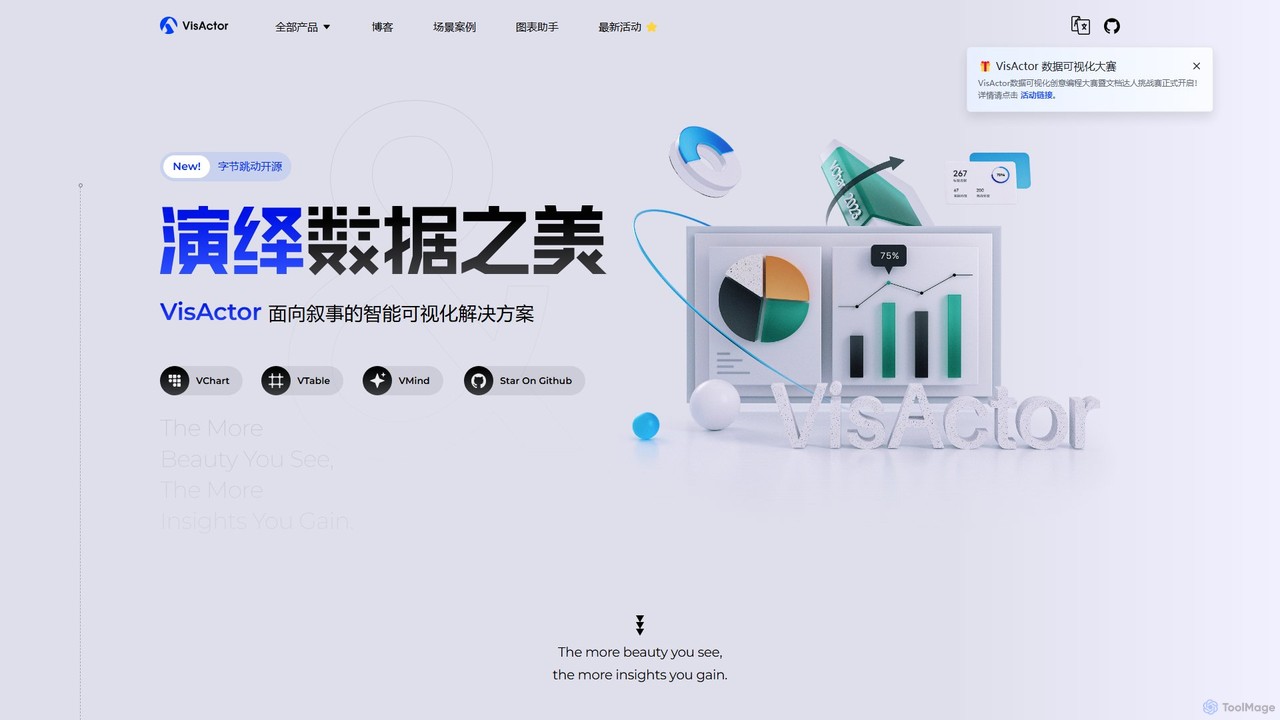
VisActorは、ByteDanceが開発したオープンソースのナラティブ指向インテリジェント可視化ソリューションです。VChartやVTableを含む包括的なツールスイートを提供し、データを魅力的なビジュアルストーリーに変換します。AI搭載コンポーネントVMindにより、チャート作成を簡素化し、ダイナミックでクロスプラットフォームなデータプレゼンテーションを実現します。
DataLineは、自然言語を通じてデータを探索できる、オープンソースでプライバシー第一のAIプラットフォームです。データベースやファイルに安全に接続し、質問するだけで、データがデバイスを離れることなく、即座にインサイトや可視化を得られます。
VisActorは、ByteDanceが開発したオープンソースのナラティブ指向インテリジェント可視化ソリューションです。VChartやVTableを含む包括的なツールスイートを提供し、データを魅力的なビジュアルストーリーに変換します。AI搭載コンポーネントVMindにより、チャート作成を簡素化し、ダイナミックでクロスプラットフォームなデータプレゼンテーションを実現します。
| Feature | DataLine | VisActor |
|---|---|---|
| 主要カテゴリー | 分析 | ライブラリとフレームワーク |
| 追加日 | 2025-08-07 | 2025-08-12 |
| 価格 | 無料 | 無料 |
| 公式サイト | dataline.app | visactor.io |
| 製品タイプ | アプリ | ウェブサイト |
| Performance data | ||
| ユーザー評価 | 未確認 | 未確認 |
| コメント | 0 | 0 |
| 月間訪問数 | 3.5K | 22.3K |
| 月間成長率 | 43.8% | -27.7% |
| お気に入り | 112 | 126 |
| Details | 詳細を見る | 詳細を見る |
Compare DataLine and VisActor by monthly reach, traffic trend, visit depth, top regions, and acquisition sources.
In the DataLine vs VisActor monthly traffic comparison, DataLine currently shows 3.5K visits and VisActor shows 22.3K; VisActor has about 6.3 times the visible traffic of DataLine, an absolute difference of about 18.7K visits. This reflects visible reach, not feature quality or paid users.
Both tools provide verified traffic details, so monthly trends, visit depth, regions, and acquisition sources can be compared on the same basis.
| Country/region | Percentage | Traffic |
|---|---|---|
| 🇺🇸United States | 56.06% | 2K |
| 🇹🇷Turkey | 25.8% | 913 |
| 🇮🇳India | 18.14% | 642 |
| Country/region | Percentage | Traffic |
|---|---|---|
| 🇨🇳China | 84.12% | 18.7K |
| 🇺🇸United States | 6.91% | 1.5K |
| 🇰🇷Korea, Republic of | 3.07% | 684 |
| 🇧🇷Brazil | 2.99% | 666 |
| 🇭🇰Hong Kong | 2.91% | 648 |
| Source type | Percentage | Traffic |
|---|---|---|
| ダイレクト | 79.43% | 17.7K |
| 参照元 | 20.57% | 4.6K |
This in-depth DataLine vs VisActor comparison uses only the product records, taxonomy, audience, traffic, and community signals available on this page. DataLine is primarily listed under “分析”, while VisActor is primarily listed under “ライブラリとフレームワーク”, so the first decision is whether your actual task matches their recorded scope.
The structured fields currently show these decision-relevant differences: Primary category (DataLine: 分析; VisActor: ライブラリとフレームワーク); Product type (DataLine: App; VisActor: Website); Monthly visits (DataLine: 3.5K; VisActor: 22.3K); Monthly growth (DataLine: 43.8%; VisActor: -27.7%); Favorites (DataLine: 112; VisActor: 126). These facts are more useful for selection than brand visibility alone.
In the DataLine vs VisActor monthly traffic comparison, DataLine currently shows 3.5K visits and VisActor shows 22.3K; VisActor has about 6.3 times the visible traffic of DataLine, an absolute difference of about 18.7K visits. This reflects visible reach, not feature quality or paid users.
Both tools provide verified traffic details, so monthly trends, visit depth, regions, and acquisition sources can be compared on the same basis.
If public market visibility is an important first-pass criterion, investigate VisActor first. The final choice should still follow taxonomy, use case, and a real trial because higher traffic does not prove broader capabilities or better workflow fit.
DataLine and VisActor currently overlap in shared categories: ビジネスインテリジェンス; shared tags: ビジネスインテリジェンス、データ視覚化、オープンソース. This can place both on the same shortlist, but it does not prove equal implementation, depth, or cost.
DataLine's unique categories/tags are 分析、データベース、データとチャット、データ分析、ローカルAI、自然言語クエリ、PostgreSQL、プライバシー; VisActor's are ライブラリとフレームワーク、AIチャートジェネレーター、チャート、データストーリーテリング、開発者ツール、グラフ、JavaScriptライブラリ、ナラティブ・ビジュアライゼーション. These unique fields are the strongest differentiators: validate the product whose recorded scope matches the task instead of following traffic alone.
DataLine has no verified rating, 0 comments, 112 favorites, and 127 likes;VisActor has no verified rating, 0 comments, 126 favorites, and 121 likes。
Neither product has enough rating or comment samples for a credible reputation ranking.
Put DataLine on the priority trial list when the task aligns with “分析” and especially 分析、データベース、データとチャット、データ分析、ローカルAI、自然言語クエリ. This follows recorded positioning and does not imply unlisted capabilities are absent.
DataLine also currently records: pricing is free, product type is app, 3.5K verified monthly visits, no verified user rating. Verify any hard requirement around price, platform, or reach before trial, and do not let sparse review data substitute for testing.
Put VisActor on the priority trial list when the task aligns with “ライブラリとフレームワーク” and especially ライブラリとフレームワーク、AIチャートジェネレーター、チャート、データストーリーテリング、開発者ツール、グラフ. This follows recorded positioning and does not imply unlisted capabilities are absent.
VisActor also currently records: pricing is free, product type is website, 22.3K verified monthly visits, no verified user rating. Verify any hard requirement around price, platform, or reach before trial, and do not let sparse review data substitute for testing.
The available data describes positioning, public visibility, and community signals, but it cannot prove output quality, speed, integration effort, privacy, or long-term cost in your workflow. Before deciding, run the same representative tasks in DataLine and VisActor, then record completion time, accuracy, manual corrections, and the real paid threshold. A like-for-like trial turns this comparison into a defensible adoption decision.
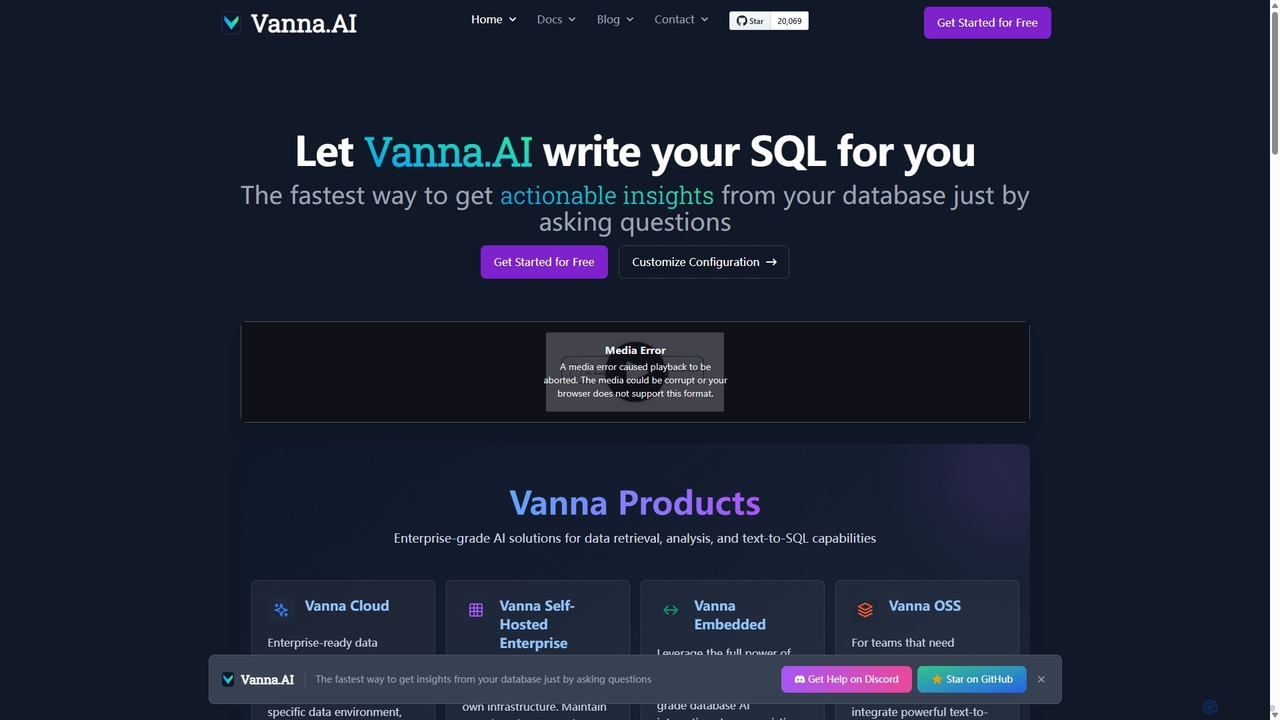
Vanna.AIは、自然言語の質問を正確なSQLクエリに変換する、オープンソースのパーソナライズされたAI SQLエージェントです。特定のデータベーススキーマ、ドキュメント、過去のクエリでトレーニングされた検索拡張生成(RAG)モデルを使用し、複雑なデータセットで高い精度を実現します。セキュリティ、柔軟性、あらゆるアプリケーションへの容易な統合を目的として設計されており、技術者と非技術者の両方がデータから簡単に洞察を得られるようにします。
ビジネスインテリジェンス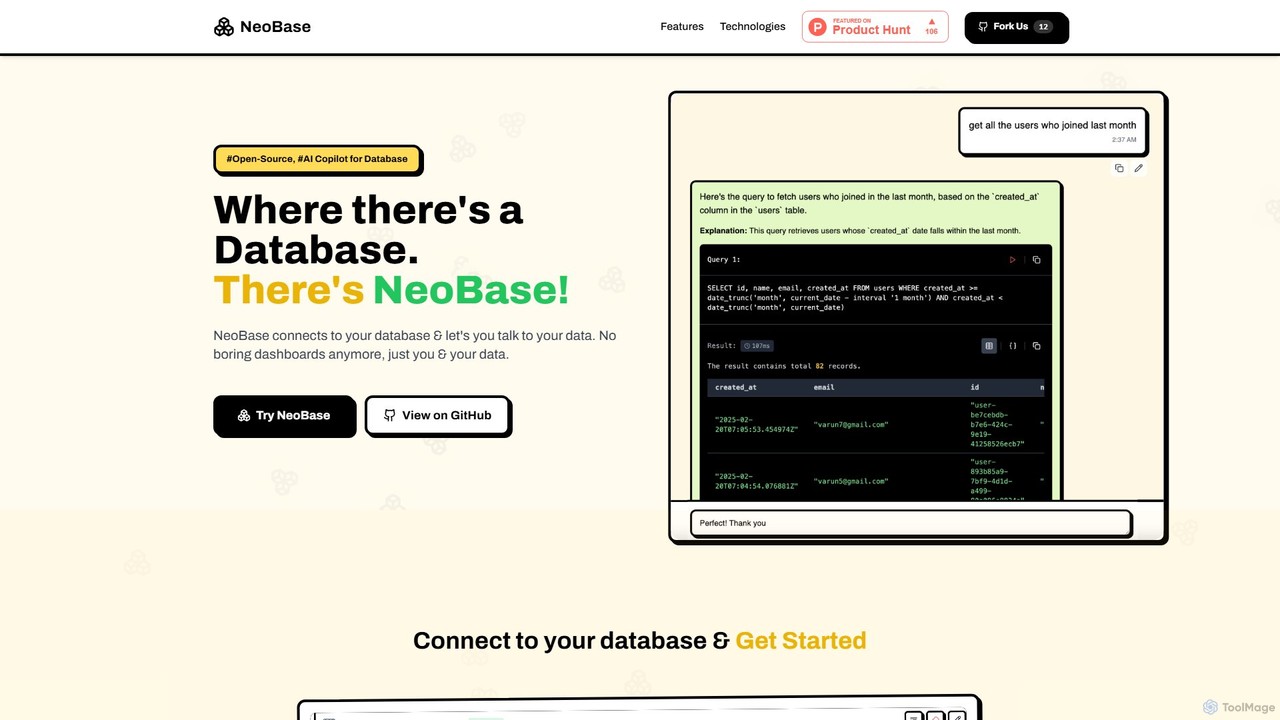
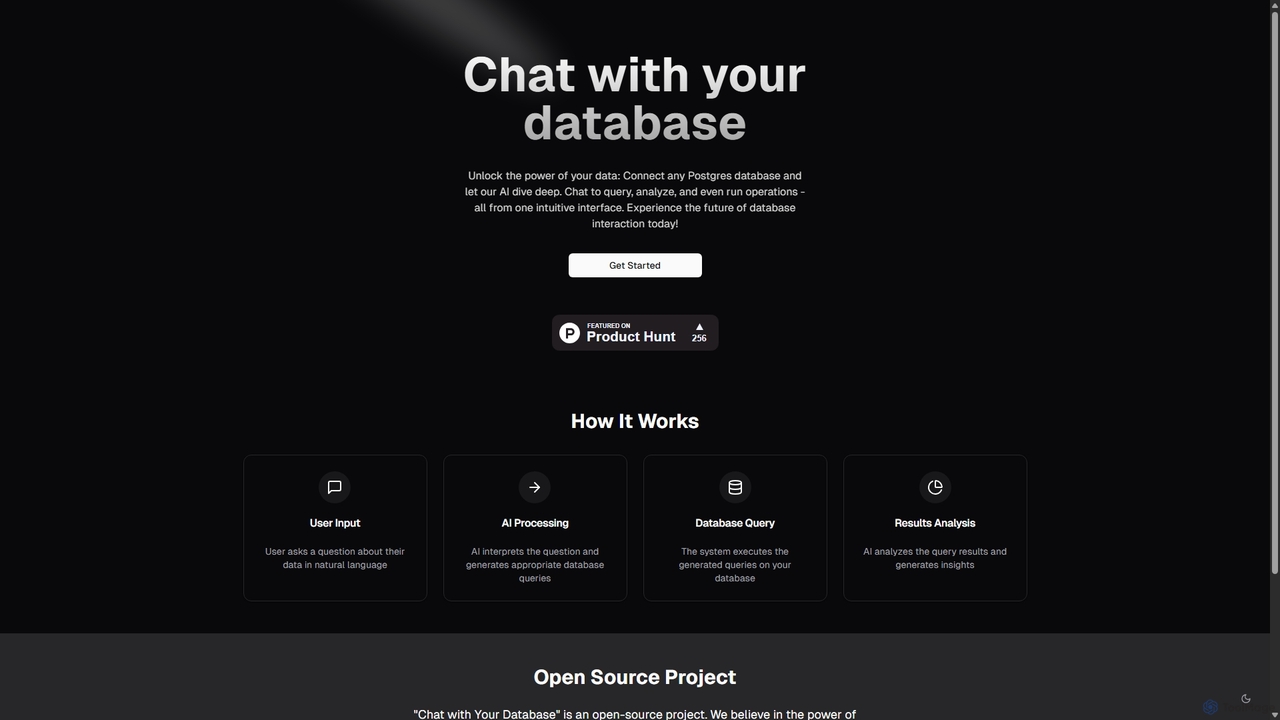
自然言語を使ってPostgreSQLデータベースと対話できるオープンソースのAIツールです。複雑なSQLクエリなしで、簡単なチャットインターフェースを通じて質問し、洞察を得て、操作を実行します。
ビジネスインテリジェンス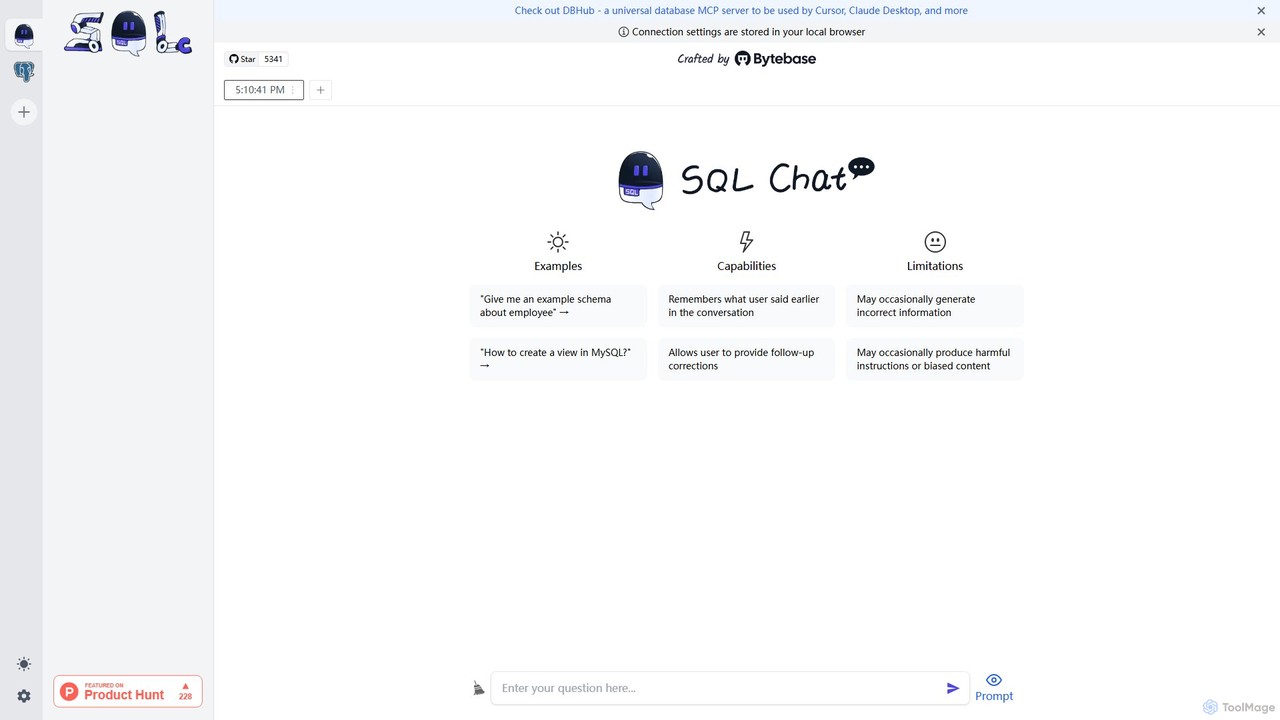
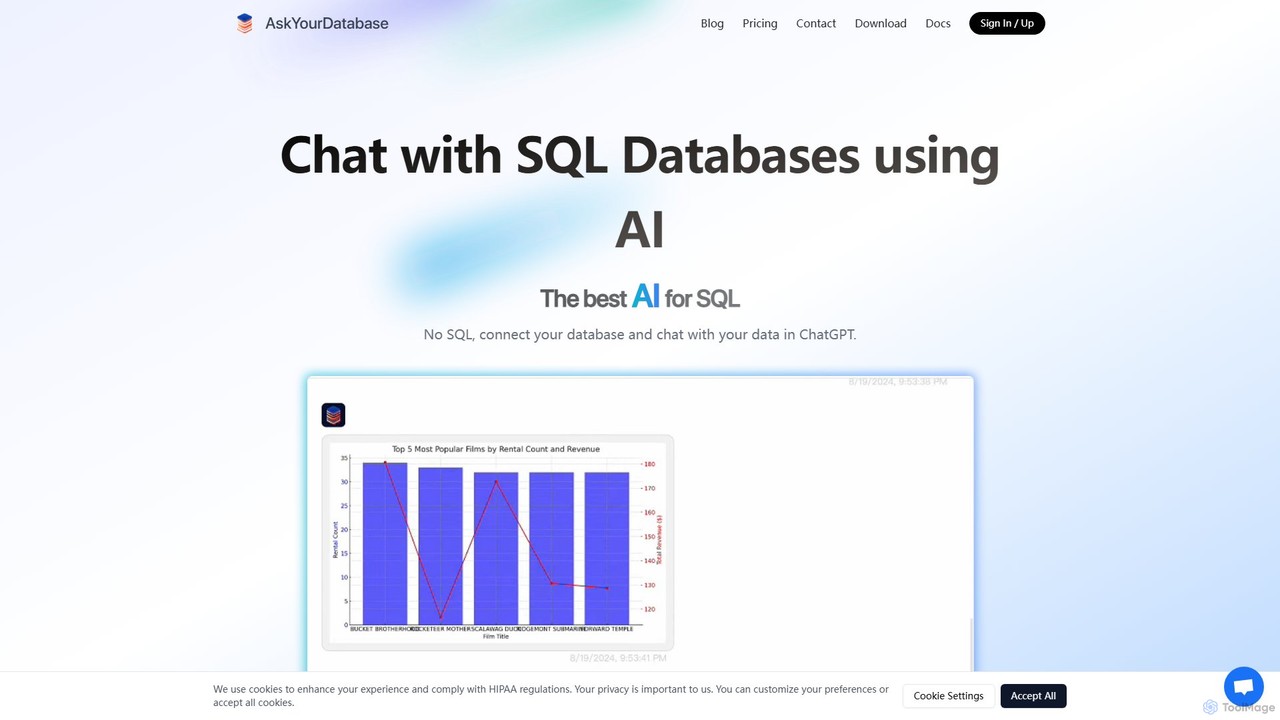
AskYourDatabaseは、自然言語を使ってデータベースと対話できる強力なAI SQLアシスタントです。SQLコードを一行も書かずに、データのクエリ、可視化の作成、インタラクティブなダッシュボードの構築が可能です。多様なデータベースをサポートし、デスクトップ版と埋め込み可能なチャットボット版を提供し、オンプレミス展開オプションでデータセキュリティを最優先します。
データ分析
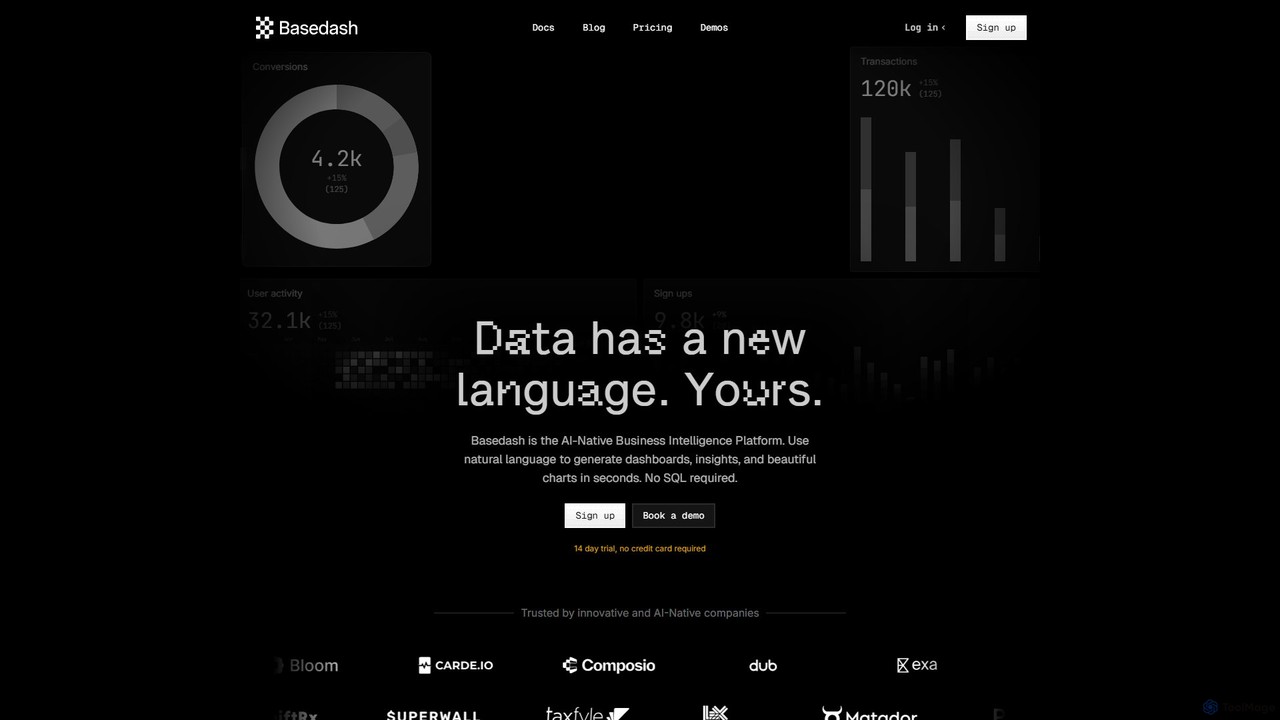
Basedashは、チームが自然言語を使ってデータと対話できるAIネイティブのビジネスインテリジェンスプラットフォームです。SQLコードを一切書かずに、数秒で美しいダッシュボード、チャート、インサイトを生成します。データソースを接続し、質問するだけで答えを得られます。
ビジネスインテリジェンス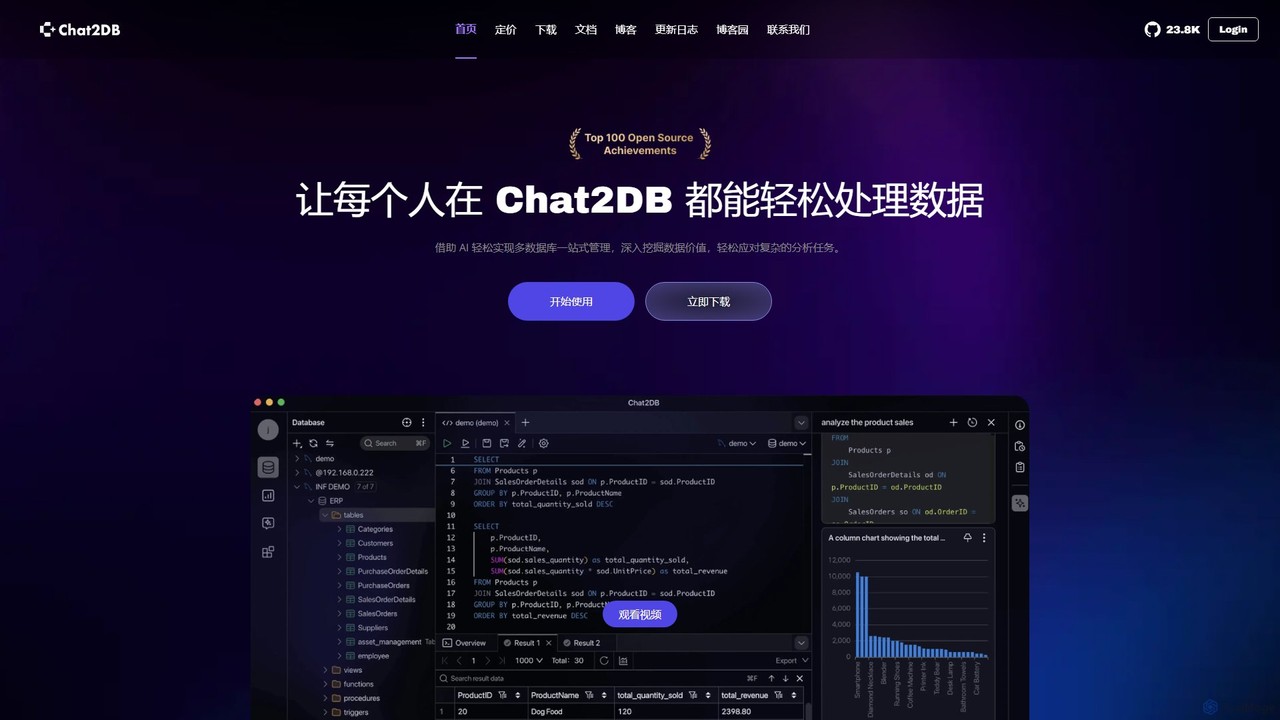
Chat2DBは、AIを搭載したインテリジェントなオールインワン・データベース管理ツールです。MySQL、PostgreSQL、MongoDBを含む30以上のデータベースをサポートし、ユーザーが自然言語を使用してデータを管理、クエリ、分析できるようにします。AI SQL生成、データ可視化、ノーコードのダッシュボード作成、堅牢なセキュリティプロトコルなどの機能を備え、開発者、アナリスト、ビジネスユーザーに最適です。
ビジネスインテリジェンス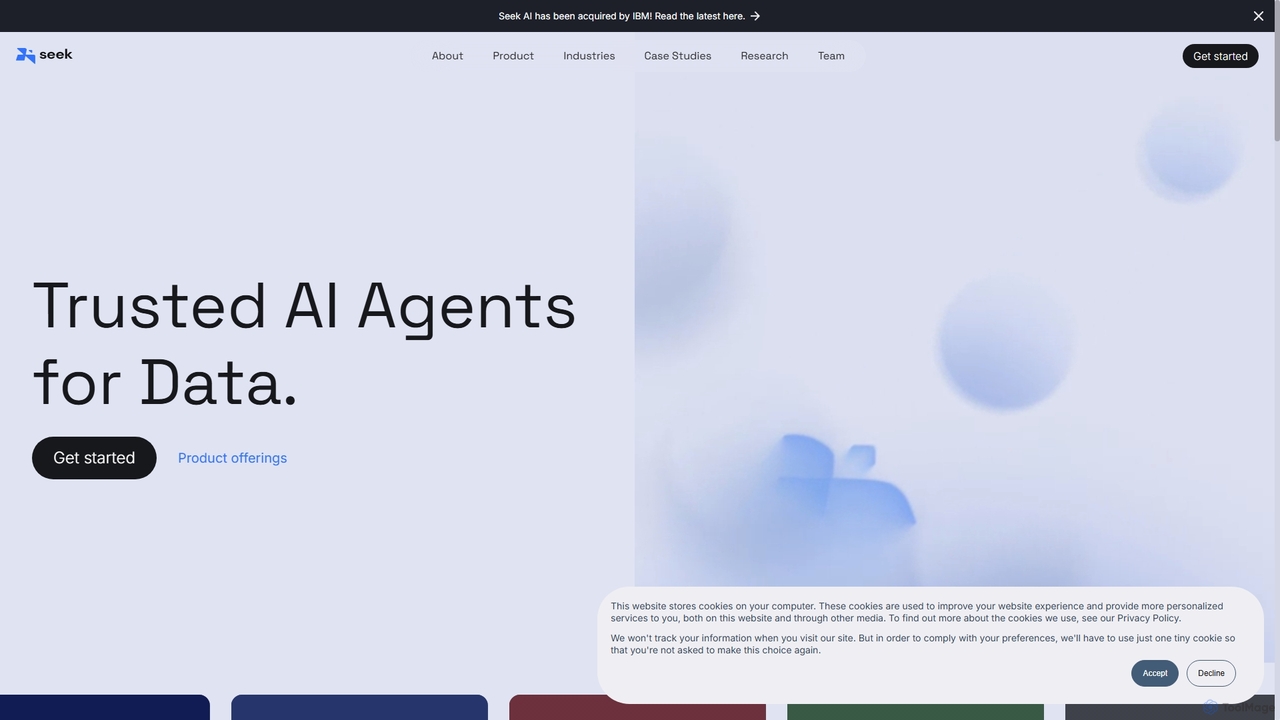
Seek AIは、データ分析のための生成AIプラットフォームで、ユーザーが自然言語を使用してデータベースにクエリを実行し、レポートを生成し、可視化を作成できるようにします。テキストからSQLへの変換プロセスを自動化し、技術者でないユーザーでもデータにアクセスしやすくし、データチームのインサイト発見を加速させます。
ビジネスインテリジェンス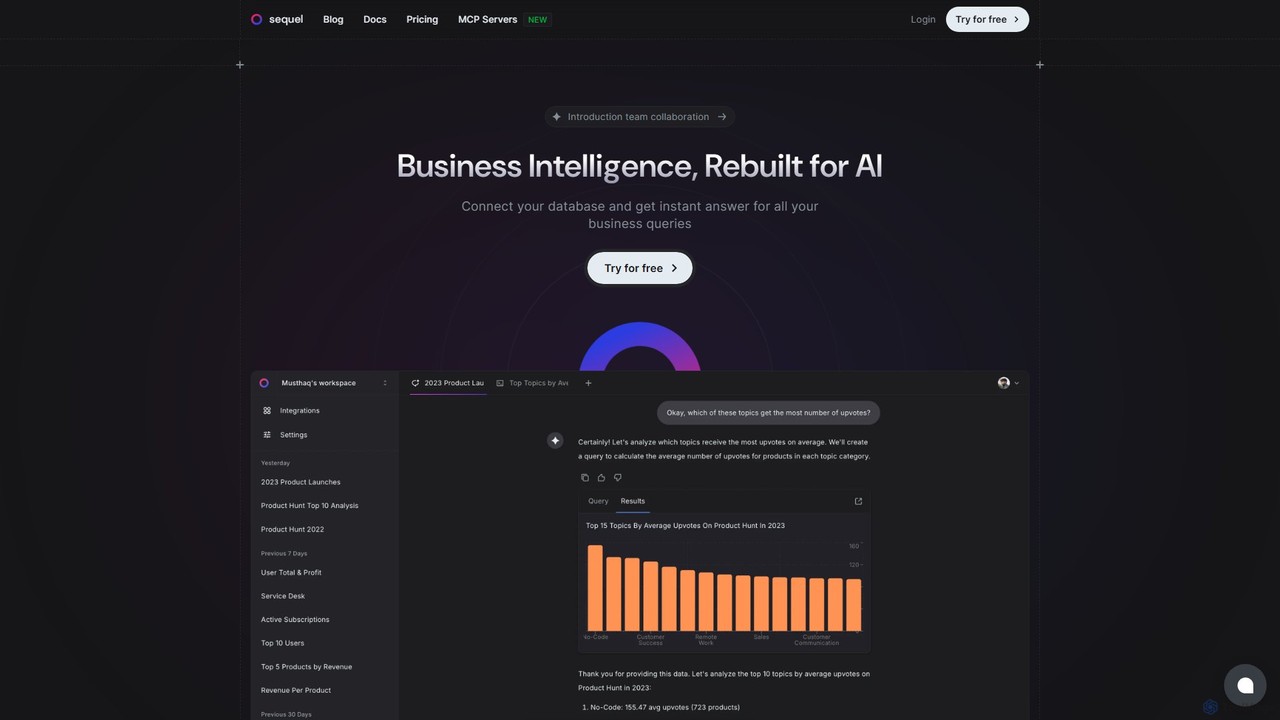
Sequelは、自然言語を使ってデータベースと対話できるAI搭載のビジネスインテリジェンスプラットフォームです。データを接続し、平易な言葉で質問するだけで、SQLコードを一行も書かずに即座にレポート、可視化、インサイトを得ることができます。
ビジネスインテリジェンス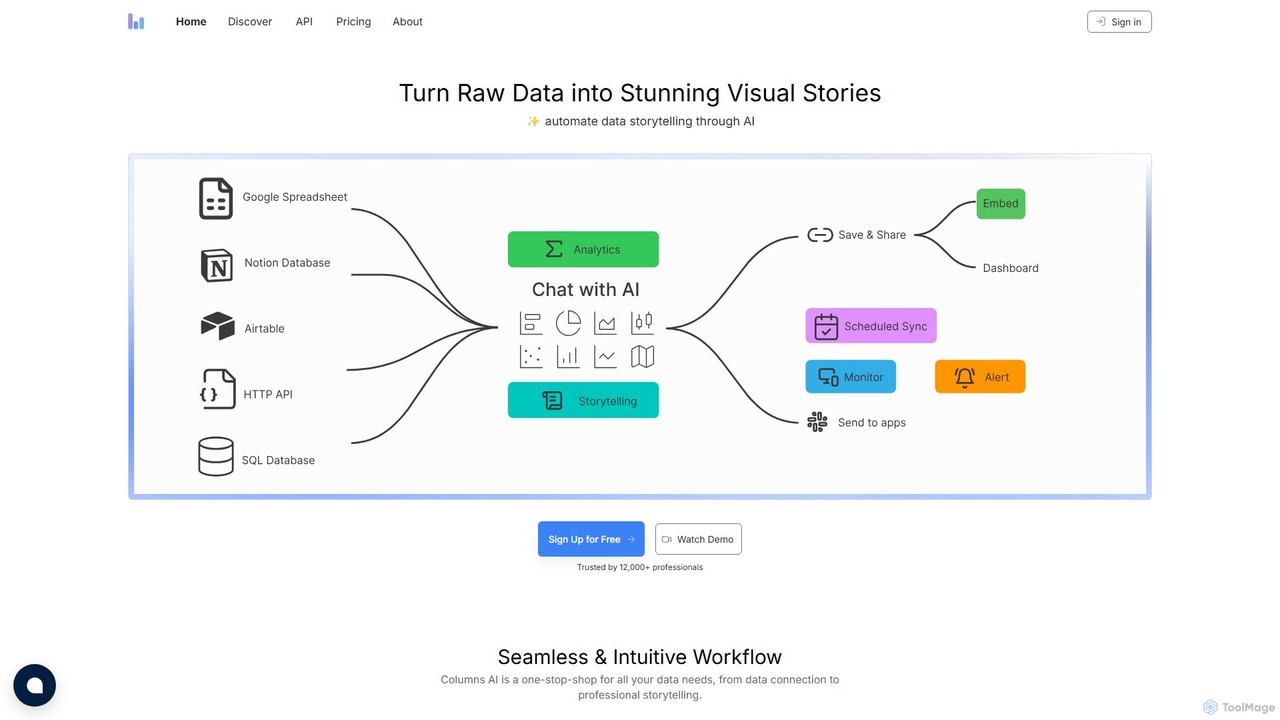
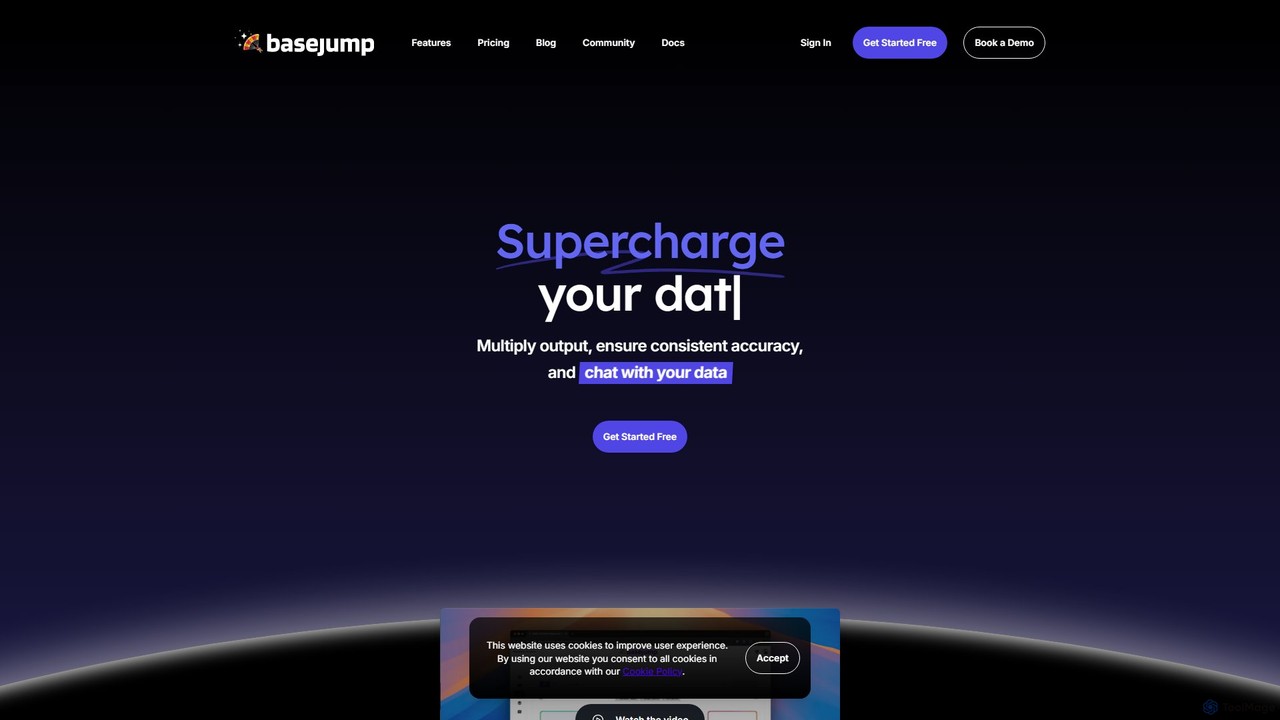
Basejump AIは、チームが自然言語を使用してデータベースを照会し、インサイトを得ることを可能にする対話型AIデータ分析プラットフォームです。日常的な質問をSQLクエリに変換し、複雑なダッシュボードやコーディングスキルなしで、迅速、正確、かつ監査可能なデータを提供します。
ビジネスインテリジェンス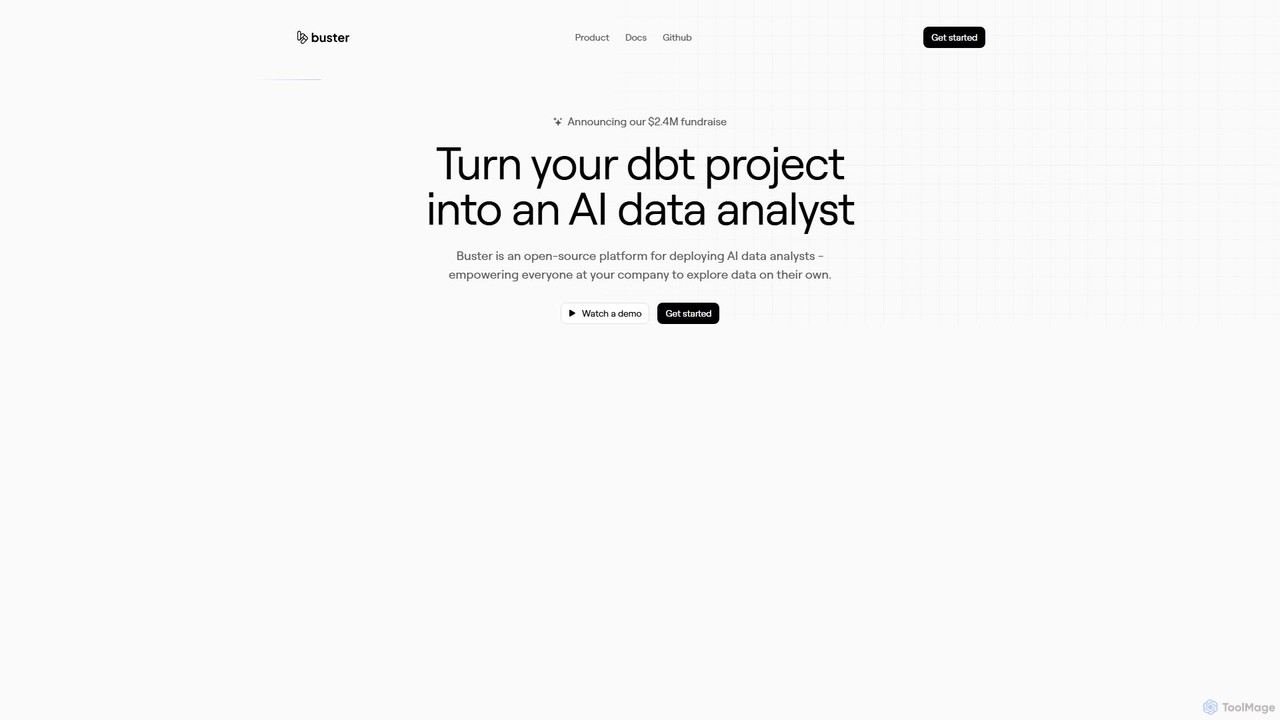
Busterは、社内の誰もが平易な英語でデータを探索できるようにする、オープンソースのAIデータアナリストプラットフォームです。dbtプロジェクトと統合し、ビジネスユーザーがコードを書かずに質問したり、可視化を生成したり、ダッシュボードを構築したりできるようにすることで、データチームをアドホックなリクエストから解放します。
ビジネスインテリジェンス