DiscoveryOutcomes
市場情報 · 4.4K 月間訪問数
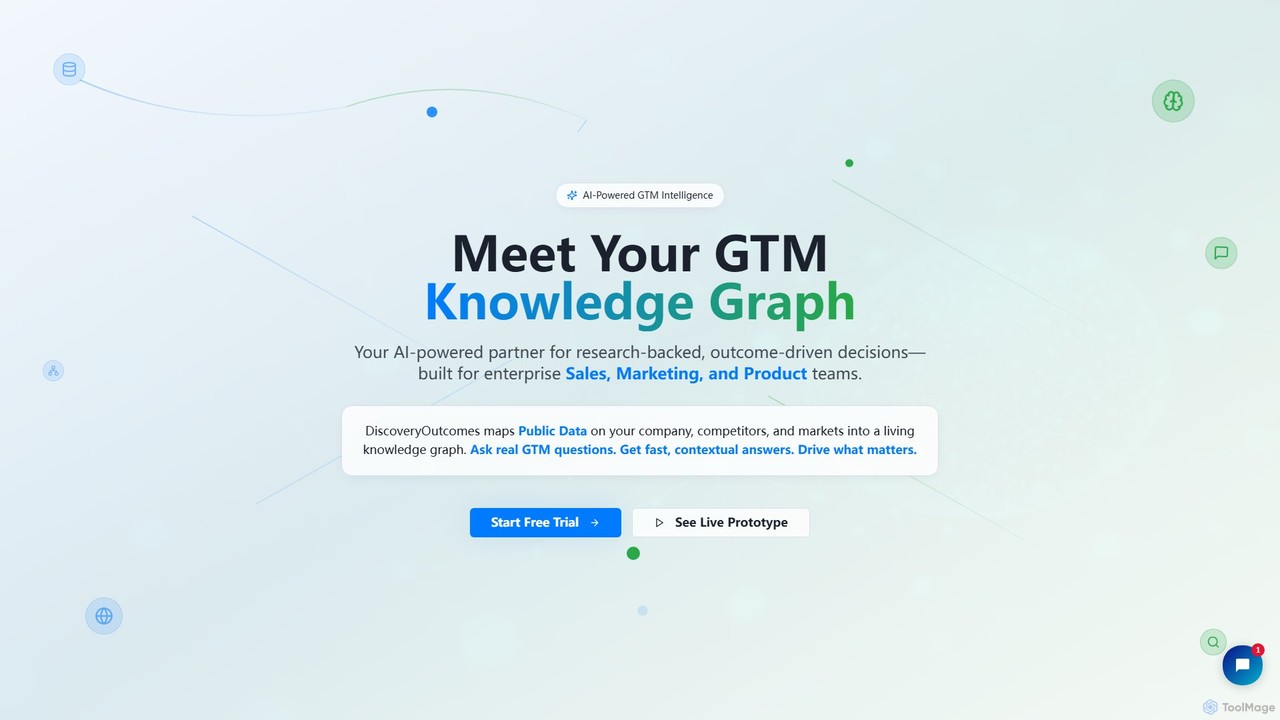
DiscoveryOutcomesは、公開データを動的なナレッジグラフに変換するAI搭載のGTM(市場投入)インテリジェンスプラットフォームです。企業の営業、マーケティング、製品チームに研究に基づいた文脈的な回答を提供し、成果主導の意思決定を促進し、競争優位性を獲得します。
DiscoveryOutcomesは、公開データを動的なナレッジグラフに変換するAI搭載のGTM(市場投入)インテリジェンスプラットフォームです。企業の営業、マーケティング、製品チームに研究に基づいた文脈的な回答を提供し、成果主導の意思決定を促進し、競争優位性を獲得します。
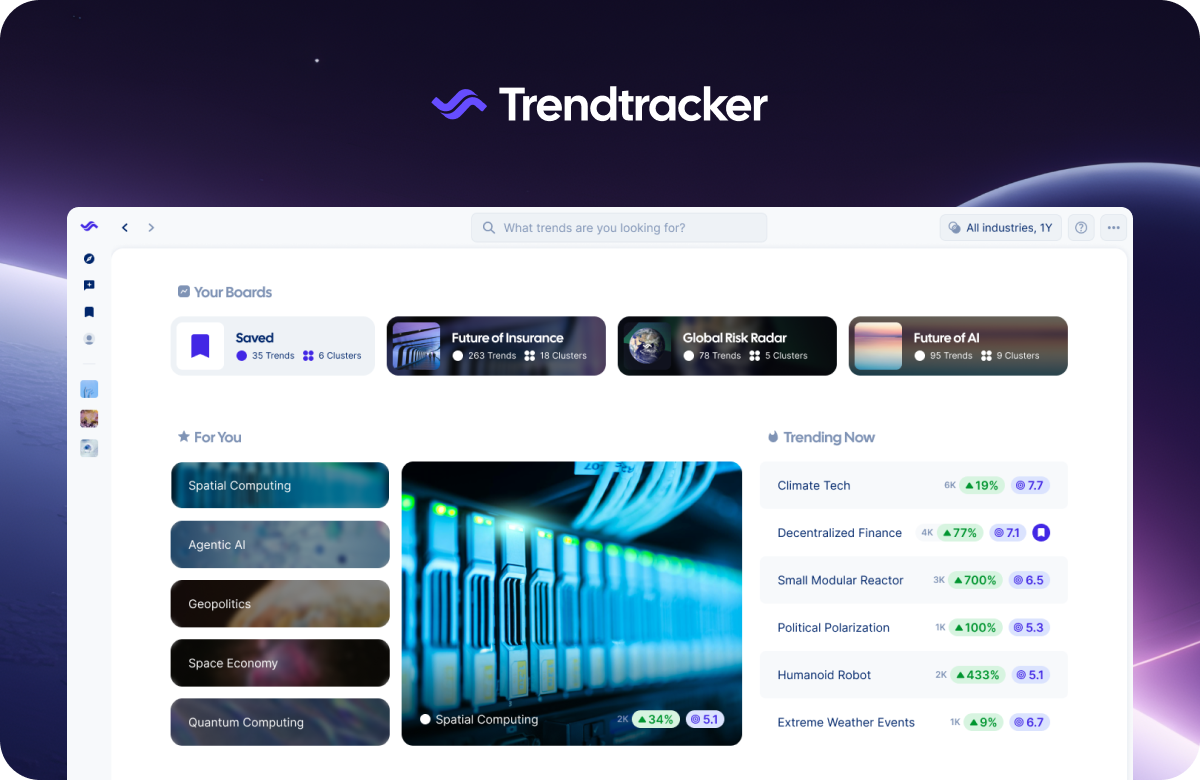
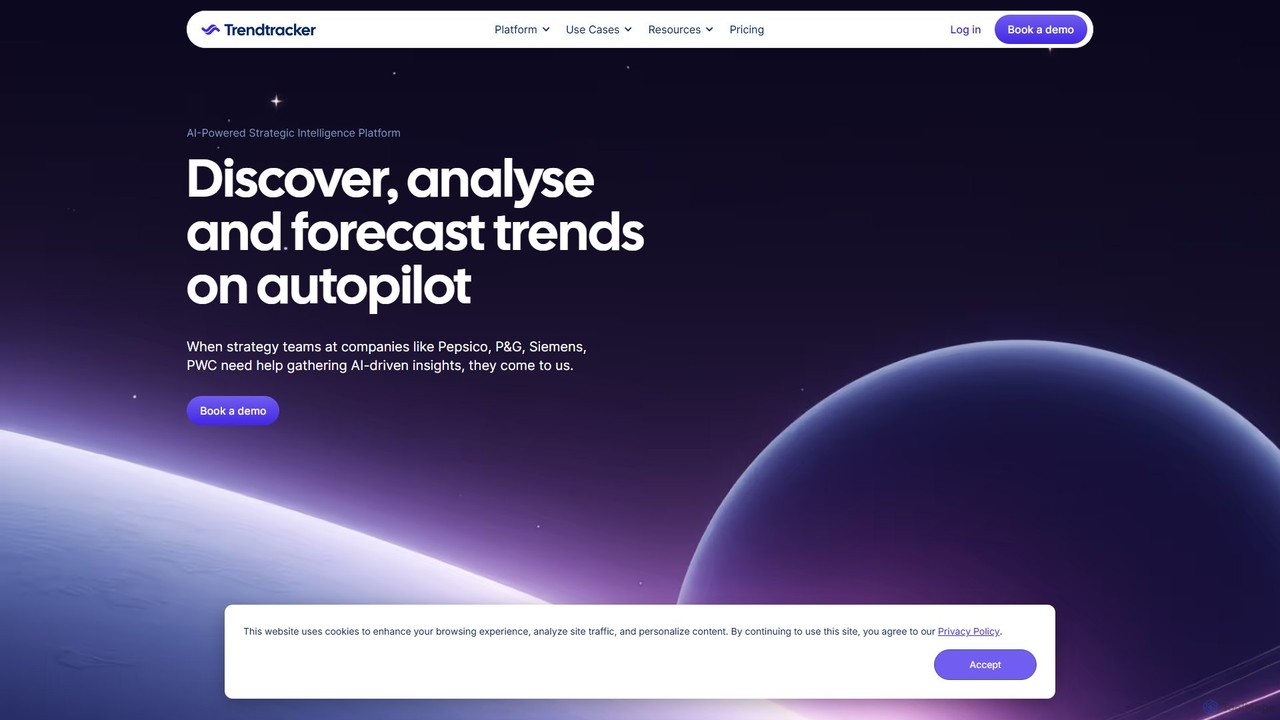
Trendtrackerは、企業が市場のトレンドを自動的に発見、分析、予測するために設計されたAI搭載の戦略的インテリジェンスプラットフォームです。主要企業の戦略チームが破壊的変化を予測し、データに基づいた意思決定を行い、リアルタイムでパーソナライズされたインサイトを通じて競争優位性を維持するのを支援します。
DiscoveryOutcomesは、公開データを動的なナレッジグラフに変換するAI搭載のGTM(市場投入)インテリジェンスプラットフォームです。企業の営業、マーケティング、製品チームに研究に基づいた文脈的な回答を提供し、成果主導の意思決定を促進し、競争優位性を獲得します。
Trendtrackerは、企業が市場のトレンドを自動的に発見、分析、予測するために設計されたAI搭載の戦略的インテリジェンスプラットフォームです。主要企業の戦略チームが破壊的変化を予測し、データに基づいた意思決定を行い、リアルタイムでパーソナライズされたインサイトを通じて競争優位性を維持するのを支援します。
| Feature | DiscoveryOutcomes | Trendtracker |
|---|---|---|
| 主要カテゴリー | 市場情報 | 市場情報 |
| 追加日 | 2025-08-05 | 2025-08-03 |
| 価格 | フリーミアム | 有料 |
| 公式サイト | discoveryoutcomes.com | www.trendtracker.ai |
| 製品タイプ | ウェブサイト | ウェブサイト |
| Performance data | ||
| ユーザー評価 | 未確認 | 未確認 |
| コメント | 0 | 0 |
| 月間訪問数 | 4.4K | 22.8K |
| 月間成長率 | 未確認 | 25.9% |
| お気に入り | 146 | 99 |
| Details | 詳細を見る | 詳細を見る |
Compare DiscoveryOutcomes and Trendtracker by monthly reach, traffic trend, visit depth, top regions, and acquisition sources.
In the DiscoveryOutcomes vs Trendtracker monthly traffic comparison, DiscoveryOutcomes currently shows 4.4K visits and Trendtracker shows 22.8K; Trendtracker has about 5.1 times the visible traffic of DiscoveryOutcomes, an absolute difference of about 18.4K visits. This reflects visible reach, not feature quality or paid users.
Only Trendtracker has complete third-party traffic details; DiscoveryOutcomes uses visits recorded inside ToolMage. These scopes cannot estimate market share directly, and on-site views should not be treated as the product’s total website traffic.
| Country/region | Percentage | Traffic |
|---|---|---|
| 🇺🇸United States | 36.17% | 8.3K |
| 🇮🇳India | 18.68% | 4.3K |
| 🇬🇧United Kingdom | 17.25% | 3.9K |
| 🇫🇷France | 16.56% | 3.8K |
| 🇹🇭Thailand | 11.34% | 2.6K |
This in-depth DiscoveryOutcomes vs Trendtracker comparison uses only the product records, taxonomy, audience, traffic, and community signals available on this page. DiscoveryOutcomes is primarily listed under “市場情報”, while Trendtracker is primarily listed under “市場情報”, so the first decision is whether your actual task matches their recorded scope.
The structured fields currently show these decision-relevant differences: Pricing (DiscoveryOutcomes: Freemium; Trendtracker: Paid); Monthly visits (DiscoveryOutcomes: 4.4K; Trendtracker: 22.8K); Favorites (DiscoveryOutcomes: 146; Trendtracker: 99); Website (DiscoveryOutcomes: discoveryoutcomes.com; Trendtracker: www.trendtracker.ai); Added (DiscoveryOutcomes: 2025-08-05; Trendtracker: 2025-08-03). These facts are more useful for selection than brand visibility alone.
In the DiscoveryOutcomes vs Trendtracker monthly traffic comparison, DiscoveryOutcomes currently shows 4.4K visits and Trendtracker shows 22.8K; Trendtracker has about 5.1 times the visible traffic of DiscoveryOutcomes, an absolute difference of about 18.4K visits. This reflects visible reach, not feature quality or paid users.
Only Trendtracker has complete third-party traffic details; DiscoveryOutcomes uses visits recorded inside ToolMage. These scopes cannot estimate market share directly, and on-site views should not be treated as the product’s total website traffic.
The current traffic scope is not sufficient for a reliable product ranking. Treat monthly visits as a market-interest signal, then decide using taxonomy, use cases, pricing, and a like-for-like trial rather than reading exposure as product capability.
DiscoveryOutcomes and Trendtracker currently overlap in shared categories: 市場情報、研究; shared tags: ビジネスインテリジェンス、競合情報、市場調査. This can place both on the same shortlist, but it does not prove equal implementation, depth, or cost.
DiscoveryOutcomes's unique categories/tags are 市場調査、競合分析、市場投入戦略、GTM、知識グラフ、プロダクトマーケティング、営業インテリジェンス; Trendtracker's are 戦略計画、リスク管理、データ視覚化、先見性、ホライズンスキャニング、トレンド分析. These unique fields are the strongest differentiators: validate the product whose recorded scope matches the task instead of following traffic alone.
DiscoveryOutcomes has no verified rating, 0 comments, 146 favorites, and 152 likes;Trendtracker has no verified rating, 0 comments, 99 favorites, and 126 likes。
Neither product has enough rating or comment samples for a credible reputation ranking.
Put DiscoveryOutcomes on the priority trial list when the task aligns with “市場情報” and especially 市場調査、競合分析、市場投入戦略、GTM、知識グラフ、プロダクトマーケティング. This follows recorded positioning and does not imply unlisted capabilities are absent.
DiscoveryOutcomes also currently records: pricing is freemium, product type is website, 4.4K on-site monthly views, no verified user rating. Verify any hard requirement around price, platform, or reach before trial, and do not let sparse review data substitute for testing.
Put Trendtracker on the priority trial list when the task aligns with “市場情報” and especially 戦略計画、リスク管理、データ視覚化、先見性、ホライズンスキャニング、トレンド分析. This follows recorded positioning and does not imply unlisted capabilities are absent.
Trendtracker also currently records: pricing is paid, product type is website, 22.8K verified monthly visits, no verified user rating. Verify any hard requirement around price, platform, or reach before trial, and do not let sparse review data substitute for testing.
The available data describes positioning, public visibility, and community signals, but it cannot prove output quality, speed, integration effort, privacy, or long-term cost in your workflow. Before deciding, run the same representative tasks in DiscoveryOutcomes and Trendtracker, then record completion time, accuracy, manual corrections, and the real paid threshold. A like-for-like trial turns this comparison into a defensible adoption decision.
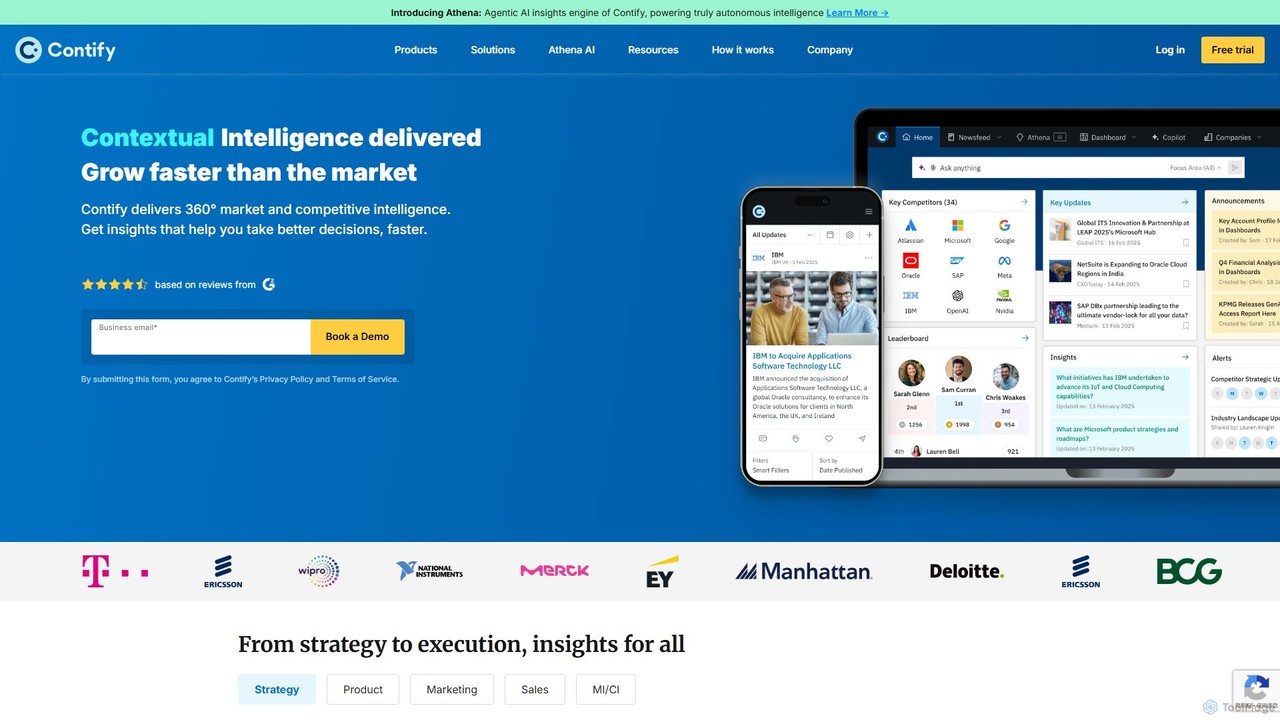

RivalSenseは、創業者やビジネスリーダー向けに設計されたAI搭載の競合インテリジェンスツールです。ウェブサイト、ソーシャルメディア、求人情報、ニュースサイトなど80以上のデータソースを追跡し、競合他社のモニタリングを自動化します。ユーザーは、製品の発売、採用の変更、パートナーシップ、財務ニュースなどを網羅した、厳選された実用的なインサイトを週次のメールまたはSlackのブリーフィングで受け取ることができます。これにより、手動での追跡に比べて大幅な時間を節約し、企業が競争で優位に立つことを支援します。
競合情報
asymmetricdataは、複雑なデータセットから隠れたインサイトと競争優位性を発見するために設計されたAI搭載のビジネスインテリジェンスプラットフォームです。高度なアルゴリズムを活用して市場動向、顧客行動、競合戦略を分析し、企業がより賢明でデータに基づいた意思決定を行い、大きな優位性を獲得するための実用的なインテリジェンスを提供します。
ビジネスインテリジェンス
Compete.Newsは、競合他社の活動を追跡する自動化された競合インテリジェンスツールです。AIを使用して毎日ニュースソースをスキャンし、製品の発売、資金調達、パートナーシップなどの主要なイベントに関する要約ブリーフを提供し、重要な動きを見逃さないようにします。
競合情報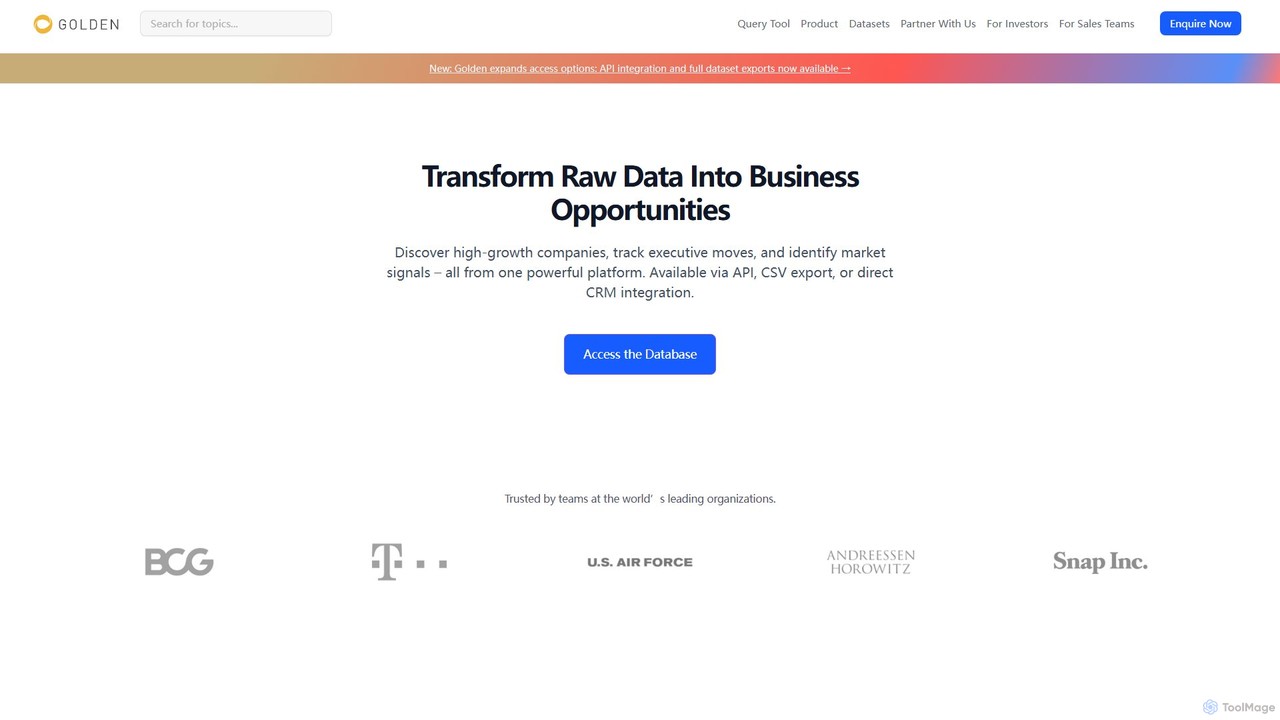
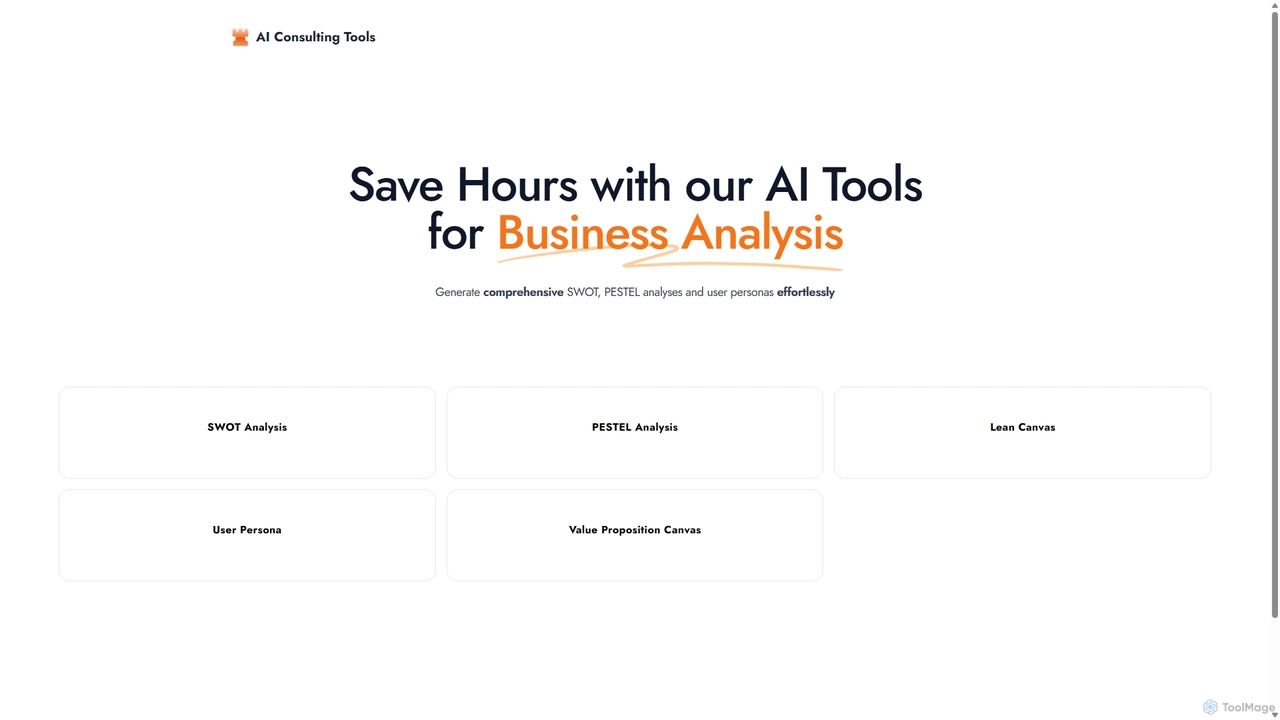
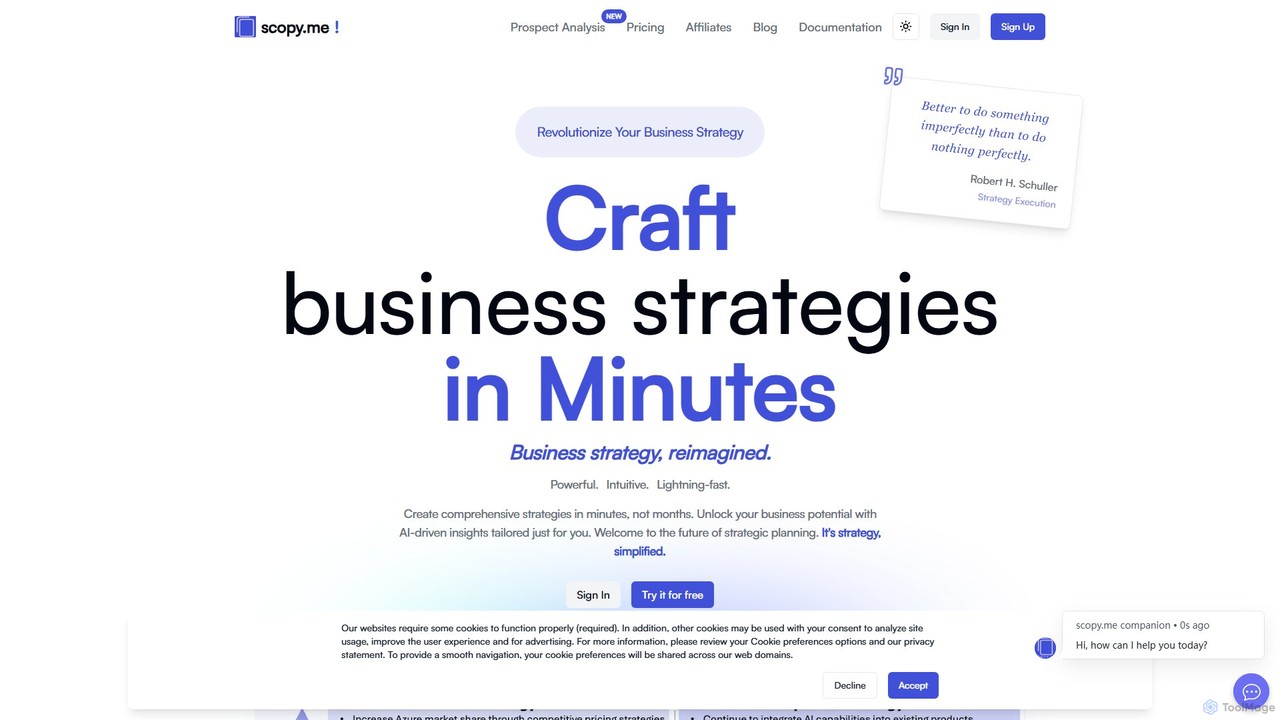
ビジネスアナリスト、コンサルタント、戦略家向けに設計されたAI搭載プラットフォーム。SWOT、PESTEL、ユーザーペルソナなどの包括的な戦略分析ドキュメントの作成を自動化します。企業や製品に関する基本情報を入力するだけで、ツールが数分で詳細かつ構造化されたレポートを生成し、手作業によるリサーチと執筆の時間を何時間も節約します。
戦略計画
MarketMindは、リアルタイムの競合分析、トレンド予測、消費者感情のインサイトを提供するAI搭載の市場インテリジェンスプラットフォームです。多様なソースからの市場データの収集と分析を自動化し、複雑な情報を実行可能な戦略に変えることで、企業のデータに基づいた意思決定を支援します。
競合情報
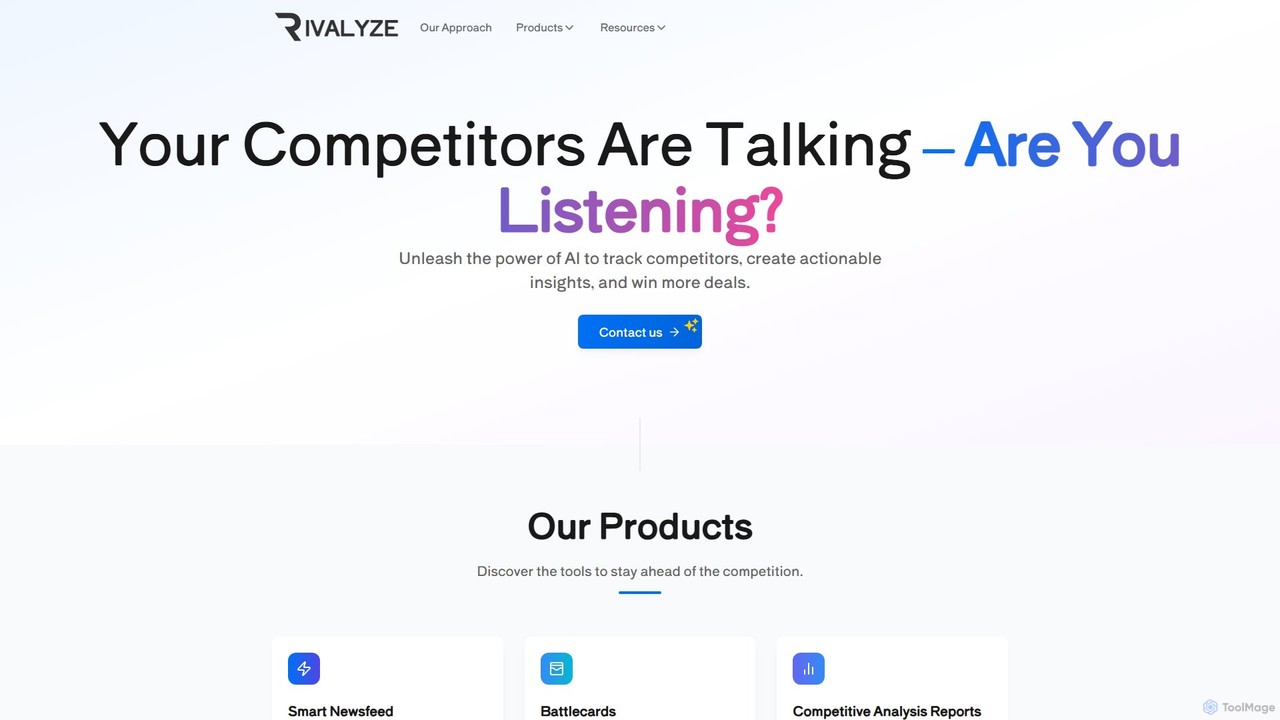
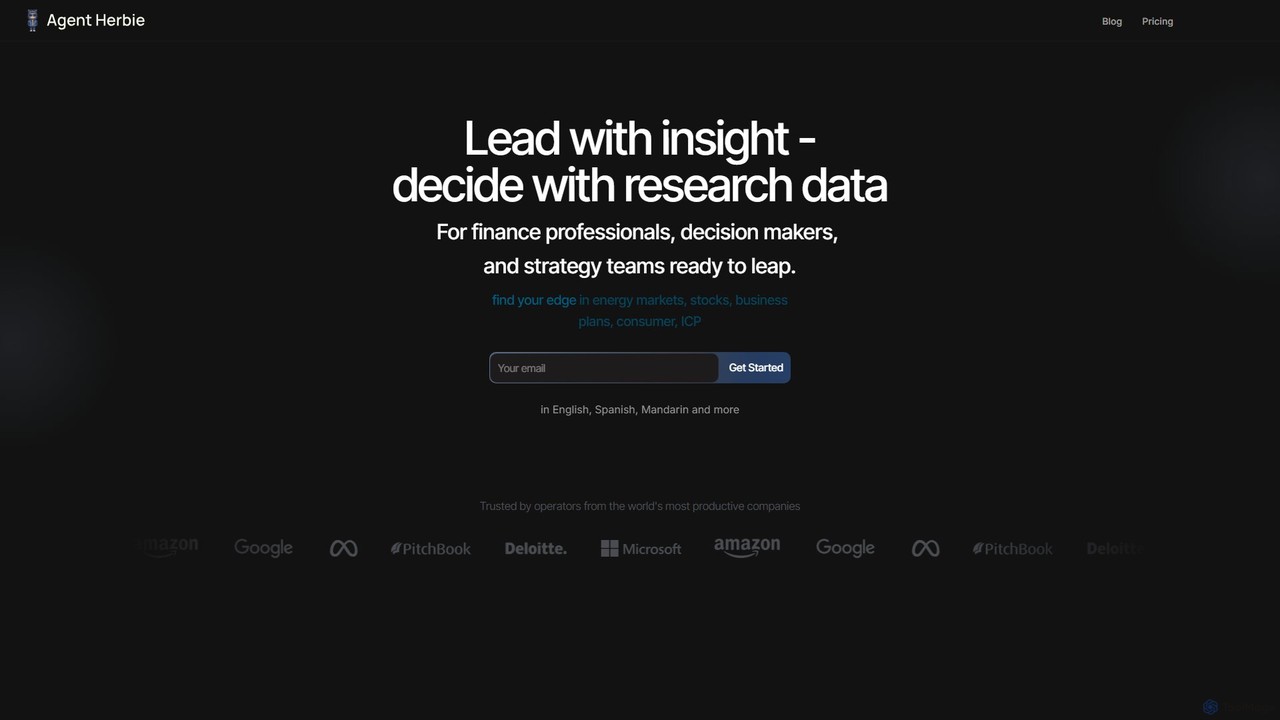
Agent Herbieは、創業者、アナリスト、経営者向けの専門AIリサーチエージェントです。ウェブ、動画、内部データソースを統合し、市場調査、競合分析、データ駆動型のレポート作成を自動化します。一般的なAIチャットボットよりも詳細で実用的な洞察を提供し、戦略的なビジネス意思決定を支援します。多言語に対応し、プレミアムデータブローカーとも連携します。
市場調査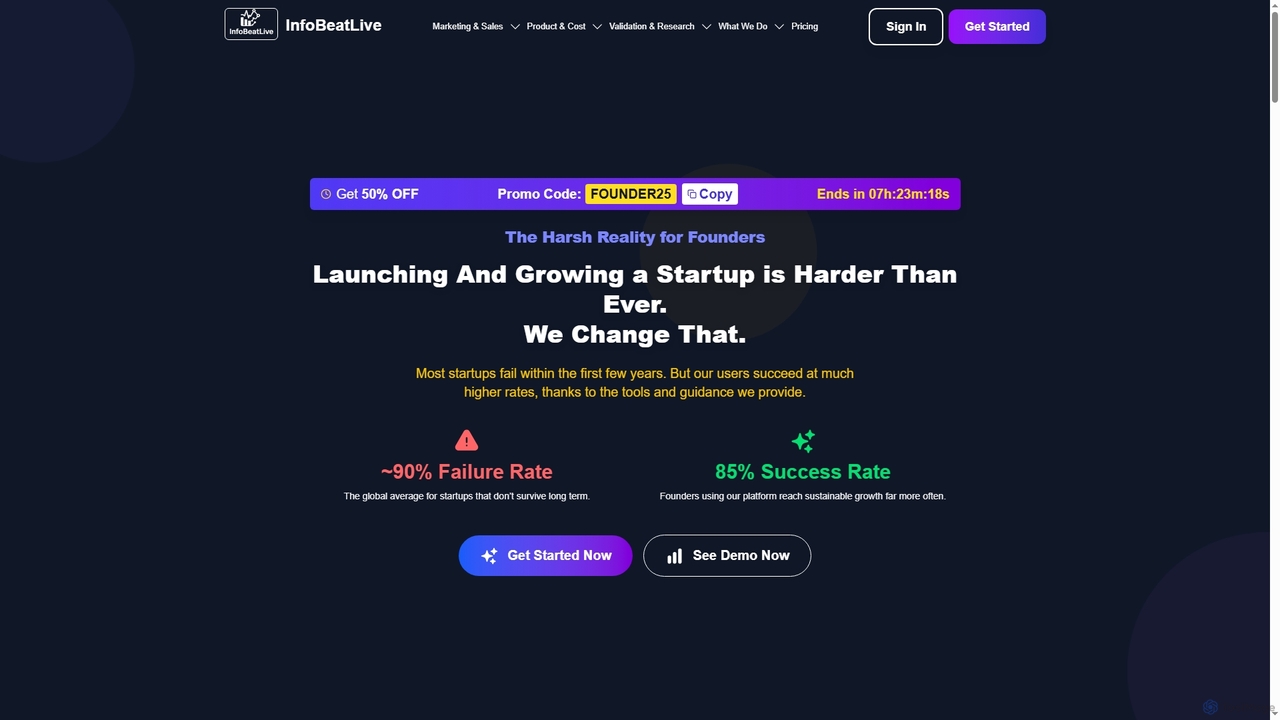
InfoBeatLiveは、スタートアップの成長を加速させるために創業者向けに設計されたAI搭載プラットフォームです。市場検証、戦略計画、マーケティング最適化、販売改善、財務管理のための包括的なツールを提供し、企業が持続可能な成功を達成し、競合他社を凌駕するのを支援します。
スタートアップの成長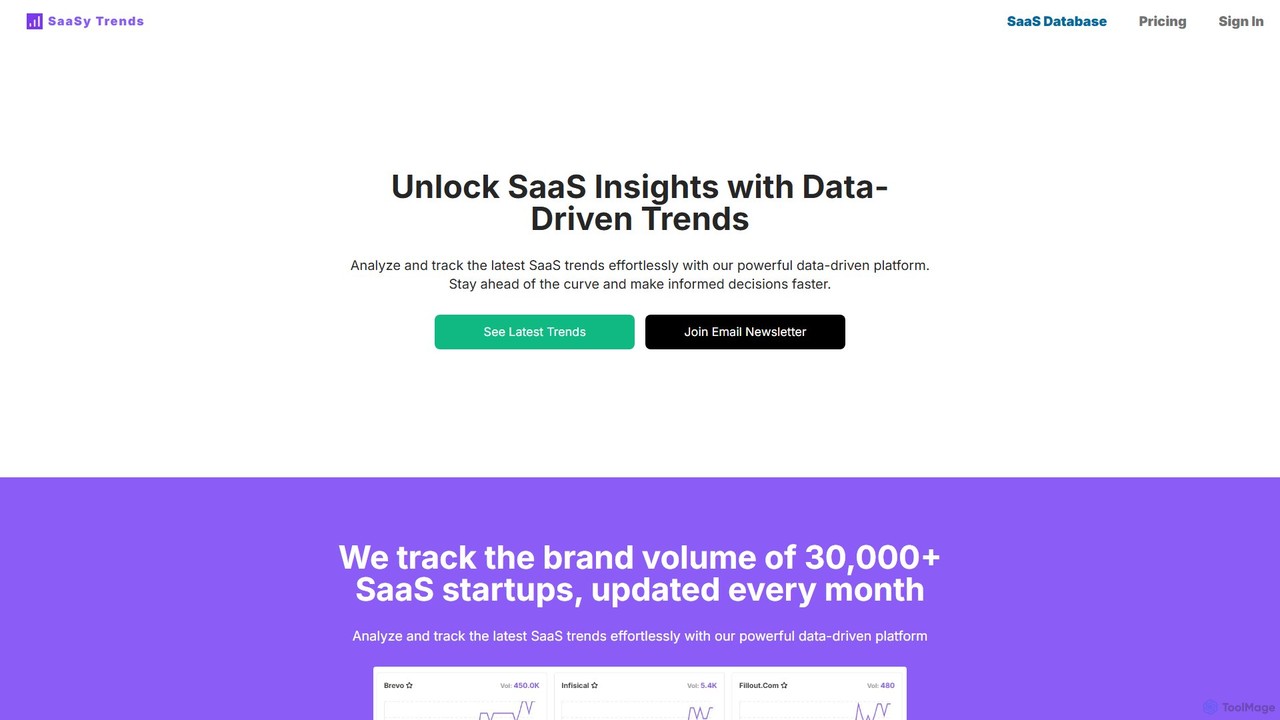
SaaS業界向けのデータ駆動型市場インテリジェンスプラットフォーム。30,000社以上のSaaSスタートアップのブランド成長を追跡し、起業家、マーケター、投資家が新たなトレンドを特定し、競合他社を分析し、新しいビジネス機会を発見するのを支援します。
市場情報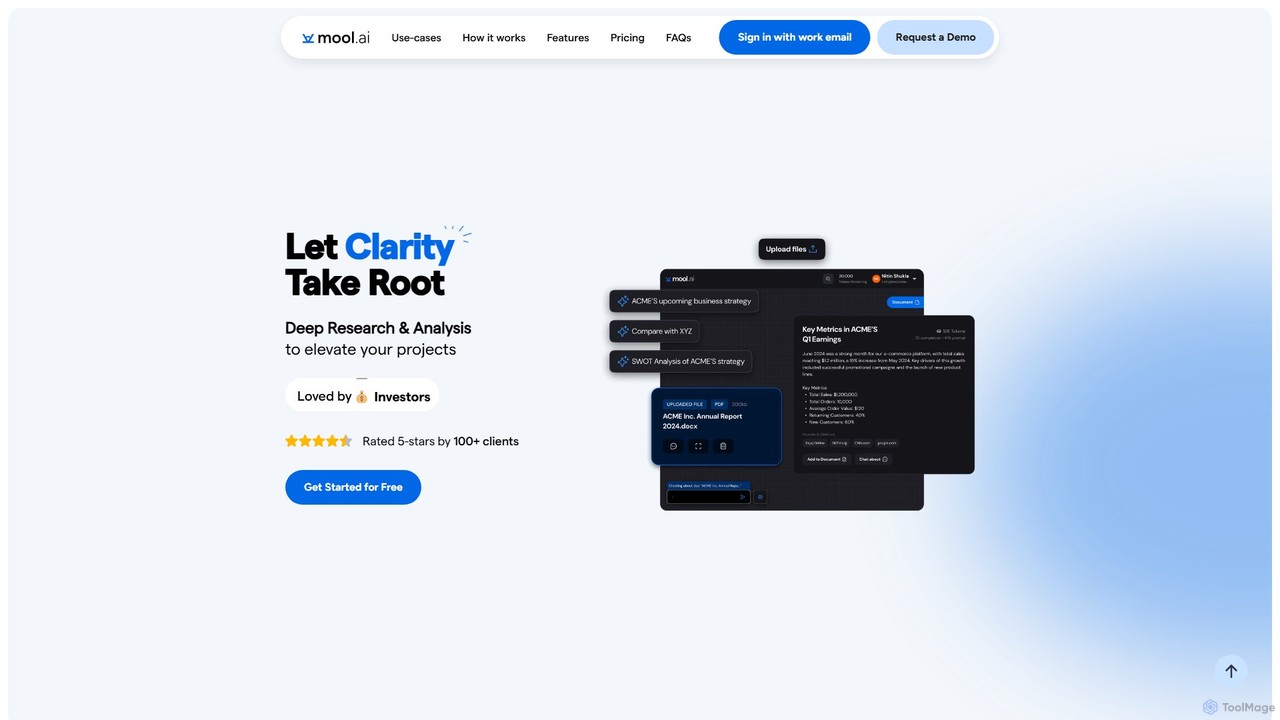
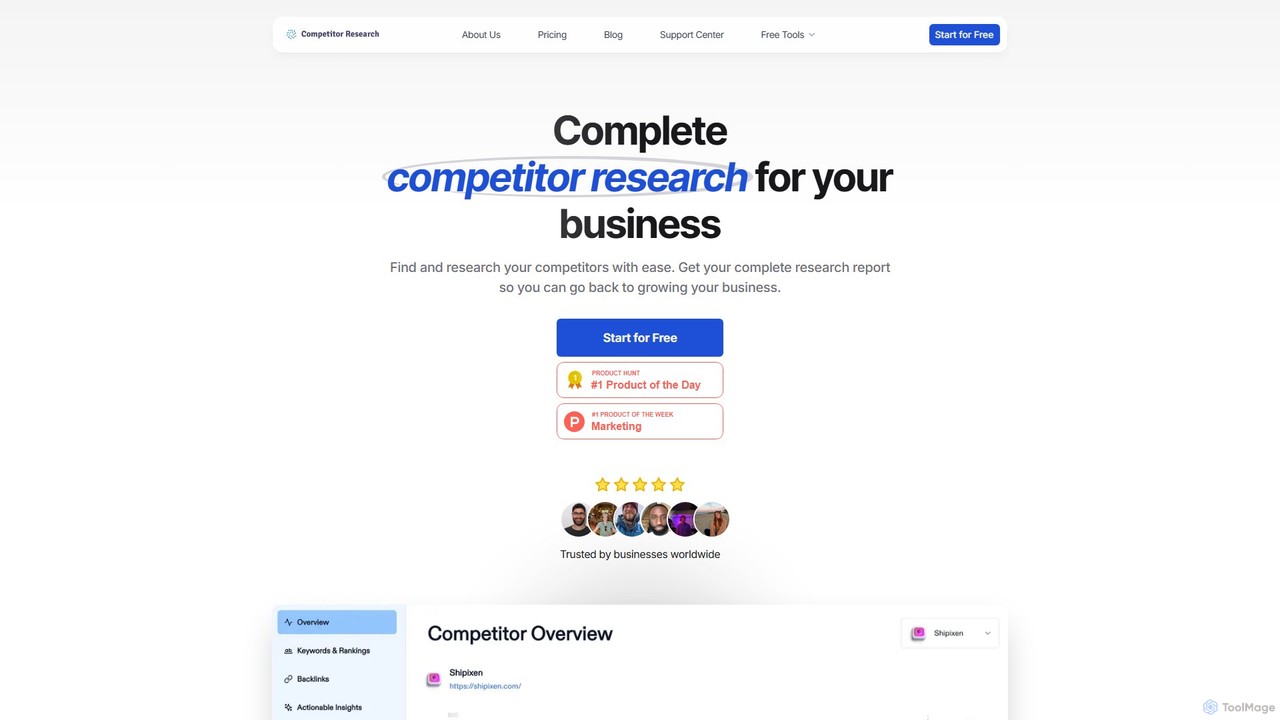
AIを活用した競合分析ツールで、マーケティング戦略、SEO、製品、価格設定に関する包括的なレポートを自動生成します。直接的、間接的、潜在的な競合他社を特定し、ビジネス成長のための実用的なインサイトを提供し、数百時間の手作業を削減します。
市場調査