Gaoding Design
グラフィックデザイン · 2.7M 月間訪問数
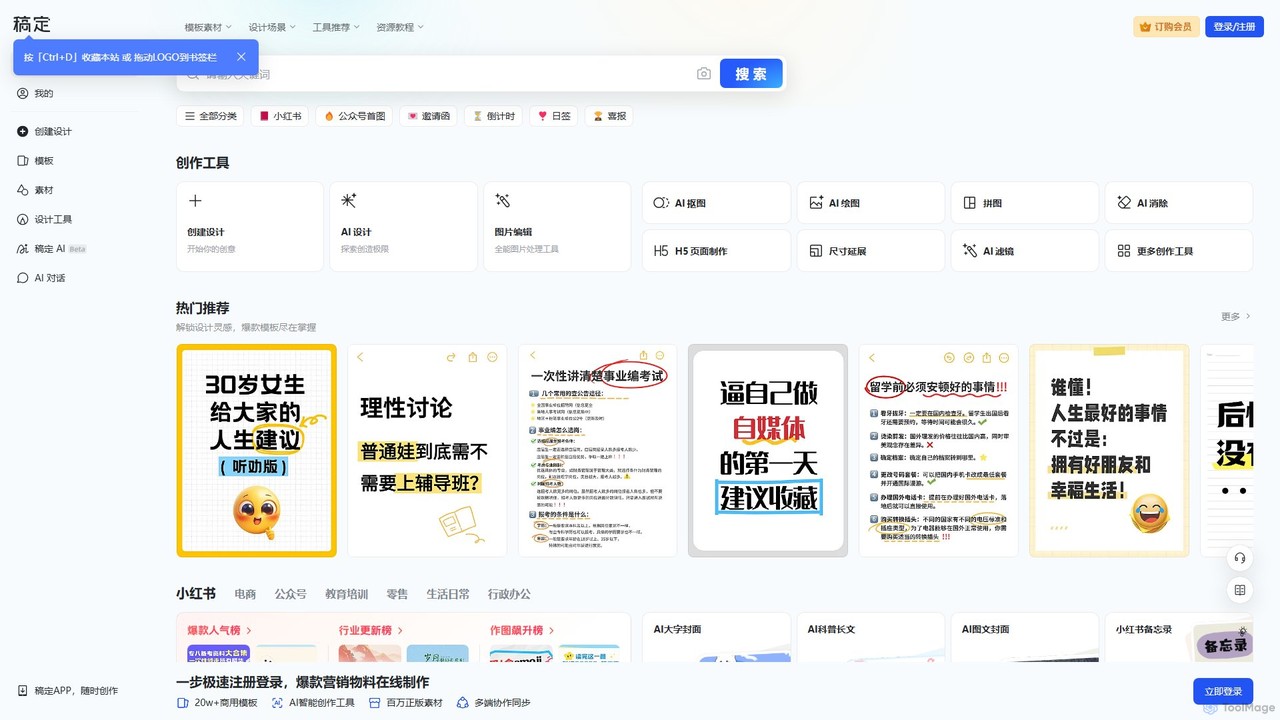
Gaoding Designは、AIを搭載したオールインワンのオンラインデザインプラットフォームです。豊富なテンプレートライブラリ、画像・動画編集用のAI駆動ツール、コンテンツ生成、スマートなデザイン自動化機能を提供します。マーケター、コンテンツ制作者、企業に最適で、共同作業ワークフローによりプロフェッショナルなマーケティング資料、SNS投稿、プレゼンテーションの作成を簡素化します。
Gaoding Designは、AIを搭載したオールインワンのオンラインデザインプラットフォームです。豊富なテンプレートライブラリ、画像・動画編集用のAI駆動ツール、コンテンツ生成、スマートなデザイン自動化機能を提供します。マーケター、コンテンツ制作者、企業に最適で、共同作業ワークフローによりプロフェッショナルなマーケティング資料、SNS投稿、プレゼンテーションの作成を簡素化します。
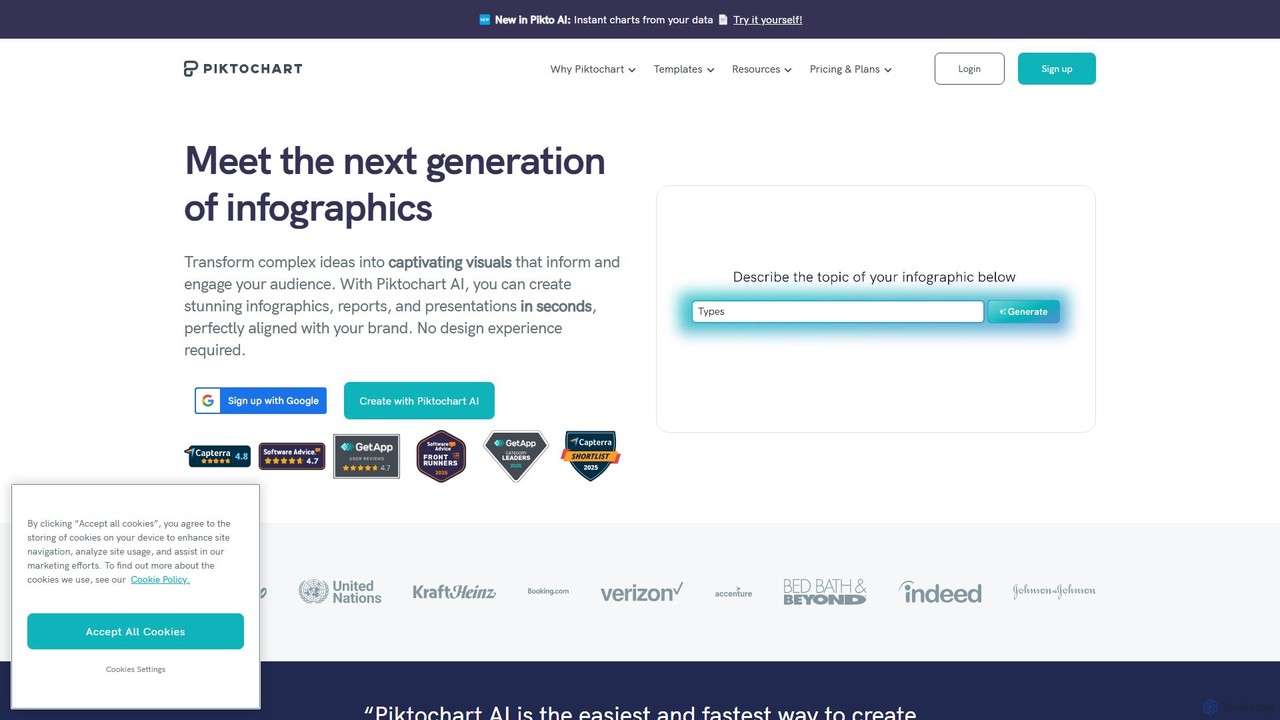
Piktochartは、AIで強化されたオールインワンのビジュアルコミュニケーションツールで、プロフェッショナルなインフォグラフィック、プレゼンテーション、レポート、ソーシャルメディアグラフィックを作成します。データ可視化とデザインを簡素化し、ユーザーがテキストやデータを魅力的なビジュアルに簡単に変換できるようにし、ブランドの一貫性とチームコラボレーション機能を提供します。
Gaoding Designは、AIを搭載したオールインワンのオンラインデザインプラットフォームです。豊富なテンプレートライブラリ、画像・動画編集用のAI駆動ツール、コンテンツ生成、スマートなデザイン自動化機能を提供します。マーケター、コンテンツ制作者、企業に最適で、共同作業ワークフローによりプロフェッショナルなマーケティング資料、SNS投稿、プレゼンテーションの作成を簡素化します。
Piktochartは、AIで強化されたオールインワンのビジュアルコミュニケーションツールで、プロフェッショナルなインフォグラフィック、プレゼンテーション、レポート、ソーシャルメディアグラフィックを作成します。データ可視化とデザインを簡素化し、ユーザーがテキストやデータを魅力的なビジュアルに簡単に変換できるようにし、ブランドの一貫性とチームコラボレーション機能を提供します。
| Feature | Gaoding Design | Piktochart |
|---|---|---|
| 主要カテゴリー | グラフィックデザイン | データの可視化 |
| 追加日 | 2025-08-10 | 2025-08-09 |
| 価格 | フリーミアム | フリーミアム |
| 公式サイト | www.gaoding.com | piktochart.com |
| 製品タイプ | ウェブサイト | ウェブサイト |
| Performance data | ||
| ユーザー評価 | 未確認 | 未確認 |
| コメント | 0 | 0 |
| 月間訪問数 | 2.7M | 919.7K |
| 月間成長率 | 0.1% | 4.7% |
| お気に入り | 108 | 161 |
| Details | 詳細を見る | 詳細を見る |
Compare Gaoding Design and Piktochart by monthly reach, traffic trend, visit depth, top regions, and acquisition sources.
In the Gaoding Design vs Piktochart monthly traffic comparison, Gaoding Design currently shows 2.7M visits and Piktochart shows 919.7K; Gaoding Design has about 2.9 times the visible traffic of Piktochart, an absolute difference of about 1.8M visits. This reflects visible reach, not feature quality or paid users.
Both tools provide verified traffic details, so monthly trends, visit depth, regions, and acquisition sources can be compared on the same basis.
| Country/region | Percentage | Traffic |
|---|---|---|
| 🇨🇳China | 94.33% | 2.5M |
| 🇭🇰Hong Kong | 1.55% | 41.6K |
| 🇺🇸United States | 1.53% | 41.1K |
| 🇸🇬Singapore | 1.36% | 36.5K |
| 🇲🇾Malaysia | 1.23% | 33K |
| Source type | Percentage | Traffic |
|---|---|---|
| ダイレクト | 71.18% | 1.9M |
| 参照元 | 28.82% | 773.9K |
| Country/region | Percentage | Traffic |
|---|---|---|
| 🇺🇸United States | 36.2% | 332.9K |
| 🇮🇳India | 19.05% | 175.2K |
| 🇲🇽Mexico | 17.13% | 157.5K |
| 🇨🇴Colombia | 15.31% | 140.8K |
| 🇧🇷Brazil | 12.31% | 113.2K |
| Source type | Percentage | Traffic |
|---|---|---|
| ダイレクト | 84.6% | 778.1K |
| 参照元 | 12.61% | 116K |
| Eメール | 2.79% | 25.7K |
This in-depth Gaoding Design vs Piktochart comparison uses only the product records, taxonomy, audience, traffic, and community signals available on this page. Gaoding Design is primarily listed under “グラフィックデザイン”, while Piktochart is primarily listed under “データの可視化”, so the first decision is whether your actual task matches their recorded scope.
The structured fields currently show these decision-relevant differences: Primary category (Gaoding Design: グラフィックデザイン; Piktochart: データの可視化); Monthly visits (Gaoding Design: 2.7M; Piktochart: 919.7K); Monthly growth (Gaoding Design: 0.1%; Piktochart: 4.7%); Favorites (Gaoding Design: 108; Piktochart: 161); Website (Gaoding Design: www.gaoding.com; Piktochart: piktochart.com). These facts are more useful for selection than brand visibility alone.
In the Gaoding Design vs Piktochart monthly traffic comparison, Gaoding Design currently shows 2.7M visits and Piktochart shows 919.7K; Gaoding Design has about 2.9 times the visible traffic of Piktochart, an absolute difference of about 1.8M visits. This reflects visible reach, not feature quality or paid users.
Both tools provide verified traffic details, so monthly trends, visit depth, regions, and acquisition sources can be compared on the same basis.
If public market visibility is an important first-pass criterion, investigate Gaoding Design first. The final choice should still follow taxonomy, use case, and a real trial because higher traffic does not prove broader capabilities or better workflow fit.
Gaoding Design and Piktochart currently overlap in shared categories: ソーシャルメディア、プレゼンテーション; shared tags: AIデザイン. This can place both on the same shortlist, but it does not prove equal implementation, depth, or cost.
Gaoding Design's unique categories/tags are グラフィックデザイン、ビデオ編集、背景除去、コラボレーション、コンテンツ作成、画像エディター、マーケティング資料、プレゼンテーション作成; Piktochart's are データの可視化、グラフィック、ブランドキット、チャートメーカー、データ視覚化、フローチャート、インフォグラフィックメーカー、プレゼンテーション. These unique fields are the strongest differentiators: validate the product whose recorded scope matches the task instead of following traffic alone.
Gaoding Design has no verified rating, 0 comments, 108 favorites, and 113 likes;Piktochart has no verified rating, 0 comments, 161 favorites, and 150 likes。
Neither product has enough rating or comment samples for a credible reputation ranking.
Put Gaoding Design on the priority trial list when the task aligns with “グラフィックデザイン” and especially グラフィックデザイン、ビデオ編集、背景除去、コラボレーション、コンテンツ作成、画像エディター. This follows recorded positioning and does not imply unlisted capabilities are absent.
Gaoding Design also currently records: pricing is freemium, product type is website, 2.7M verified monthly visits, no verified user rating. Verify any hard requirement around price, platform, or reach before trial, and do not let sparse review data substitute for testing.
Put Piktochart on the priority trial list when the task aligns with “データの可視化” and especially データの可視化、グラフィック、ブランドキット、チャートメーカー、データ視覚化、フローチャート. This follows recorded positioning and does not imply unlisted capabilities are absent.
Piktochart also currently records: pricing is freemium, product type is website, 919.7K verified monthly visits, no verified user rating. Verify any hard requirement around price, platform, or reach before trial, and do not let sparse review data substitute for testing.
The available data describes positioning, public visibility, and community signals, but it cannot prove output quality, speed, integration effort, privacy, or long-term cost in your workflow. Before deciding, run the same representative tasks in Gaoding Design and Piktochart, then record completion time, accuracy, manual corrections, and the real paid threshold. A like-for-like trial turns this comparison into a defensible adoption decision.
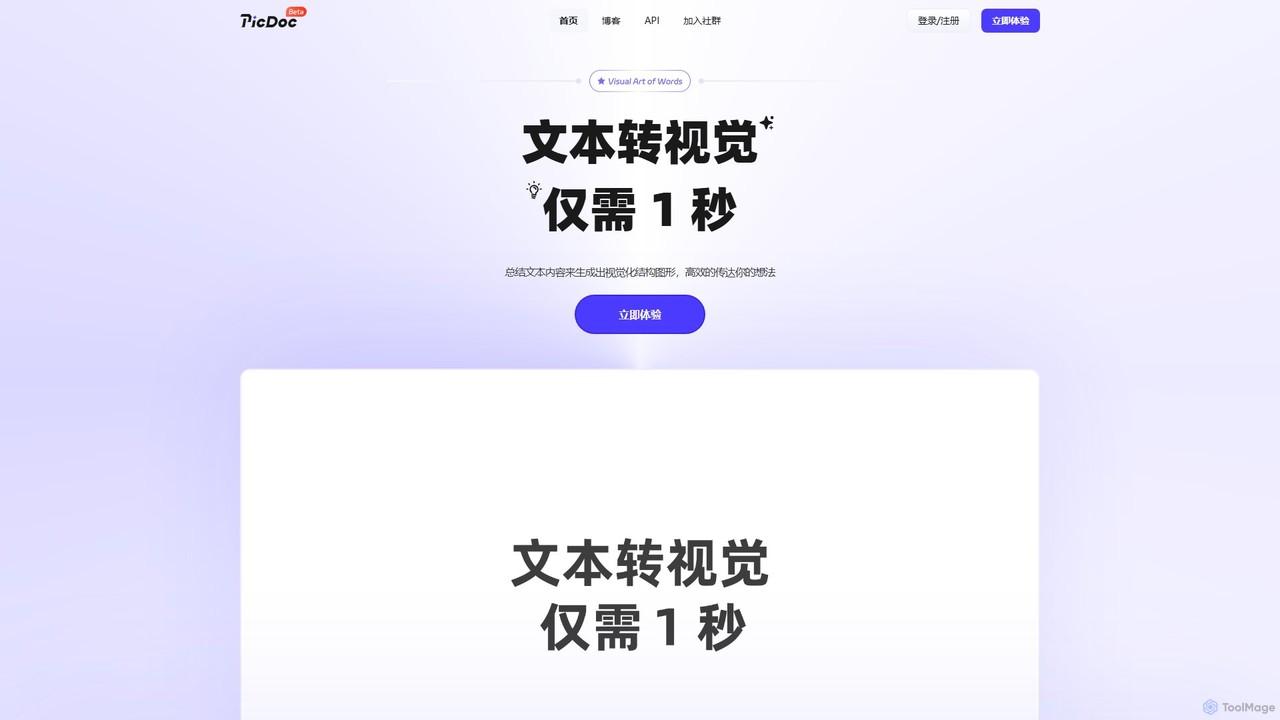
PicDocは、テキストを美しいインフォグラフィック、フローチャート、図表に即座に変換するAI搭載のテキストビジュアル化ツールです。コンテンツを入力するだけで、PicDocのAIが数秒で分析、要約、視覚化し、複雑なアイデアを効果的に伝え、デザインスキルなしでプロ級のビジュアルを作成するのに役立ちます。
インフォグラフィックス
Chuangkit AIは、AIを活用してクリエイティブなワークフローを自動化する、オールインワンのインテリジェントデザインプラットフォームです。ユーザーは簡単なテキストプロンプトからポスター、商品写真、ロゴ、ソーシャルメディアコンテンツを生成でき、包括的なAI搭載画像編集ツールスイートを提供します。
グラフィックデザイン
Krumziは、ソーシャルメディア向けのカスタムマーケティング画像や動画を作成するための直感的なオンラインデザインプラットフォームです。マーケター、クリエイター、企業がデザイン経験なしで、魅力的でブランドに合ったビジュアルを迅速かつ手頃な価格で制作できるよう支援します。主な機能には、多機能な画像・動画エディタ、一貫性を保つためのブランドキット、コンテンツ制作を効率化する自動化ツールなどがあります。
グラフィックデザイン

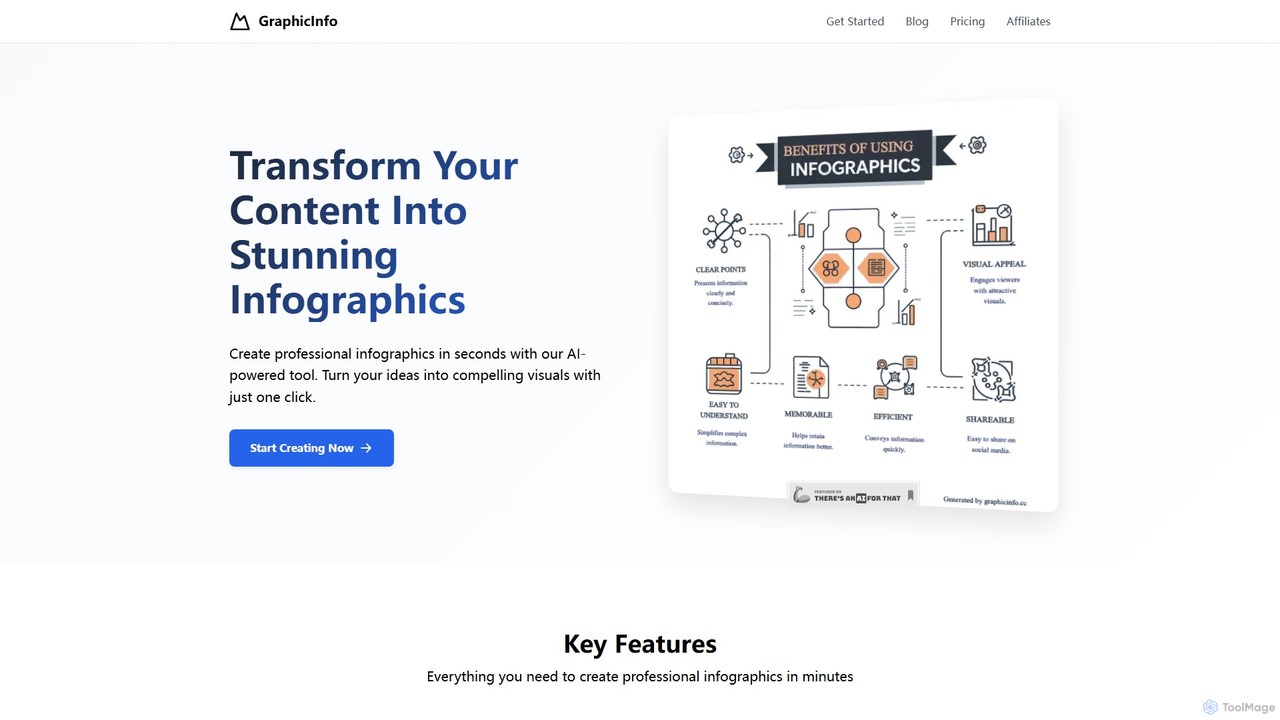
graphicinfoは、テキストやアイデアを数秒で魅力的でプロフェッショナルなビジュアルに変換するAI搭載のインフォグラフィックジェネレーターです。ワンクリックで、マーケティング、教育、ビジネス向けのカスタマイズ可能でデータ豊富なインフォグラフィックを、デザインスキル不要で作成できます。
インフォグラフィックス
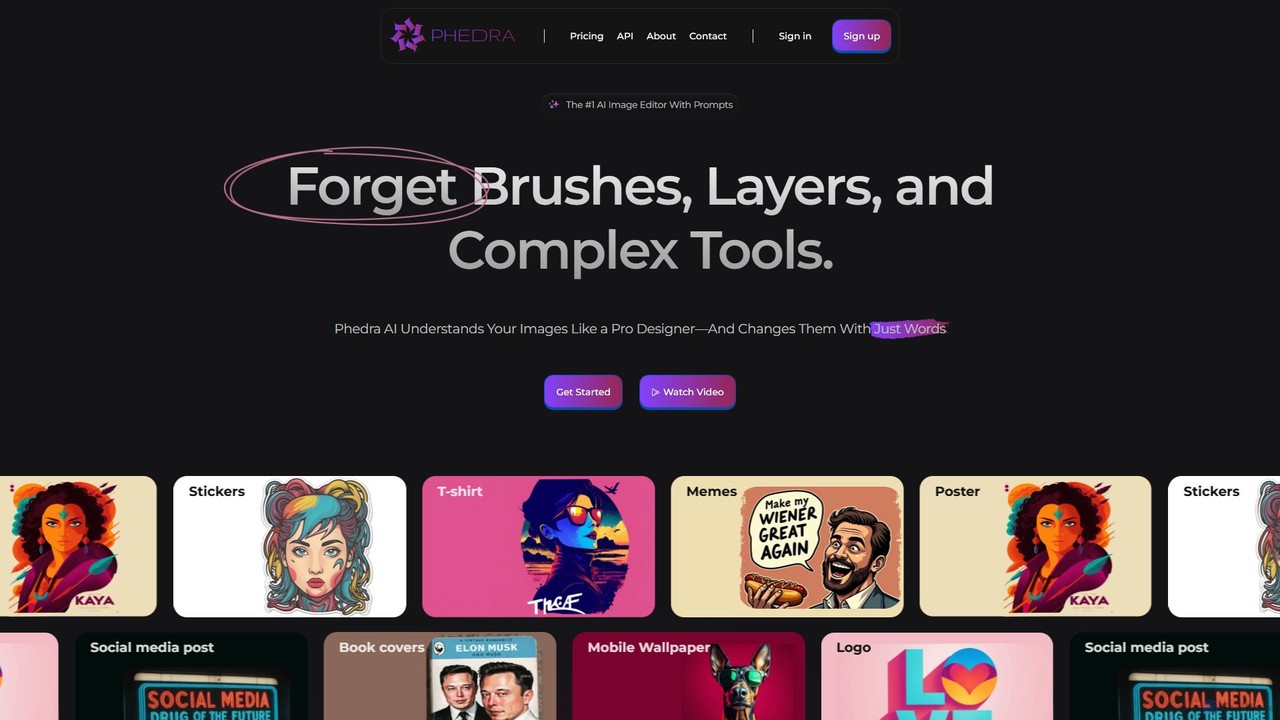
Phedraは、簡単なテキストプロンプトで写真を変換するAI搭載の画像エディタです。複雑なツールの代わりに、自然言語コマンドでオブジェクトの追加・削除、スタイルの変更、背景の置換、テキストの修正が可能です。マーケターから個人まで、誰でもソーシャルメディア投稿、ロゴ、Tシャツなどのプロ品質のデザインを簡単に作成できるように設計されています。
グラフィックデザイン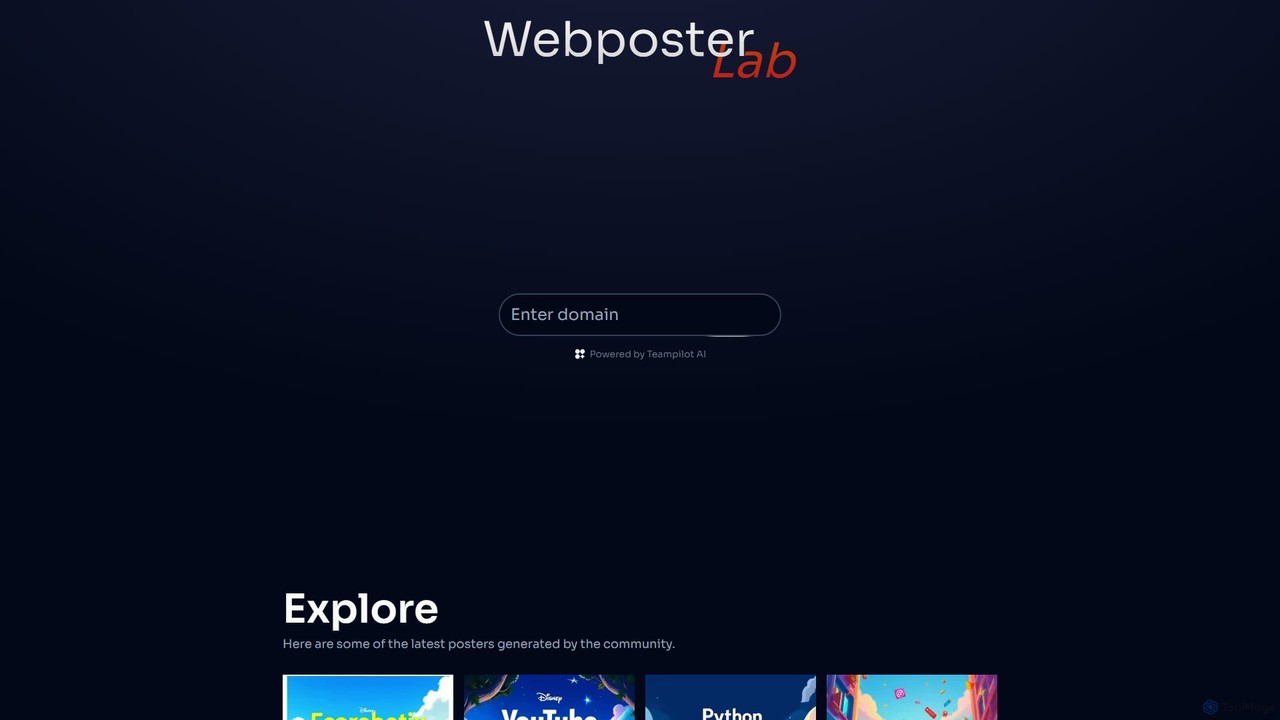
Webposter Labは、あらゆるウェブサイトのURLを瞬時に視覚的に魅力的なポスターに変換する革新的なAI搭載ツールです。リンクを貼り付けるだけで、AIがコンテンツ、デザイン、ブランディングを分析し、美しく共有可能なビジュアルサマリーを自動生成します。マーケター、コンテンツ制作者、デザインスキルなしで迅速かつ高品質なグラフィックが必要な方に最適です。
画像生成
Gammaは、AIを搭載したデザインパートナーで、コンテンツ作成を革新します。ユーザーは簡単なテキストプロンプトから、洗練されたプレゼンテーション、魅力的なウェブサイト、プロフェッショナルなドキュメント、ソーシャルメディアのグラフィックを簡単に生成できます。従来のスライドデッキや白紙のページから脱却し、デザインスキル不要で、あなたのアイデアを数分で視覚的に魅力的な共有可能な資料に変えましょう。
ウェブサイトビルダー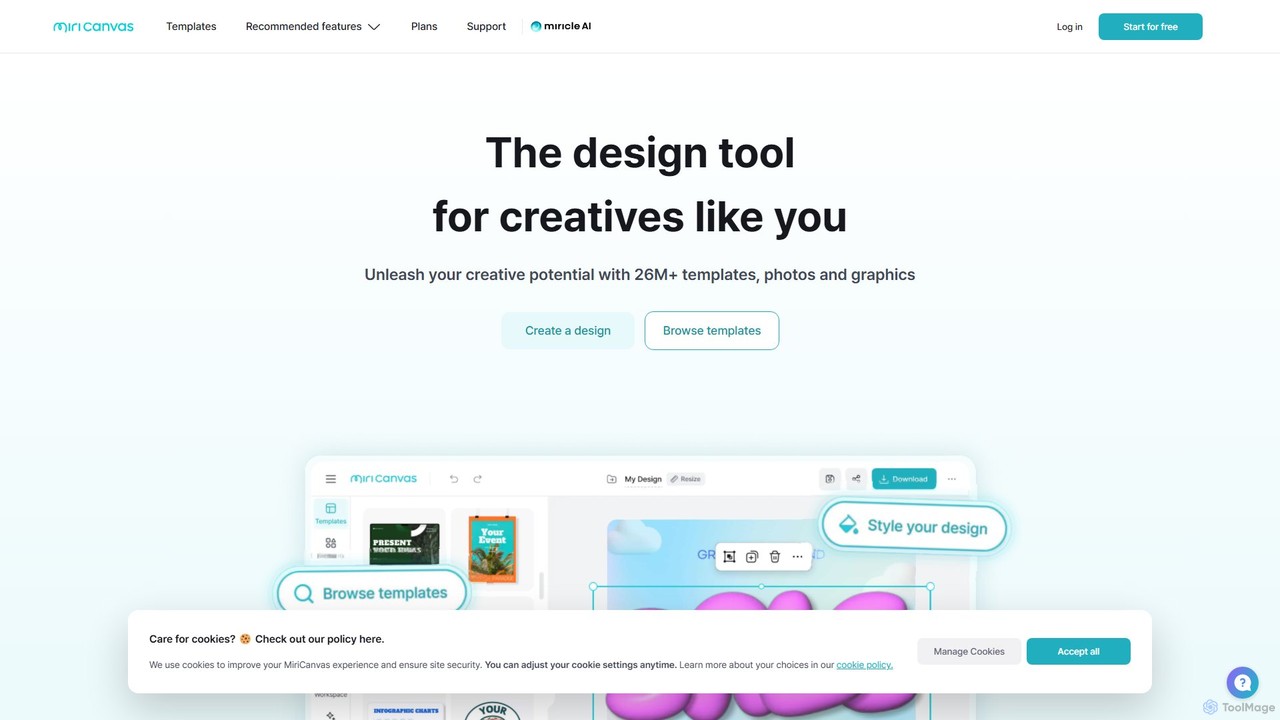
MiriCanvasは、誰もが簡単にグラフィックデザインを行えるようにする、多機能なAI搭載オンラインデザインプラットフォームです。プレゼンテーション、ソーシャルメディアコンテンツ、動画などの作成用に、2600万点以上のテンプレートとアセットの広大なライブラリを提供しています。AIプレゼンテーションジェネレーター、背景リムーバー、AI画像ジェネレーターなどの直感的なAIツールにより、ユーザーはどのデバイスでもプロ品質のデザインを迅速かつ簡単に作成できます。
画像生成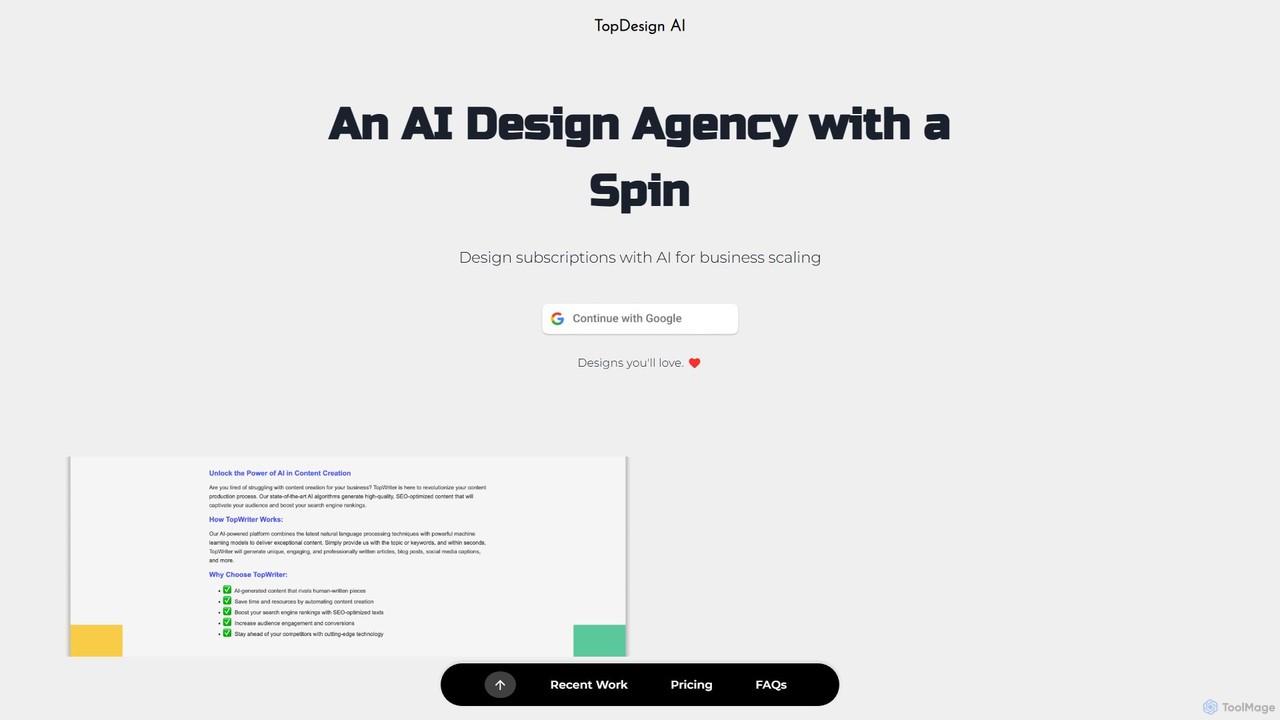
TopDesign AIは、ユーザーが素晴らしいグラフィック、ロゴ、プレゼンテーション、マーケティング資料を簡単に作成できる、オールインワンのAI搭載デザインプラットフォームです。高度なAIを活用し、簡単なテキストプロンプトを数分でプロ品質のビジュアルに変換し、スキルレベルに関係なく誰もがハイエンドなデザインを利用できるようにします。
グラフィックデザイン
Adobe Expressは、魅力的なソーシャルメディア投稿、ビデオ、チラシ、ロゴなどをデザインするための、AIを搭載したオールインワンのコンテンツ作成アプリです。Adobe Fireflyを搭載し、「テキストから画像生成」や「生成塗りつぶし」などの生成AI機能を統合しており、初心者から専門家まで誰もがプロフェッショナルなデザインを身近に感じられます。
グラフィックデザイン