Infografix
インフォグラフィックス · 37.3K 月間訪問数
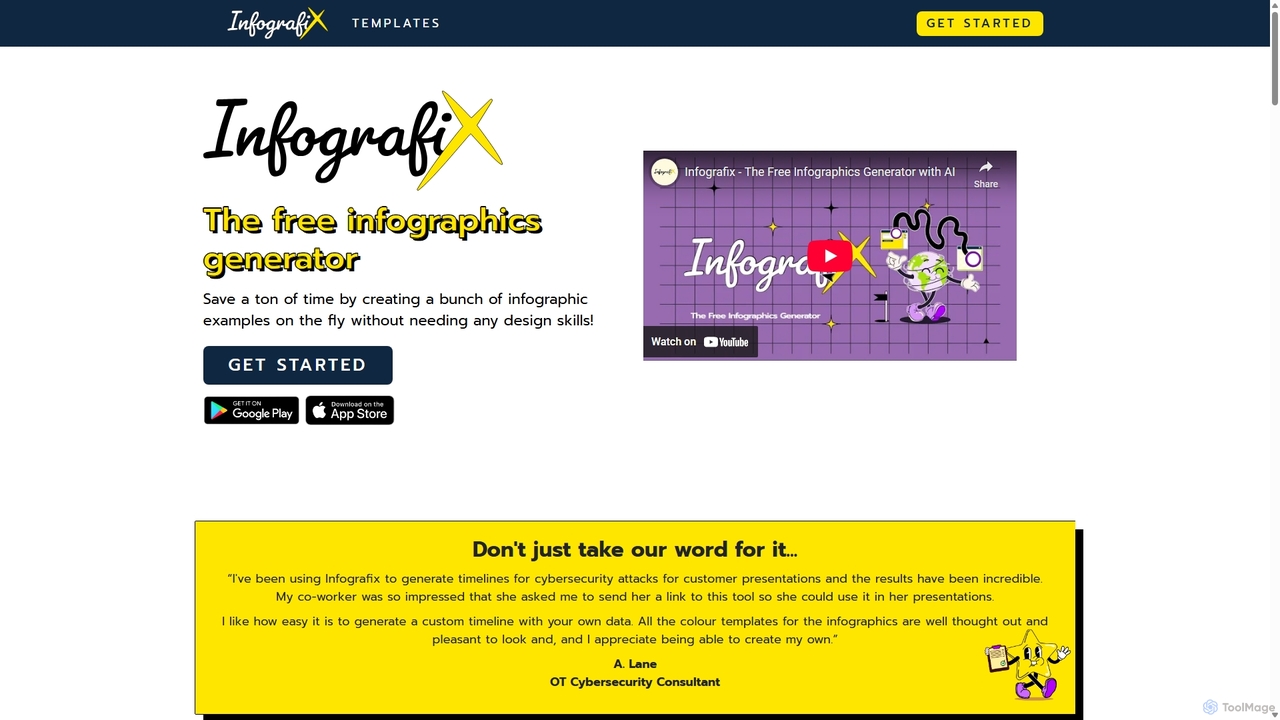
Infografixは、簡単なテキストプロンプトをプロ品質のビジュアルに変換するAI搭載のインフォグラフィックジェネレーターです。デザインスキルがなくても、数秒で魅力的なチャート、図、マインドマップ、タイムラインを作成できます。ウェブとモバイルで利用可能で、データを迅速かつ効果的に視覚化する必要があるマーケター、学生、専門家に最適です。
Infografixは、簡単なテキストプロンプトをプロ品質のビジュアルに変換するAI搭載のインフォグラフィックジェネレーターです。デザインスキルがなくても、数秒で魅力的なチャート、図、マインドマップ、タイムラインを作成できます。ウェブとモバイルで利用可能で、データを迅速かつ効果的に視覚化する必要があるマーケター、学生、専門家に最適です。
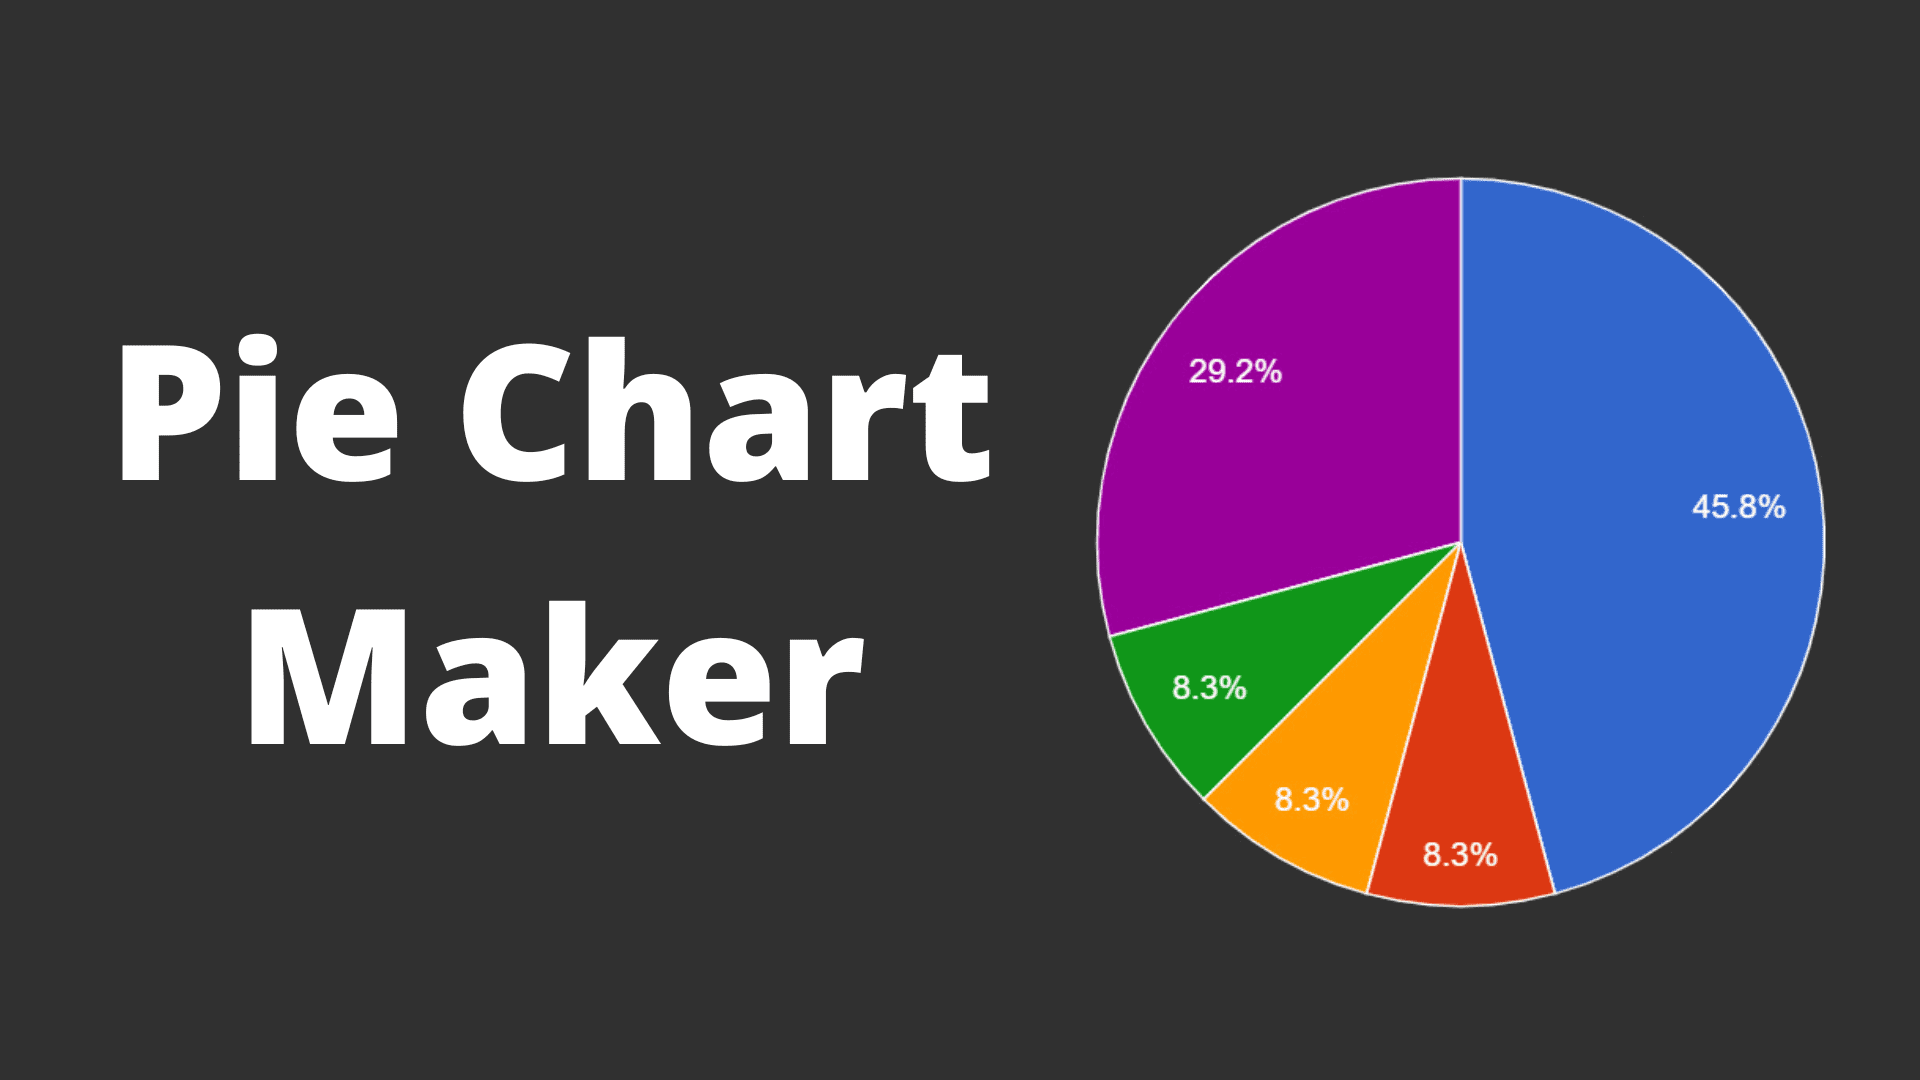
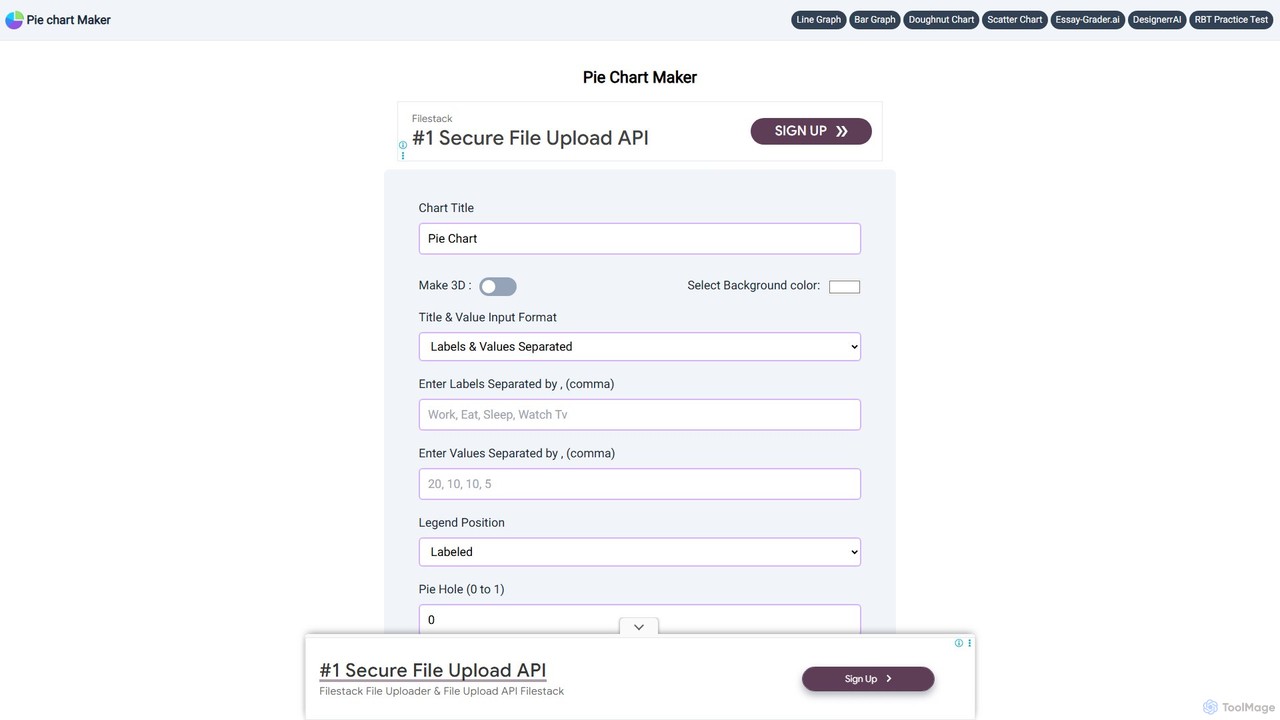
無料で使いやすいオンラインツール。数回のクリックで美しくカスタマイズ可能な円グラフ、ドーナツグラフ、折れ線グラフを作成できます。ラベルと値を入力するだけでデータを即座に視覚化し、PNG、JPEG、SVGなどの様々な形式でグラフをダウンロードできます。
Infografixは、簡単なテキストプロンプトをプロ品質のビジュアルに変換するAI搭載のインフォグラフィックジェネレーターです。デザインスキルがなくても、数秒で魅力的なチャート、図、マインドマップ、タイムラインを作成できます。ウェブとモバイルで利用可能で、データを迅速かつ効果的に視覚化する必要があるマーケター、学生、専門家に最適です。
無料で使いやすいオンラインツール。数回のクリックで美しくカスタマイズ可能な円グラフ、ドーナツグラフ、折れ線グラフを作成できます。ラベルと値を入力するだけでデータを即座に視覚化し、PNG、JPEG、SVGなどの様々な形式でグラフをダウンロードできます。
| Feature | Infografix | Pie Chart Maker |
|---|---|---|
| 主要カテゴリー | インフォグラフィックス | 学生ツール |
| 追加日 | 2025-09-03 | 2025-08-14 |
| 価格 | フリーミアム | 無料 |
| 公式サイト | infografix.app | piechartmaker.co |
| 製品タイプ | ウェブサイト | ウェブサイト |
| Performance data | ||
| ユーザー評価 | 未確認 | 未確認 |
| コメント | 0 | 0 |
| 月間訪問数 | 37.3K | 50K |
| 月間成長率 | -7.7% | -8.8% |
| お気に入り | 118 | 143 |
| Details | 詳細を見る | 詳細を見る |
Compare Infografix and Pie Chart Maker by monthly reach, traffic trend, visit depth, top regions, and acquisition sources.
In the Infografix vs Pie Chart Maker monthly traffic comparison, Infografix currently shows 37.3K visits and Pie Chart Maker shows 50K; Pie Chart Maker has about 1.3 times the visible traffic of Infografix, an absolute difference of about 12.7K visits. This reflects visible reach, not feature quality or paid users.
Both tools provide verified traffic details, so monthly trends, visit depth, regions, and acquisition sources can be compared on the same basis.
| Country/region | Percentage | Traffic |
|---|---|---|
| 🇳🇬Nigeria | 28.92% | 10.8K |
| 🇺🇸United States | 19.88% | 7.4K |
| 🇮🇳India | 19.4% | 7.2K |
| 🇻🇳Vietnam | 16.61% | 6.2K |
| 🇮🇩Indonesia | 15.19% | 5.7K |
| Country/region | Percentage | Traffic |
|---|---|---|
| 🇺🇸United States | 56.98% | 28.5K |
| 🇵🇭Philippines | 12.29% | 6.2K |
| 🇬🇧United Kingdom | 11.96% | 6K |
| 🇮🇳India | 9.42% | 4.7K |
| 🇮🇩Indonesia | 9.35% | 4.7K |
| Source type | Percentage | Traffic |
|---|---|---|
| ダイレクト | 80.1% | 40.1K |
| 参照元 | 14.35% | 7.2K |
| Eメール | 5.55% | 2.8K |
This in-depth Infografix vs Pie Chart Maker comparison uses only the product records, taxonomy, audience, traffic, and community signals available on this page. Infografix is primarily listed under “インフォグラフィックス”, while Pie Chart Maker is primarily listed under “学生ツール”, so the first decision is whether your actual task matches their recorded scope.
The structured fields currently show these decision-relevant differences: Primary category (Infografix: インフォグラフィックス; Pie Chart Maker: 学生ツール); Pricing (Infografix: Freemium; Pie Chart Maker: Free); Monthly visits (Infografix: 37.3K; Pie Chart Maker: 50K); Monthly growth (Infografix: -7.7%; Pie Chart Maker: -8.8%); Favorites (Infografix: 118; Pie Chart Maker: 143). These facts are more useful for selection than brand visibility alone.
In the Infografix vs Pie Chart Maker monthly traffic comparison, Infografix currently shows 37.3K visits and Pie Chart Maker shows 50K; Pie Chart Maker has about 1.3 times the visible traffic of Infografix, an absolute difference of about 12.7K visits. This reflects visible reach, not feature quality or paid users.
Both tools provide verified traffic details, so monthly trends, visit depth, regions, and acquisition sources can be compared on the same basis.
If public market visibility is an important first-pass criterion, investigate Pie Chart Maker first. The final choice should still follow taxonomy, use case, and a real trial because higher traffic does not prove broader capabilities or better workflow fit.
Infografix and Pie Chart Maker currently overlap in shared categories: コンテンツ作成、データ視覚化; shared tags: チャートメーカー、データ視覚化. This can place both on the same shortlist, but it does not prove equal implementation, depth, or cost.
Infografix's unique categories/tags are インフォグラフィックス、AIデザインツール、ダイアグラム作成ツール、インフォグラフィックジェネレーター、マーケティングビジュアル、マインドマップジェネレーター、プレゼンテーションツール、テキストから画像へ; Pie Chart Maker's are 学生ツール、データ分析、ドーナツチャート、無料ツール、グラフ作成ツール、折れ線グラフ、オンラインチャートジェネレーター、円グラフ. These unique fields are the strongest differentiators: validate the product whose recorded scope matches the task instead of following traffic alone.
Infografix has no verified rating, 0 comments, 118 favorites, and 105 likes;Pie Chart Maker has no verified rating, 0 comments, 143 favorites, and 154 likes。
Neither product has enough rating or comment samples for a credible reputation ranking.
Put Infografix on the priority trial list when the task aligns with “インフォグラフィックス” and especially インフォグラフィックス、AIデザインツール、ダイアグラム作成ツール、インフォグラフィックジェネレーター、マーケティングビジュアル、マインドマップジェネレーター, or the users include ブロガー、ビジネスコンサルタント、コンテンツクリエイター、データアナリスト. This follows recorded positioning and does not imply unlisted capabilities are absent.
Infografix also currently records: pricing is freemium, product type is website, 37.3K verified monthly visits, no verified user rating. Verify any hard requirement around price, platform, or reach before trial, and do not let sparse review data substitute for testing.
Put Pie Chart Maker on the priority trial list when the task aligns with “学生ツール” and especially 学生ツール、データ分析、ドーナツチャート、無料ツール、グラフ作成ツール、折れ線グラフ. This follows recorded positioning and does not imply unlisted capabilities are absent.
Pie Chart Maker also currently records: pricing is free, product type is website, 50K verified monthly visits, no verified user rating. Verify any hard requirement around price, platform, or reach before trial, and do not let sparse review data substitute for testing.
The available data describes positioning, public visibility, and community signals, but it cannot prove output quality, speed, integration effort, privacy, or long-term cost in your workflow. Before deciding, run the same representative tasks in Infografix and Pie Chart Maker, then record completion time, accuracy, manual corrections, and the real paid threshold. A like-for-like trial turns this comparison into a defensible adoption decision.
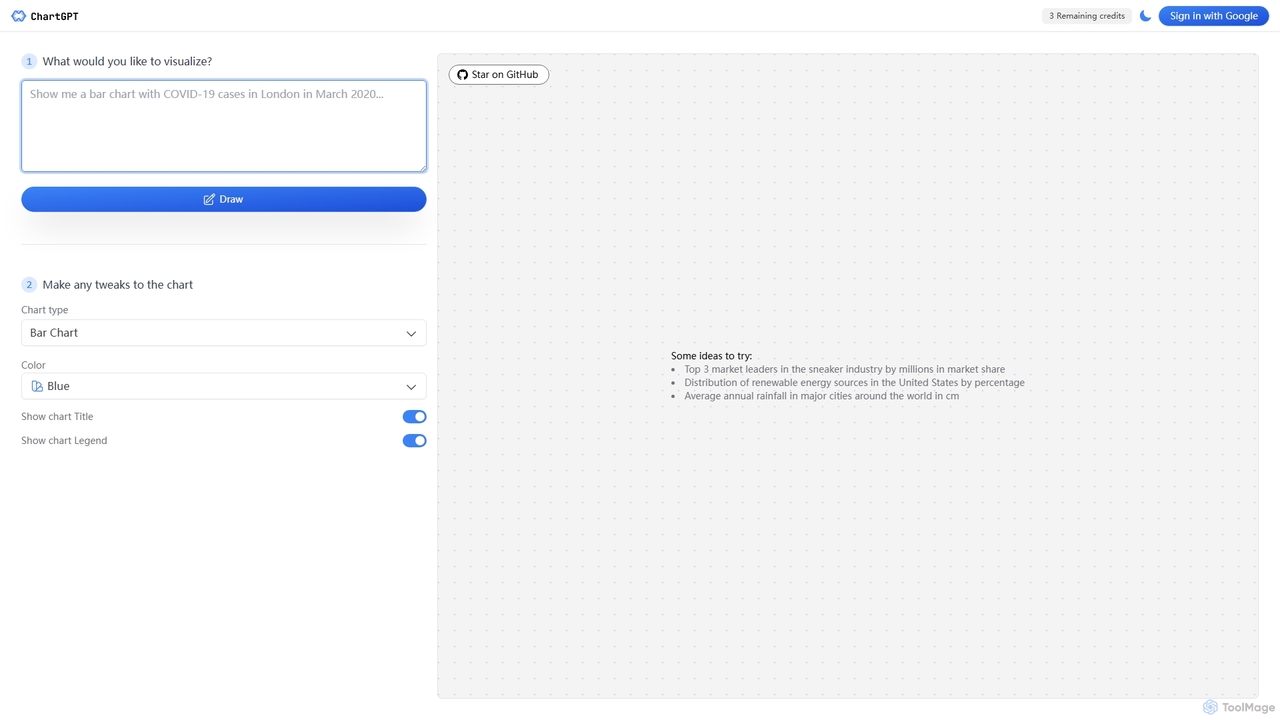
ChartGPTは、自然言語のテキストプロンプトを多様で美しいチャートやグラフに変換するAI搭載ツールです。視覚化したいデータを説明するだけで、ChartGPTが即座にカスタマイズ可能なチャートを生成し、技術的なスキルに関係なく誰もがデータ視覚化を利用できるようにします。
ビジネスインテリジェンス
ChartGPTは、自然言語のプロンプトや生データを、見事でカスタマイズ可能なチャートやグラフに変換するAI搭載ツールです。コーディングは一切不要で、見たいものを説明するだけで、棒グラフ、折れ線グラフ、円グラフなどの複雑な視覚化を簡単に作成できます。
インフォグラフィックス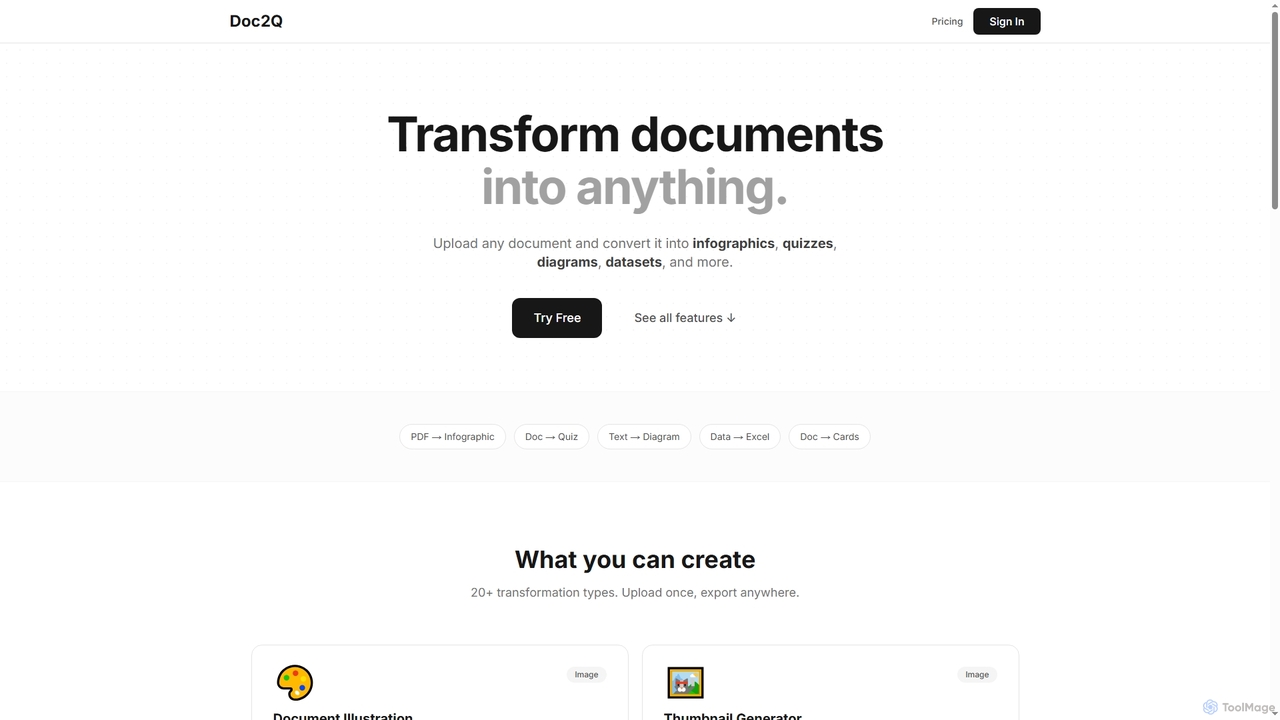
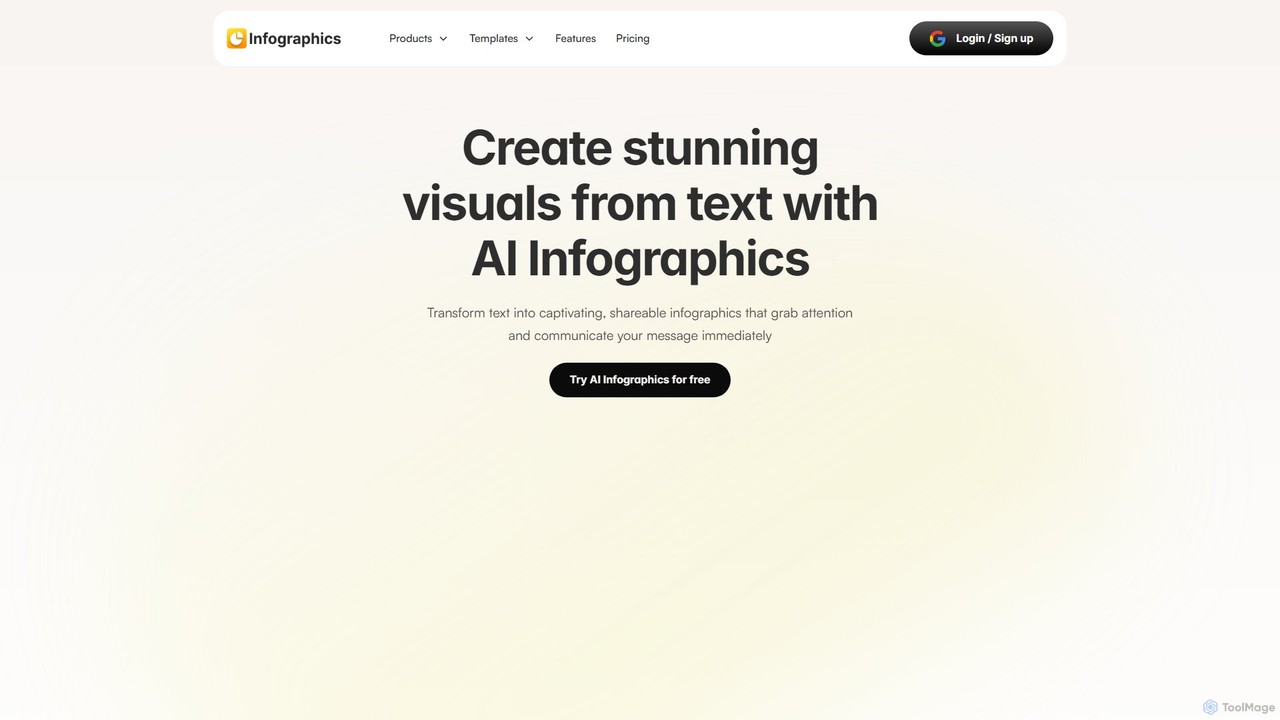
infographics.soは、テキストを瞬時に美しくプロフェッショナルなインフォグラフィックに変換するAI搭載ツールです。タイムライン、ロードマップ、ファネルなど様々な形式をサポートし、ブランドに合わせた完全なカスタマイズが可能です。デザインスキルがなくても、レポート、ブログ、プレゼンテーション用の魅力的なビジュアルを数秒で作成したいマーケター、プロジェクトマネージャー、コンテンツクリエーターに最適です。
インフォグラフィックス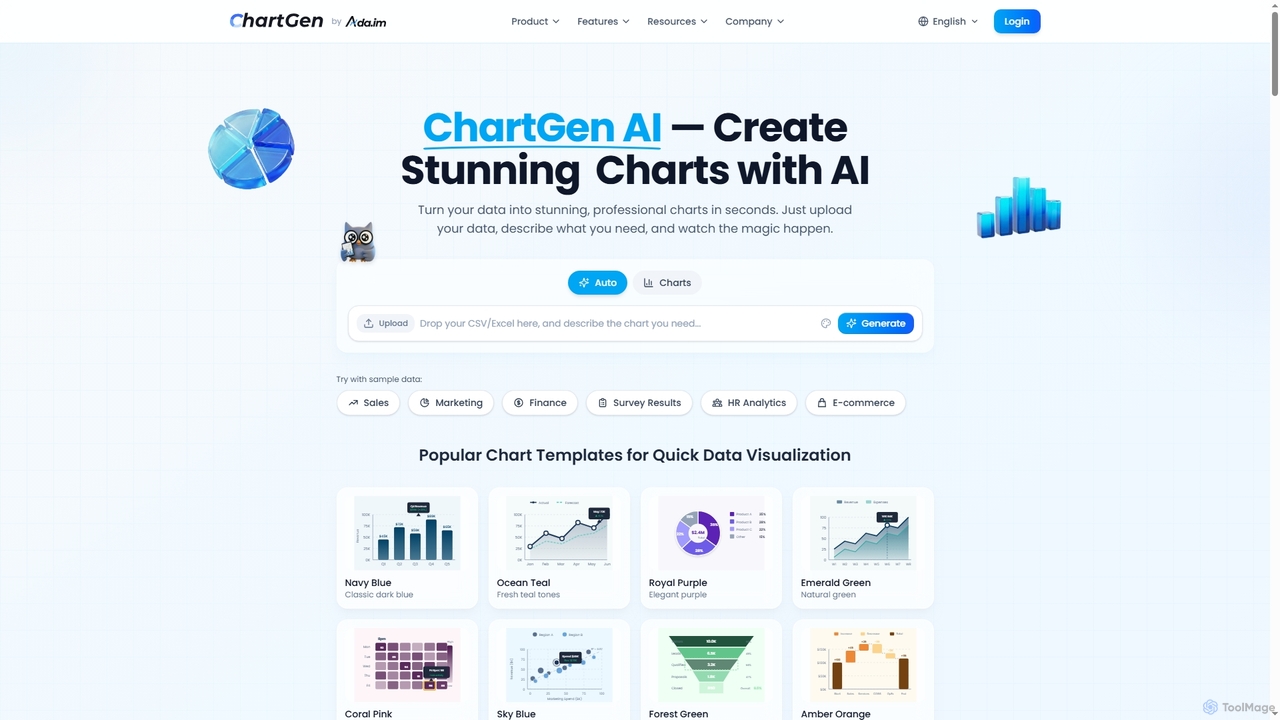
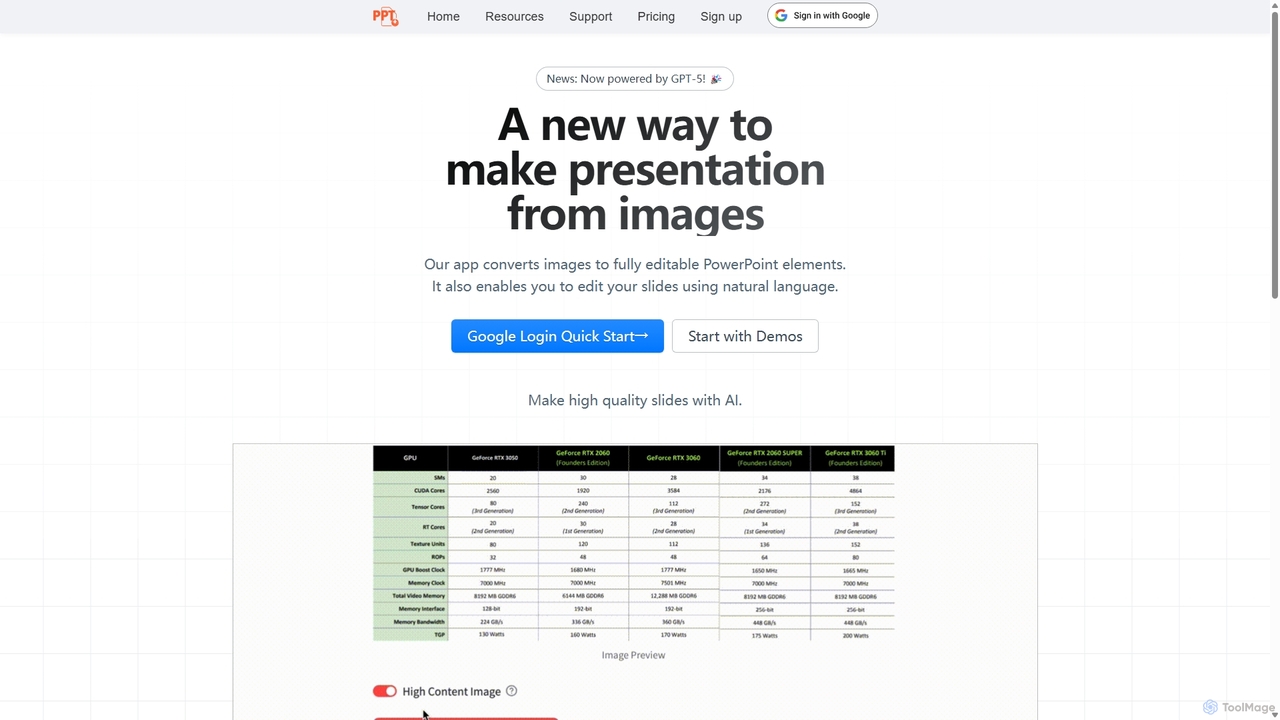
Edit in PPTは、画像、スクリーンショット、静的なスライドを完全に編集可能なPowerPointプレゼンテーションに変換するAI搭載ツールです。高度なビジョンモデルを使用してテキスト、グラフ、図形を認識し、ユーザーの手作業による再作成時間を数時間節約します。また、自然言語コマンドによるスライド編集機能も備えており、プレゼンテーション作成プロセス全体を効率化します。
自動化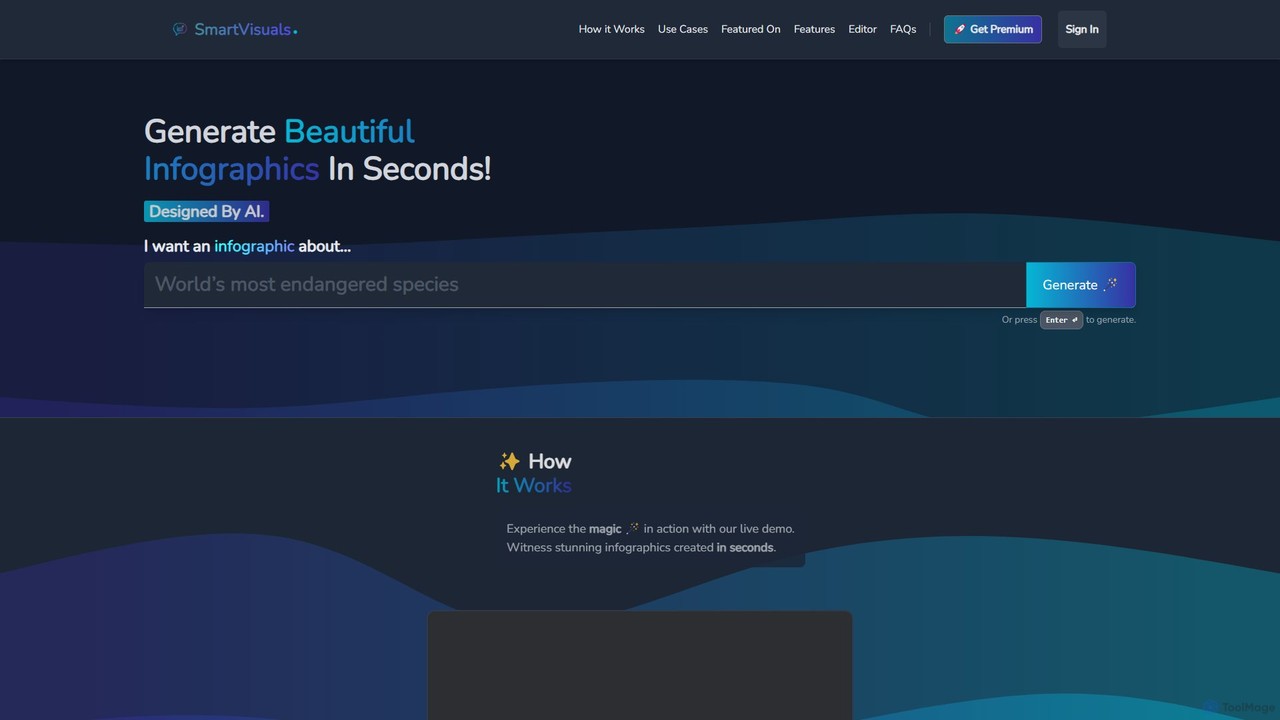
SmartVisualsは、テキストプロンプトを視覚的に魅力的で構造化されたインフォグラフィックに変換するAI搭載のインフォグラフィックジェネレーターです。トピックを説明するだけで、AIが自動的にプロフェッショナルなビジュアルをデザイン・作成し、複雑な情報を簡単に理解・共有できるようにします。デザインスキルがなくても高品質なビジュアルを迅速に作成する必要があるマーケター、教育者、学生、専門家に最適です。
インフォグラフィックス

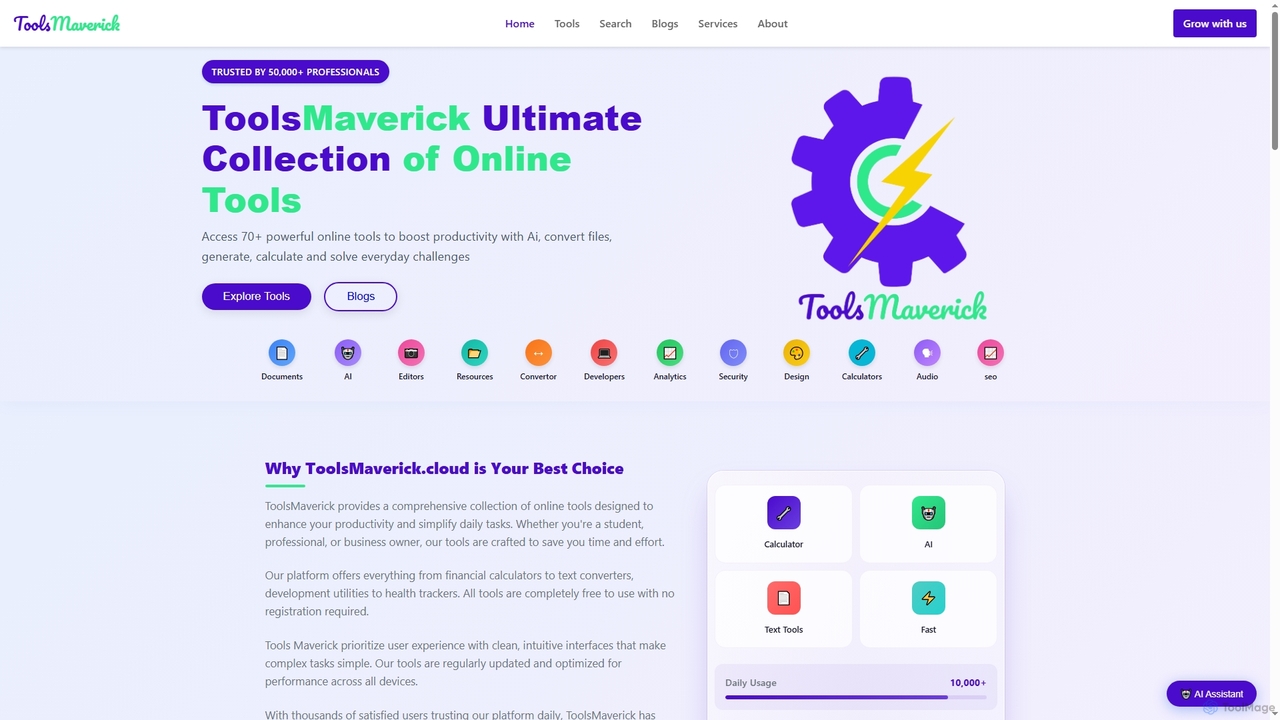
ToolsMaverickは、強力なAIツール、計算機、コンバーター、SEO支援、開発ツールなど、70種類以上の多様なユーティリティを提供する包括的で無料のオンラインプラットフォームです。シンプルさを追求して設計されており、サインアップ不要、広告なしで、プロフェッショナル、学生、日常のユーザーの生産性向上に即座に役立ちます。
コンテンツ分析
Instantは、Googleスライド拡張機能として設計されたAI搭載のプレゼンテーションジェネレーターです。使い慣れたワークフロー内で、視覚的に美しく、完全に編集可能なプレゼンテーションを直接作成できます。高度なAIと100以上の専門家がデザインしたテンプレートライブラリを組み合わせることで、Instantは単なるテキストや箇条書きを超え、インフォグラフィック、図、フローチャートを含む魅力的なスライドの生成に優れています。コンテンツ作成、アウトライン生成、レイアウトデザインを自動化し、時間と労力を節約しながらプロ級の成果を生み出します。
学習
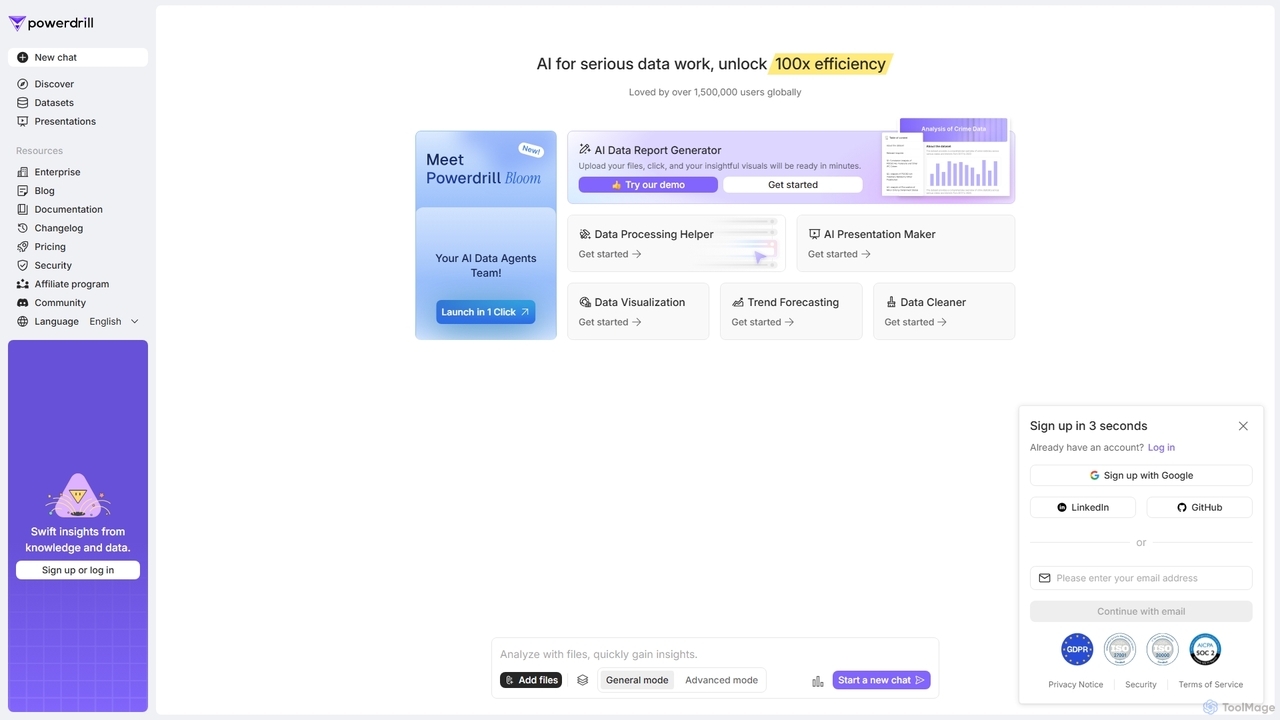
Powerdrillは、本格的なデータ作業のために設計されたAI搭載のデータ分析プラットフォームで、ユーザーが100倍の効率を実現できるよう支援します。データ処理やクリーニングから、可視化、レポート生成、トレンド予測までの全プロセスを自動化します。ファイル(Excel、CSV、PDF)をアップロードするか、データベースに接続するだけで、AIが数分で実用的なインサイト、インタラクティブなチャート、包括的なプレゼンテーションを生成します。
ビジネスインテリジェンス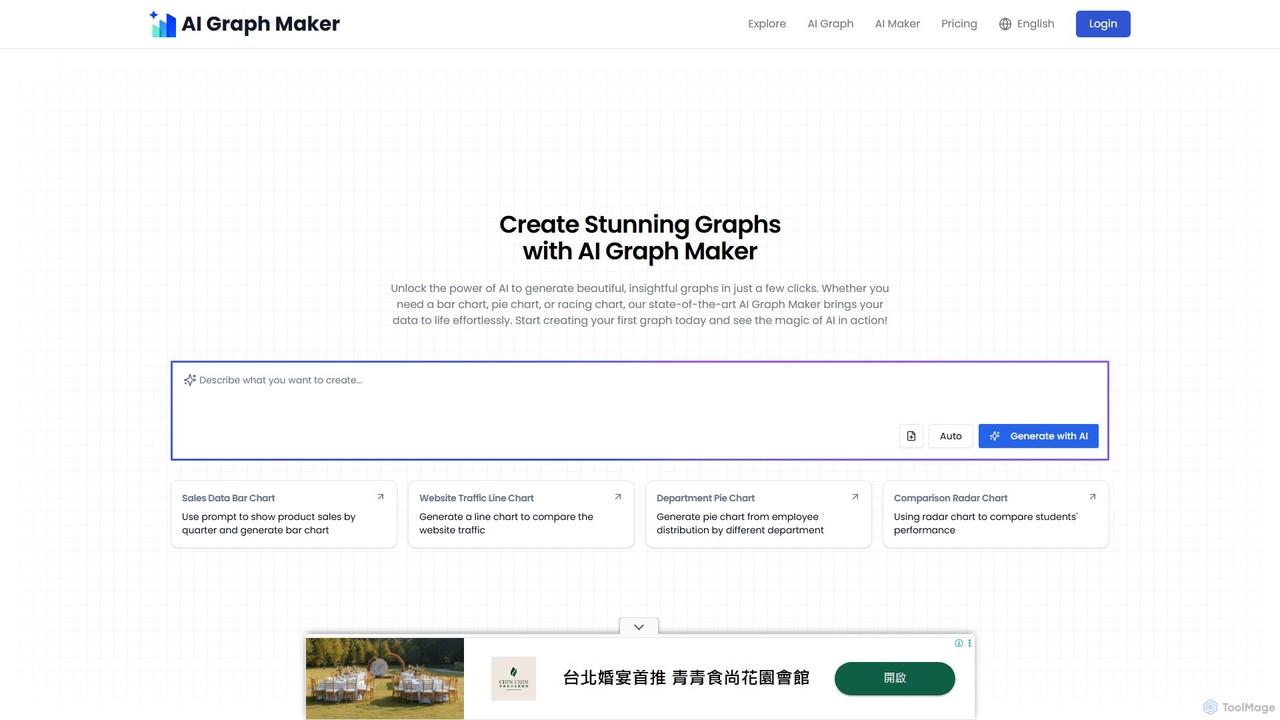
aigraphmakerは、AIを搭載したプラットフォームで、生データやテキストプロンプトを多種多様なプロフェッショナルでインタラクティブなチャートや図に変換します。初心者から専門家まで、コーディングやデザインのスキルがなくても、棒グラフ、マインドマップ、フローチャート、ナレッジグラフなどの見事なビジュアルを数秒で簡単に作成できます。
分析