Lucidchart
プロジェクト管理 · 2.4M 月間訪問数
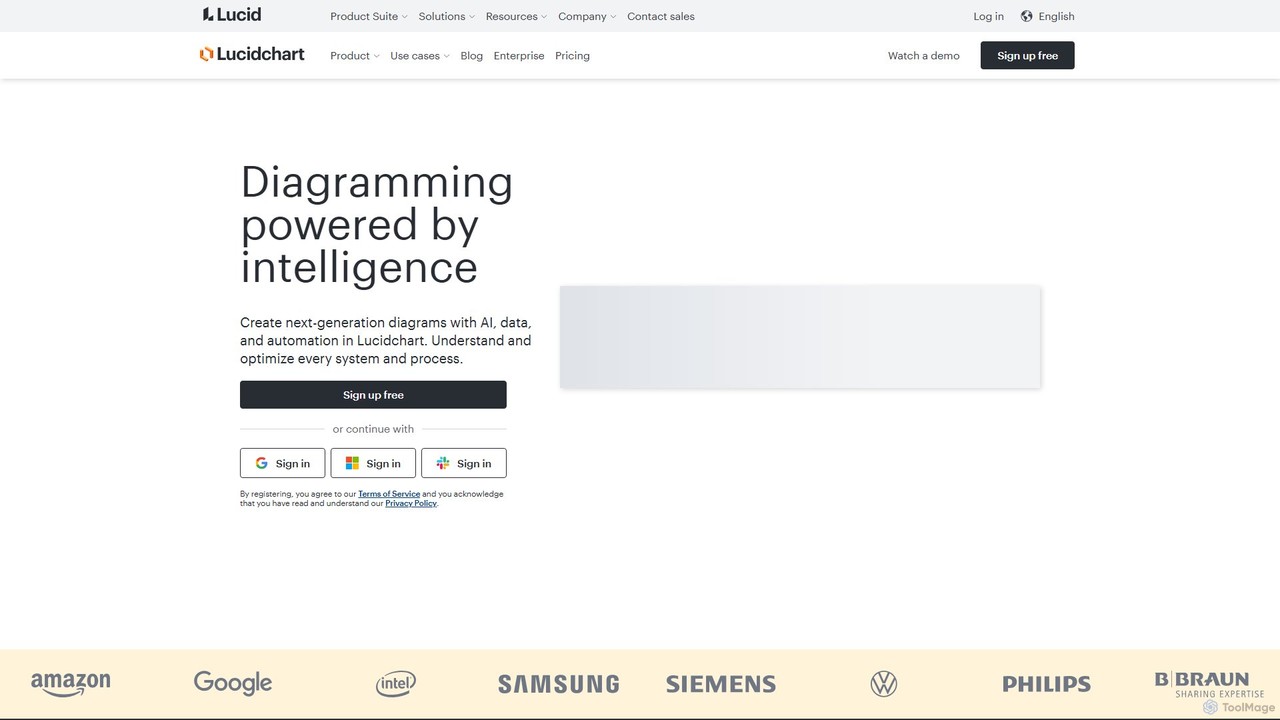
Lucidchartは、AI、データ自動化、リアルタイムのチームワークを活用して、ユーザーが複雑なシステム、プロセス、アイデアを視覚化するのを支援するインテリジェントな作図およびビジュアルコラボレーションプラットフォームです。チームがプロフェッショナルなフローチャート、組織図、ネットワーク図などを作成し、明確性を高め、イノベーションを推進することを可能にします。
Lucidchartは、AI、データ自動化、リアルタイムのチームワークを活用して、ユーザーが複雑なシステム、プロセス、アイデアを視覚化するのを支援するインテリジェントな作図およびビジュアルコラボレーションプラットフォームです。チームがプロフェッショナルなフローチャート、組織図、ネットワーク図などを作成し、明確性を高め、イノベーションを推進することを可能にします。
splotchは、記述されたテキスト、プロセス、ワークフローを明確で編集可能なフローチャートや図に自動変換するAI搭載のダイアグラムツールです。独自の双方向同期機能を備え、テキストとビジュアルが常に一致するようにし、コミュニケーションとプロセス文書化を効率化します。
Lucidchartは、AI、データ自動化、リアルタイムのチームワークを活用して、ユーザーが複雑なシステム、プロセス、アイデアを視覚化するのを支援するインテリジェントな作図およびビジュアルコラボレーションプラットフォームです。チームがプロフェッショナルなフローチャート、組織図、ネットワーク図などを作成し、明確性を高め、イノベーションを推進することを可能にします。
splotchは、記述されたテキスト、プロセス、ワークフローを明確で編集可能なフローチャートや図に自動変換するAI搭載のダイアグラムツールです。独自の双方向同期機能を備え、テキストとビジュアルが常に一致するようにし、コミュニケーションとプロセス文書化を効率化します。
| Feature | Lucidchart | splotch |
|---|---|---|
| 主要カテゴリー | プロジェクト管理 | プロセス管理 |
| 追加日 | 2025-08-14 | 2025-08-04 |
| 価格 | フリーミアム | フリーミアム |
| 公式サイト | www.lucidchart.com | www.splotch.ink |
| 製品タイプ | ウェブサイト | ウェブサイト |
| Performance data | ||
| ユーザー評価 | 未確認 | 未確認 |
| コメント | 0 | 0 |
| 月間訪問数 | 2.4M | 811 |
| 月間成長率 | -10.5% | -76.7% |
| お気に入り | 128 | 108 |
| Details | 詳細を見る | 詳細を見る |
Compare Lucidchart and splotch by monthly reach, traffic trend, visit depth, top regions, and acquisition sources.
In the Lucidchart vs splotch monthly traffic comparison, Lucidchart currently shows 2.4M visits and splotch shows 811; Lucidchart has about 2,922 times the visible traffic of splotch, an absolute difference of about 2.4M visits. This reflects visible reach, not feature quality or paid users.
Both tools provide verified traffic details, so monthly trends, visit depth, regions, and acquisition sources can be compared on the same basis.
Lucidchart is registered at the www.lucidchart.com/pages subpage. Because the current data does not state whether other host pages are excluded, treat this as domain-level context rather than independent traffic for one product or project.
| Country/region | Percentage | Traffic |
|---|---|---|
| 🇺🇸United States | 42.16% | 999.1K |
| 🇲🇽Mexico | 17.72% | 419.9K |
| 🇨🇴Colombia | 16.67% | 395K |
| 🇧🇷Brazil | 13.51% | 320.1K |
| 🇵🇪Peru | 9.94% | 235.5K |
| Source type | Percentage | Traffic |
|---|---|---|
| ダイレクト | 81.99% | 1.9M |
| 参照元 | 16.95% | 401.7K |
| Eメール | 1.06% | 25.1K |
| Country/region | Percentage | Traffic |
|---|---|---|
| 🇺🇸United States | 74.06% | 601 |
| 🇨🇦Canada | 25.94% | 210 |
This in-depth Lucidchart vs splotch comparison uses only the product records, taxonomy, audience, traffic, and community signals available on this page. Lucidchart is primarily listed under “プロジェクト管理”, while splotch is primarily listed under “プロセス管理”, so the first decision is whether your actual task matches their recorded scope.
The structured fields currently show these decision-relevant differences: Primary category (Lucidchart: プロジェクト管理; splotch: プロセス管理); Monthly visits (Lucidchart: 2.4M; splotch: 811); Monthly growth (Lucidchart: -10.5%; splotch: -76.7%); Favorites (Lucidchart: 128; splotch: 108); Website (Lucidchart: www.lucidchart.com; splotch: www.splotch.ink). These facts are more useful for selection than brand visibility alone.
In the Lucidchart vs splotch monthly traffic comparison, Lucidchart currently shows 2.4M visits and splotch shows 811; Lucidchart has about 2,922 times the visible traffic of splotch, an absolute difference of about 2.4M visits. This reflects visible reach, not feature quality or paid users.
Both tools provide verified traffic details, so monthly trends, visit depth, regions, and acquisition sources can be compared on the same basis.
Lucidchart is registered at the www.lucidchart.com/pages subpage. Because the current data does not state whether other host pages are excluded, treat this as domain-level context rather than independent traffic for one product or project.
Lucidchart is registered under a www.lucidchart.com subpath, so its large visible total may include the host platform. The current data does not justify choosing Lucidchart for traffic alone; shortlist by unique taxonomy and use case, then validate with the same tasks.
Lucidchart and splotch currently overlap in shared categories: 図形描画; shared tags: AIダイアグラム、図作成、プロセス マッピング、システム設計. This can place both on the same shortlist, but it does not prove equal implementation, depth, or cost.
Lucidchart's unique categories/tags are プロジェクト管理、システム設計、コラボレーション、データ視覚化、ERD、フローチャート、組織図、UML; splotch's are プロセス管理、プロトタイピング、営業支援、フローチャートジェネレーター、標準作業手順書、テキストを図に、ユーザー ジャーニー マッピング、ワークフロー自動化. These unique fields are the strongest differentiators: validate the product whose recorded scope matches the task instead of following traffic alone.
Lucidchart has no verified rating, 0 comments, 128 favorites, and 115 likes;splotch has no verified rating, 0 comments, 108 favorites, and 102 likes。
Neither product has enough rating or comment samples for a credible reputation ranking.
Put Lucidchart on the priority trial list when the task aligns with “プロジェクト管理” and especially プロジェクト管理、システム設計、コラボレーション、データ視覚化、ERD、フローチャート. This follows recorded positioning and does not imply unlisted capabilities are absent.
Lucidchart also currently records: pricing is freemium, product type is website, 2.4M monthly visits shown for the registered host (subpage scope unknown), no verified user rating. Verify any hard requirement around price, platform, or reach before trial, and do not let sparse review data substitute for testing.
Put splotch on the priority trial list when the task aligns with “プロセス管理” and especially プロセス管理、プロトタイピング、営業支援、フローチャートジェネレーター、標準作業手順書、テキストを図に. This follows recorded positioning and does not imply unlisted capabilities are absent.
splotch also currently records: pricing is freemium, product type is website, 811 verified monthly visits, no verified user rating. Verify any hard requirement around price, platform, or reach before trial, and do not let sparse review data substitute for testing.
The available data describes positioning, public visibility, and community signals, but it cannot prove output quality, speed, integration effort, privacy, or long-term cost in your workflow. Before deciding, run the same representative tasks in Lucidchart and splotch, then record completion time, accuracy, manual corrections, and the real paid threshold. A like-for-like trial turns this comparison into a defensible adoption decision.
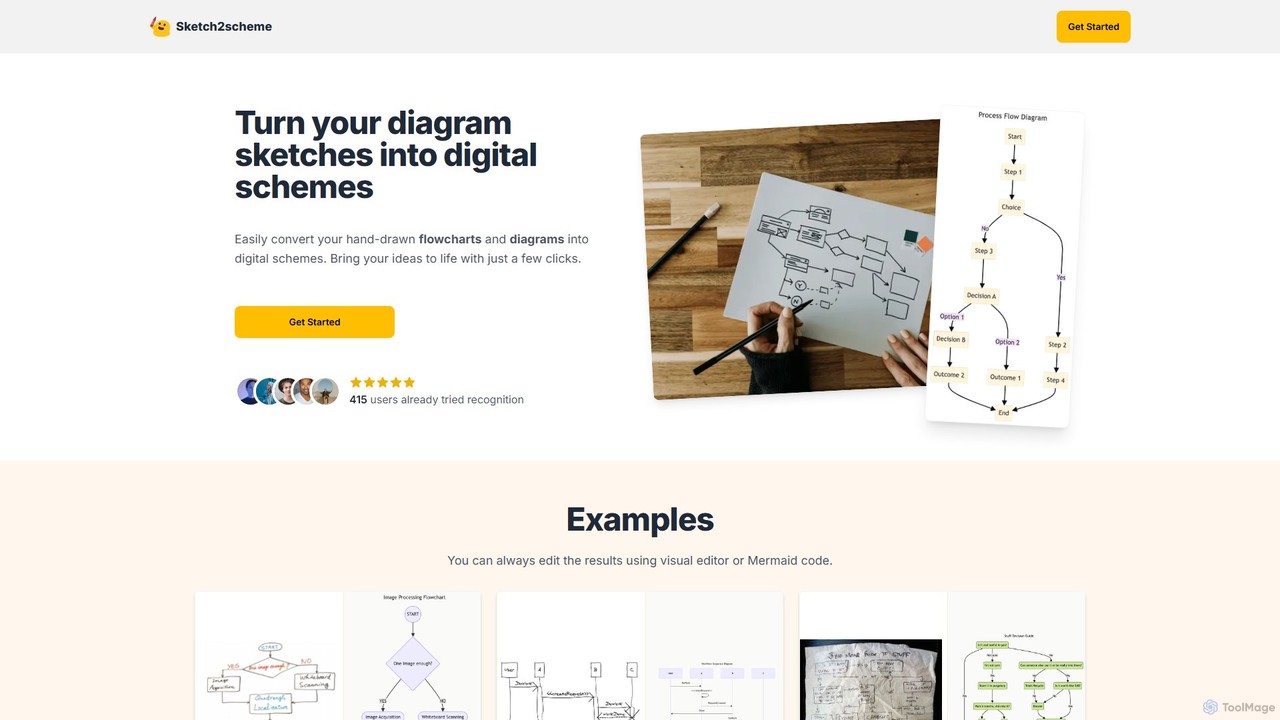
Sketch2schemeは、手描きのダイアグラムスケッチを、洗練された編集可能なデジタルスキームに簡単に変換するAI搭載ツールです。フローチャートやダイアグラムの写真をアップロードするだけで、AIがノード、接続、テキストを認識し、アナログのアイデアを数秒でデジタル資産に変換します。紙でのブレインストーミングとデジタルでの実装のギャップを埋めたい開発者、プロジェクトマネージャー、学生に最適です。
プロトタイピング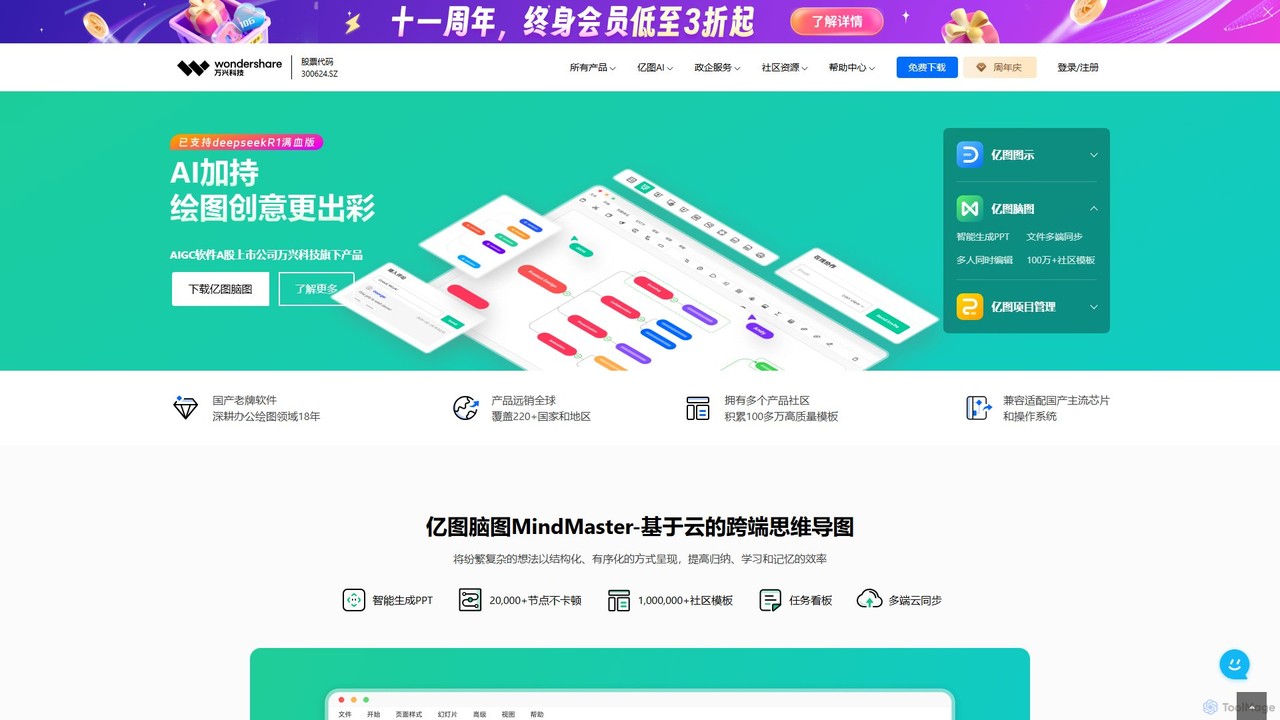
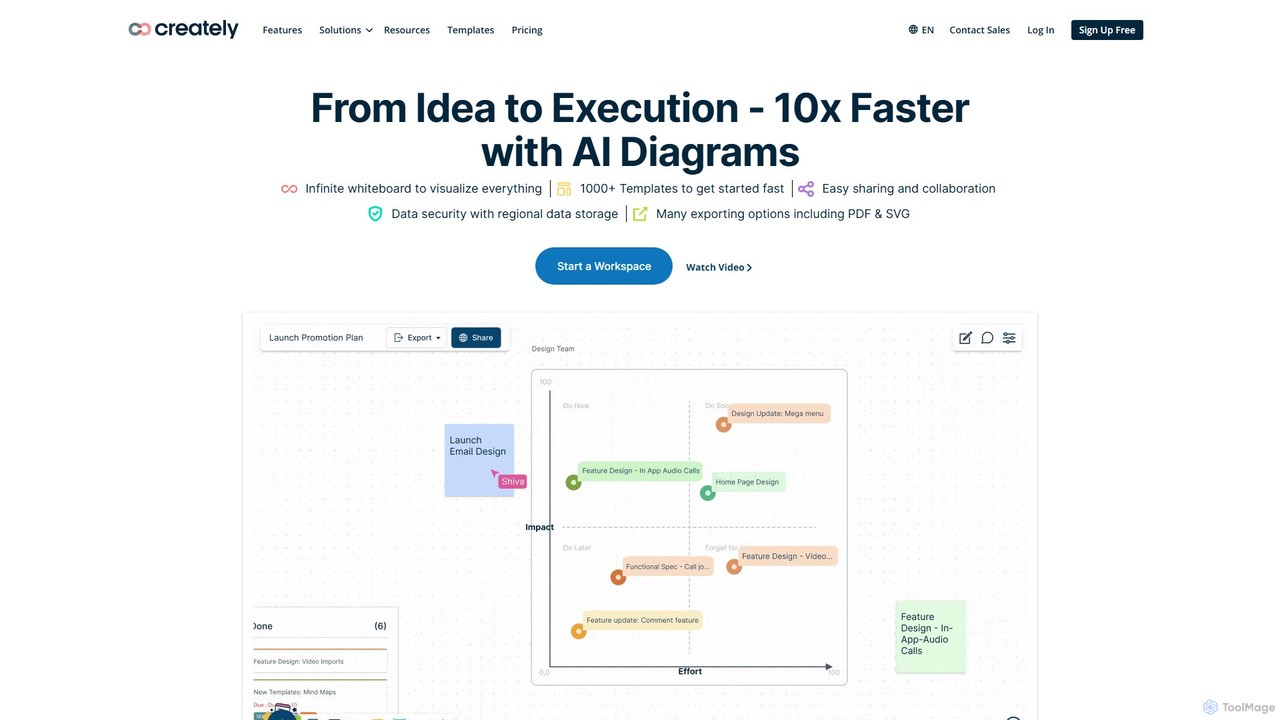
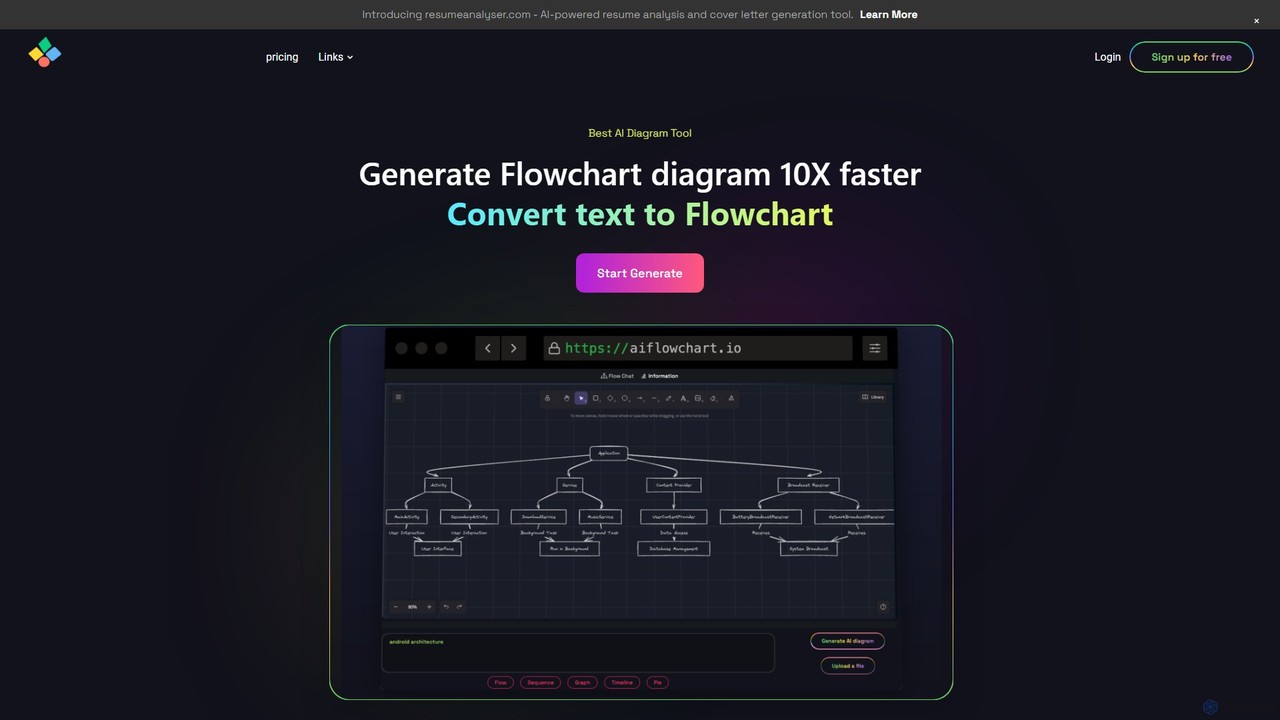
テキスト、PDF、ブログコンテンツからフローチャート、シーケンス図、円グラフなどを自動生成するAI搭載の作図ツールです。GPT-4oのようなモデルを活用し、説明付きのユニークでカスタマイズ可能な図を作成し、ユーザーの時間と労力を大幅に節約します。
視覚化
SnapDiagramは、テキスト記述を即座にプロフェッショナルな図に変換するAI搭載ツールです。簡単な自然言語プロンプトで、フローチャート、シーケンス図、UMLモデル、マインドマップなどを生成します。作図プロセスを自動化することで、開発者、ビジネスアナリスト、プロジェクトマネージャーのワークフローを加速させるように設計されています。
ワークフロー管理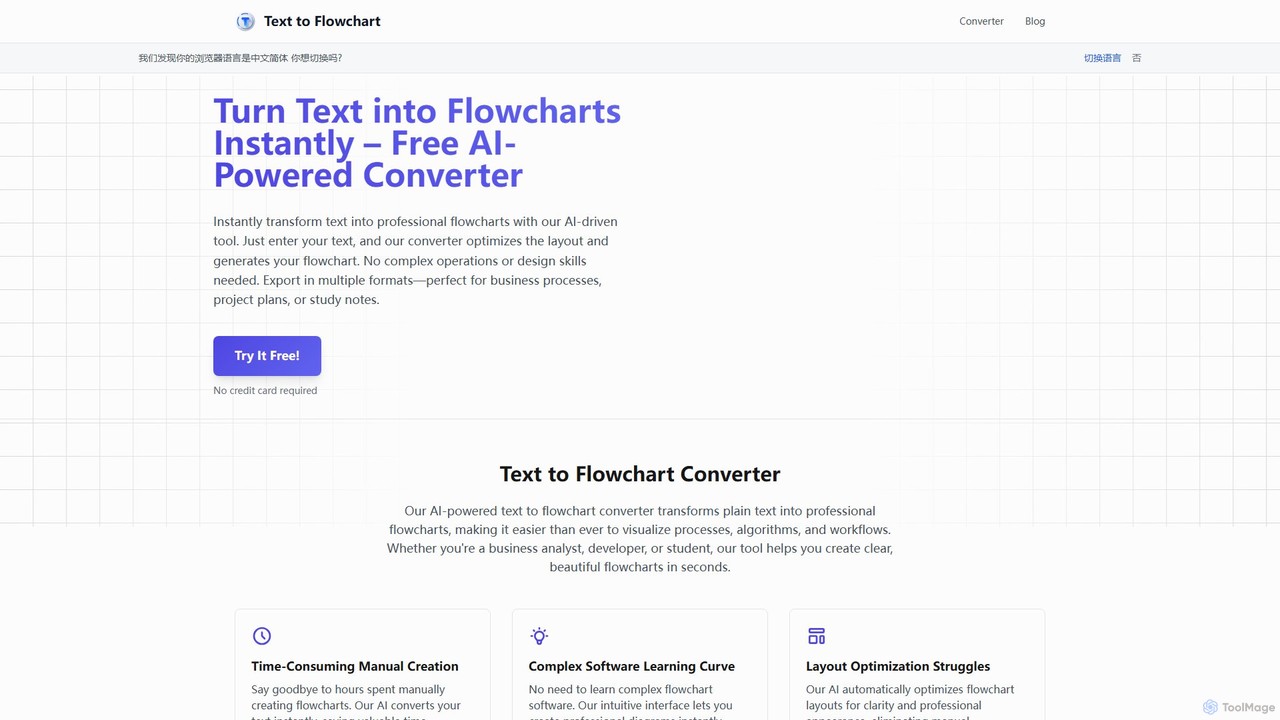
AIを活用し、プレーンテキストの記述をプロフェッショナルで構造化されたフローチャートや図に即座に変換するツールです。開発者、ビジネスアナリスト、学生に最適で、デザインスキル不要でプロセス、アルゴリズム、ワークフローの可視化を簡素化します。
プロセス管理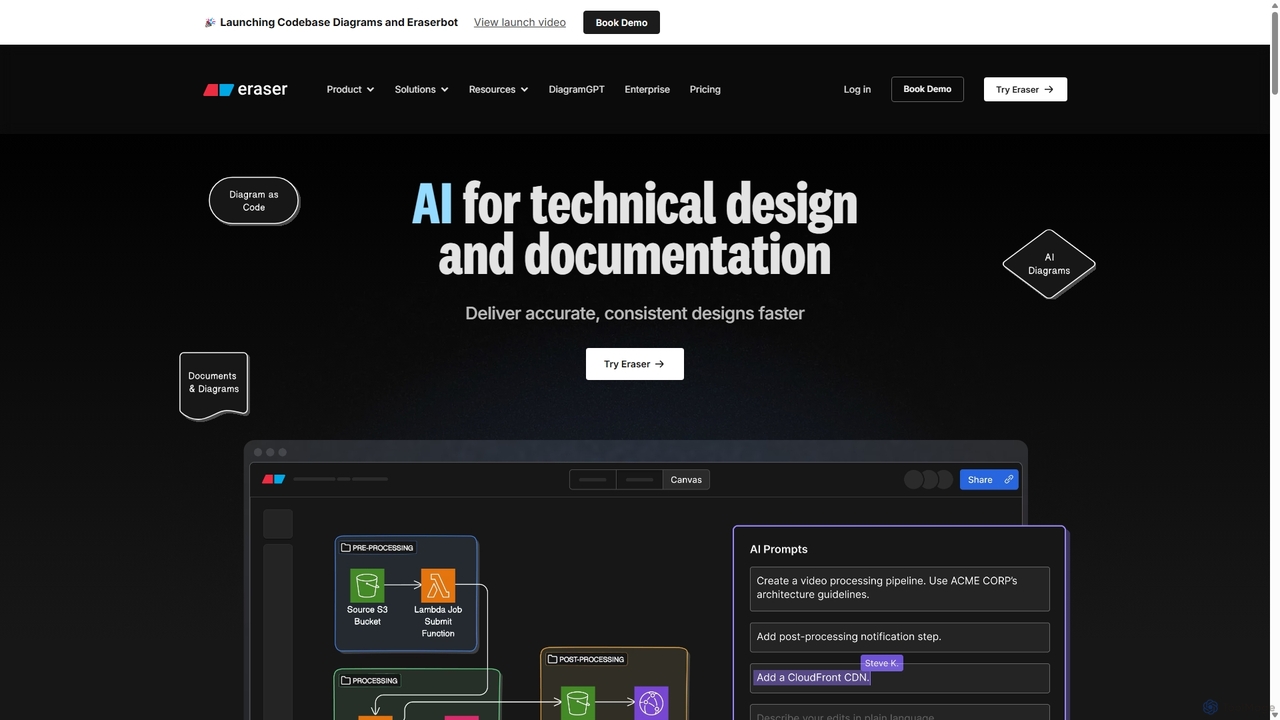
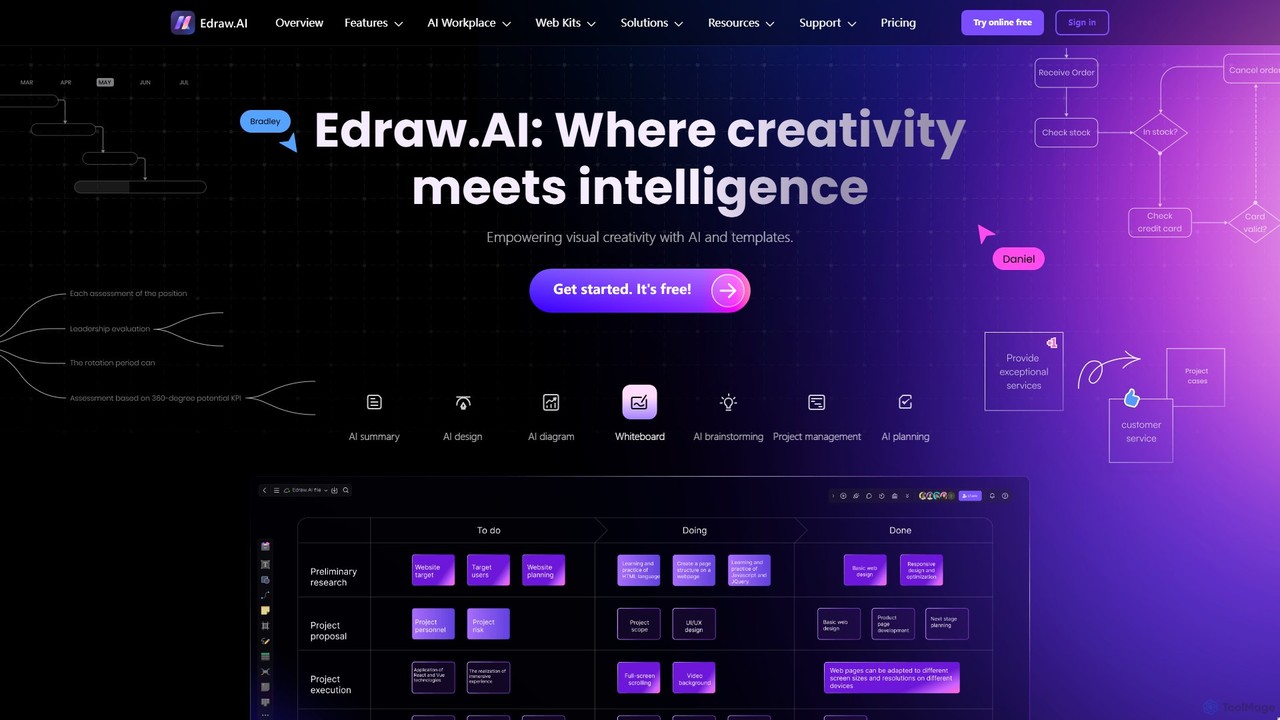
Edraw.AIは、AIを搭載したビジュアルコラボレーションプラットフォームで、ユーザーが図、マインドマップ、フローチャートなどのビジュアルを簡単に作成できます。ユーザーフレンドリーなインターフェースと、生成、分析、デザインのための強力なAIツールを組み合わせています。リアルタイムコラボレーション、豊富なテンプレートと記号のライブラリを特徴とし、プロジェクト管理、IT、マーケティング、教育などのチームの生産性を向上させるために設計されています。無料で始めて、あなたのアイデアをプロフェッショナルなビジュアルに変えましょう。
視覚化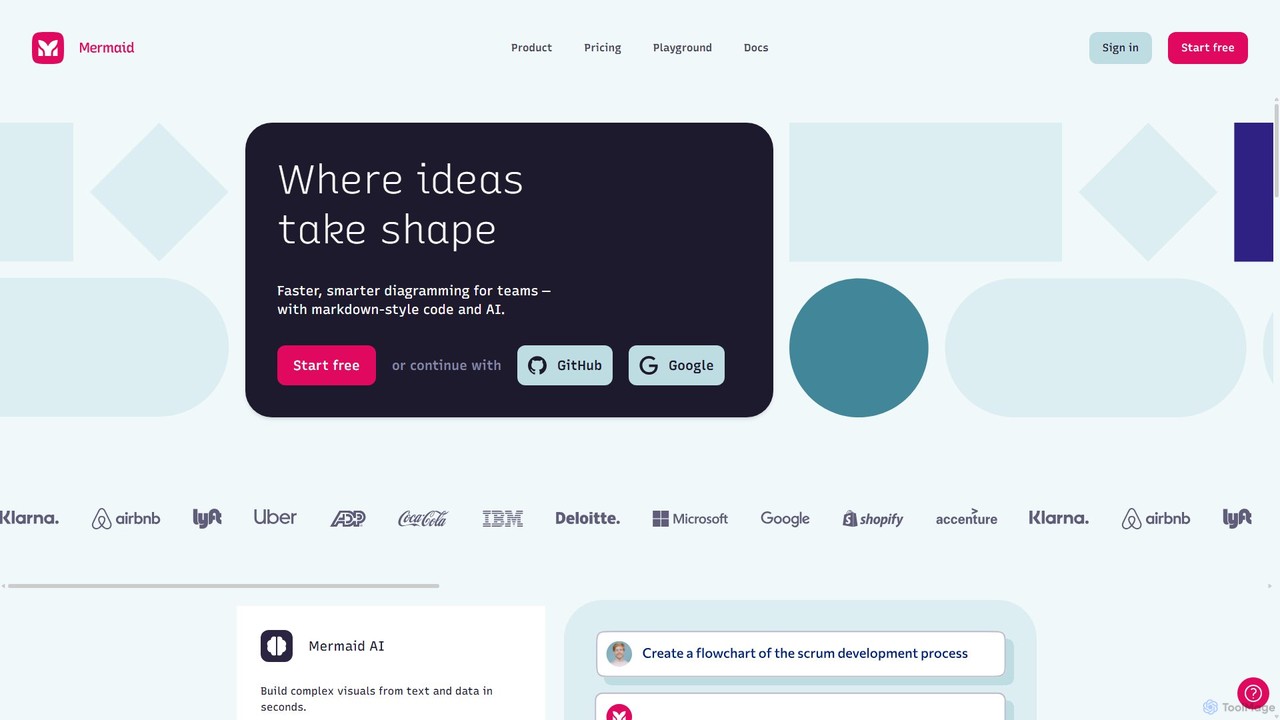
Mermaid Chartは、AIを活用した作図ツールで、チームがマークダウンスタイルのコード、自然言語プロンプト、またはビジュアルエディタを使用して、フローチャート、シーケンス図、マインドマップなどの複雑なビジュアルを迅速に作成できるようにします。より速く、よりスマートな作図とシームレスなコラボレーションのために設計されています。
コード生成
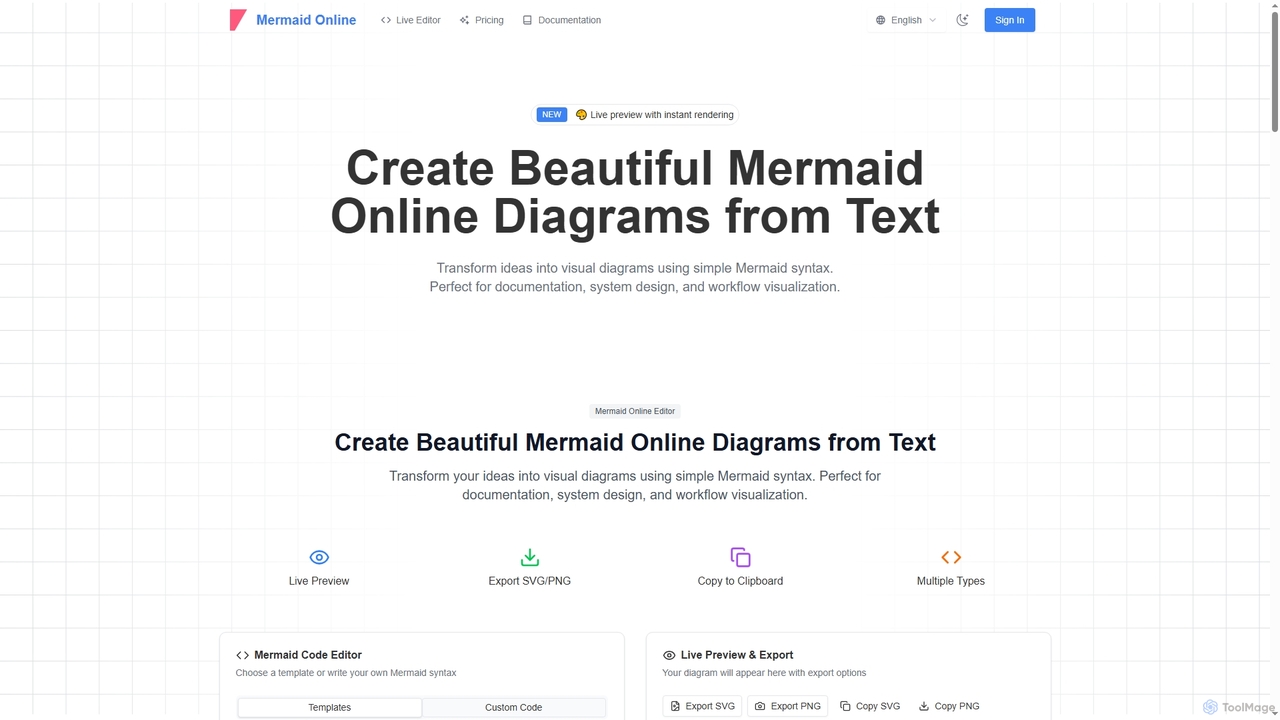
Mermaid Onlineは、テキスト記述とMermaid構文をプロフェッショナルな視覚ダイアグラムに変換する、高度なWebベースのエディターおよびAI搭載ダイアグラムジェネレーターです。多様なダイアグラムタイプをサポートし、リアルタイムプレビューと柔軟なエクスポートオプションを提供することで、個人やチームのドキュメント作成およびシステム設計ワークフローを効率化します。
テキストから図