Piktochart
データの可視化 · 919.7K 月間訪問数
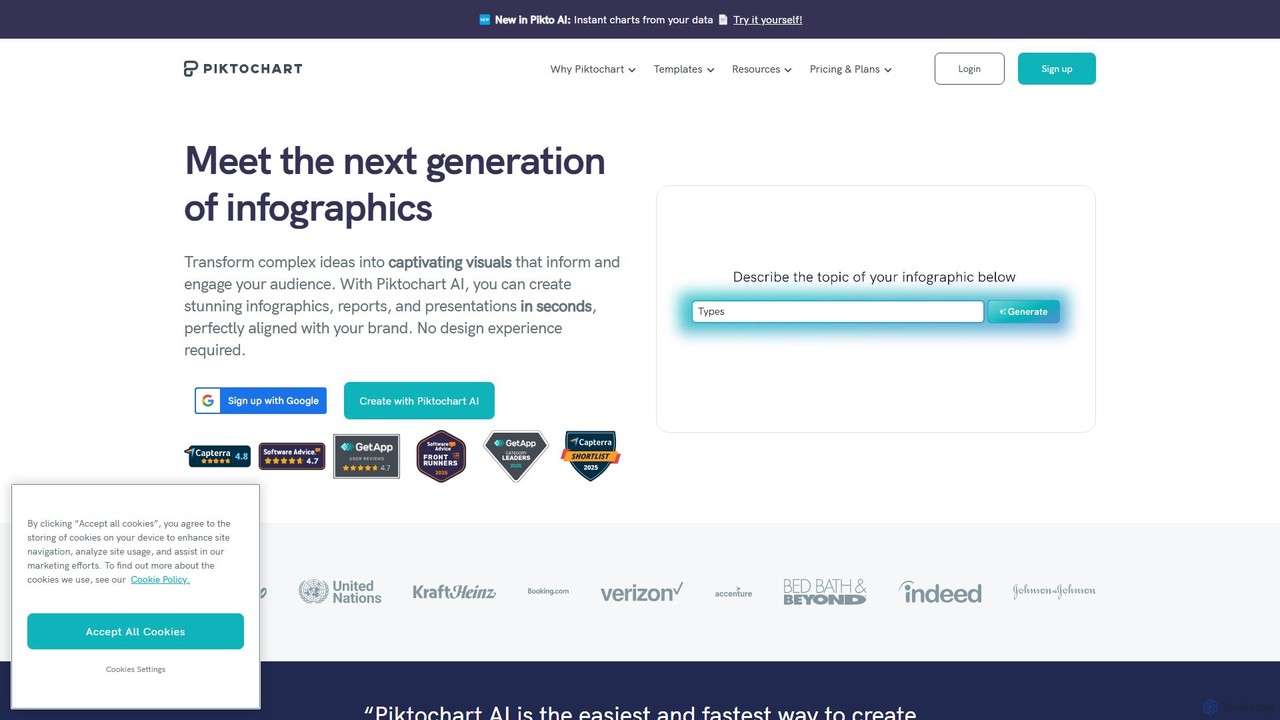
Piktochartは、AIで強化されたオールインワンのビジュアルコミュニケーションツールで、プロフェッショナルなインフォグラフィック、プレゼンテーション、レポート、ソーシャルメディアグラフィックを作成します。データ可視化とデザインを簡素化し、ユーザーがテキストやデータを魅力的なビジュアルに簡単に変換できるようにし、ブランドの一貫性とチームコラボレーション機能を提供します。
Piktochartは、AIで強化されたオールインワンのビジュアルコミュニケーションツールで、プロフェッショナルなインフォグラフィック、プレゼンテーション、レポート、ソーシャルメディアグラフィックを作成します。データ可視化とデザインを簡素化し、ユーザーがテキストやデータを魅力的なビジュアルに簡単に変換できるようにし、ブランドの一貫性とチームコラボレーション機能を提供します。
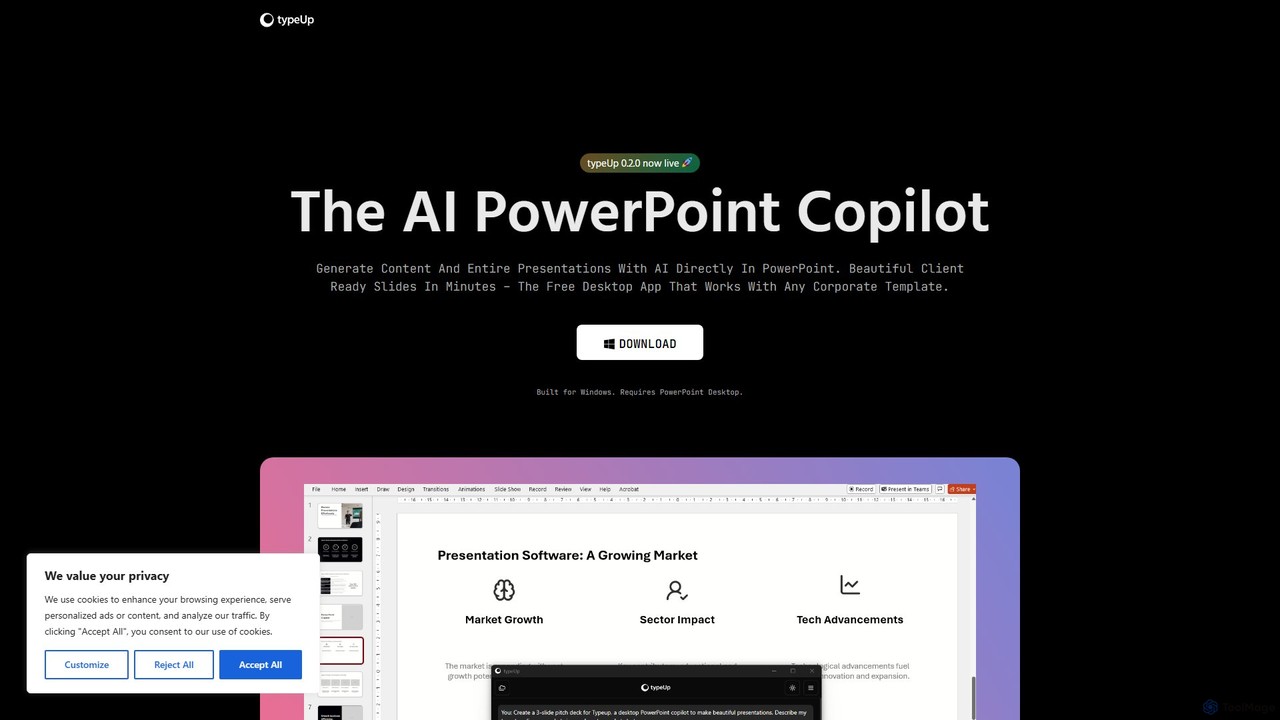
プレゼンテーションの作成と書式設定を10倍高速化する、PowerPoint向けのAI搭載コパイロットです。PowerPointと直接統合された無料のWindowsデスクトップアプリで、プロンプトからスライド全体を生成したり、豊富な画像、ロゴ、アイコンのライブラリにアクセスしたり、ブランドに準拠したレイアウトを即座に適用したりできます。
Piktochartは、AIで強化されたオールインワンのビジュアルコミュニケーションツールで、プロフェッショナルなインフォグラフィック、プレゼンテーション、レポート、ソーシャルメディアグラフィックを作成します。データ可視化とデザインを簡素化し、ユーザーがテキストやデータを魅力的なビジュアルに簡単に変換できるようにし、ブランドの一貫性とチームコラボレーション機能を提供します。
プレゼンテーションの作成と書式設定を10倍高速化する、PowerPoint向けのAI搭載コパイロットです。PowerPointと直接統合された無料のWindowsデスクトップアプリで、プロンプトからスライド全体を生成したり、豊富な画像、ロゴ、アイコンのライブラリにアクセスしたり、ブランドに準拠したレイアウトを即座に適用したりできます。
Compare Piktochart and typeUp by monthly reach, traffic trend, visit depth, top regions, and acquisition sources.
In the Piktochart vs typeUp monthly traffic comparison, Piktochart currently shows 919.7K visits and typeUp shows 4.1K; Piktochart has about 222.6 times the visible traffic of typeUp, an absolute difference of about 915.6K visits. This reflects visible reach, not feature quality or paid users.
Only Piktochart has complete third-party traffic details; typeUp uses visits recorded inside ToolMage. These scopes cannot estimate market share directly, and on-site views should not be treated as the product’s total website traffic.
| Country/region | Percentage | Traffic |
|---|---|---|
| 🇺🇸United States | 36.2% | 332.9K |
| 🇮🇳India | 19.05% | 175.2K |
| 🇲🇽Mexico | 17.13% | 157.5K |
| 🇨🇴Colombia | 15.31% | 140.8K |
| 🇧🇷Brazil | 12.31% | 113.2K |
| Source type | Percentage | Traffic |
|---|---|---|
| ダイレクト | 84.6% | 778.1K |
| 参照元 | 12.61% | 116K |
| Eメール | 2.79% | 25.7K |
This in-depth Piktochart vs typeUp comparison uses only the product records, taxonomy, audience, traffic, and community signals available on this page. Piktochart is primarily listed under “データの可視化”, while typeUp is primarily listed under “生産性ツール”, so the first decision is whether your actual task matches their recorded scope.
The structured fields currently show these decision-relevant differences: Primary category (Piktochart: データの可視化; typeUp: 生産性ツール); Product type (Piktochart: Website; typeUp: App); Pricing (Piktochart: Freemium; typeUp: Free); Monthly visits (Piktochart: 919.7K; typeUp: 4.1K); Favorites (Piktochart: 166; typeUp: 154). These facts are more useful for selection than brand visibility alone.
In the Piktochart vs typeUp monthly traffic comparison, Piktochart currently shows 919.7K visits and typeUp shows 4.1K; Piktochart has about 222.6 times the visible traffic of typeUp, an absolute difference of about 915.6K visits. This reflects visible reach, not feature quality or paid users.
Only Piktochart has complete third-party traffic details; typeUp uses visits recorded inside ToolMage. These scopes cannot estimate market share directly, and on-site views should not be treated as the product’s total website traffic.
The current traffic scope is not sufficient for a reliable product ranking. Treat monthly visits as a market-interest signal, then decide using taxonomy, use cases, pricing, and a like-for-like trial rather than reading exposure as product capability.
Piktochart and typeUp currently overlap in shared categories: グラフィック、プレゼンテーション; shared tags: プレゼンテーション. This can place both on the same shortlist, but it does not prove equal implementation, depth, or cost.
Piktochart's unique categories/tags are データの可視化、ソーシャルメディア、AIデザイン、ブランドキット、チャートメーカー、データ視覚化、フローチャート、インフォグラフィックメーカー; typeUp's are 生産性ツール、AIアシスタント、ビジネス、デザイン自動化、パワーポイント、生産性、スライド生成、Windowsアプリ. These unique fields are the strongest differentiators: validate the product whose recorded scope matches the task instead of following traffic alone.
Piktochart has no verified rating, 0 comments, 166 favorites, and 157 likes;typeUp has no verified rating, 0 comments, 154 favorites, and 169 likes。
Neither product has enough rating or comment samples for a credible reputation ranking.
Put Piktochart on the priority trial list when the task aligns with “データの可視化” and especially データの可視化、ソーシャルメディア、AIデザイン、ブランドキット、チャートメーカー、データ視覚化. This follows recorded positioning and does not imply unlisted capabilities are absent.
Piktochart also currently records: pricing is freemium, product type is website, 919.7K verified monthly visits, no verified user rating. Verify any hard requirement around price, platform, or reach before trial, and do not let sparse review data substitute for testing.
Put typeUp on the priority trial list when the task aligns with “生産性ツール” and especially 生産性ツール、AIアシスタント、ビジネス、デザイン自動化、パワーポイント、生産性. This follows recorded positioning and does not imply unlisted capabilities are absent.
typeUp also currently records: pricing is free, product type is app, 4.1K on-site monthly views, no verified user rating. Verify any hard requirement around price, platform, or reach before trial, and do not let sparse review data substitute for testing.
The available data describes positioning, public visibility, and community signals, but it cannot prove output quality, speed, integration effort, privacy, or long-term cost in your workflow. Before deciding, run the same representative tasks in Piktochart and typeUp, then record completion time, accuracy, manual corrections, and the real paid threshold. A like-for-like trial turns this comparison into a defensible adoption decision.
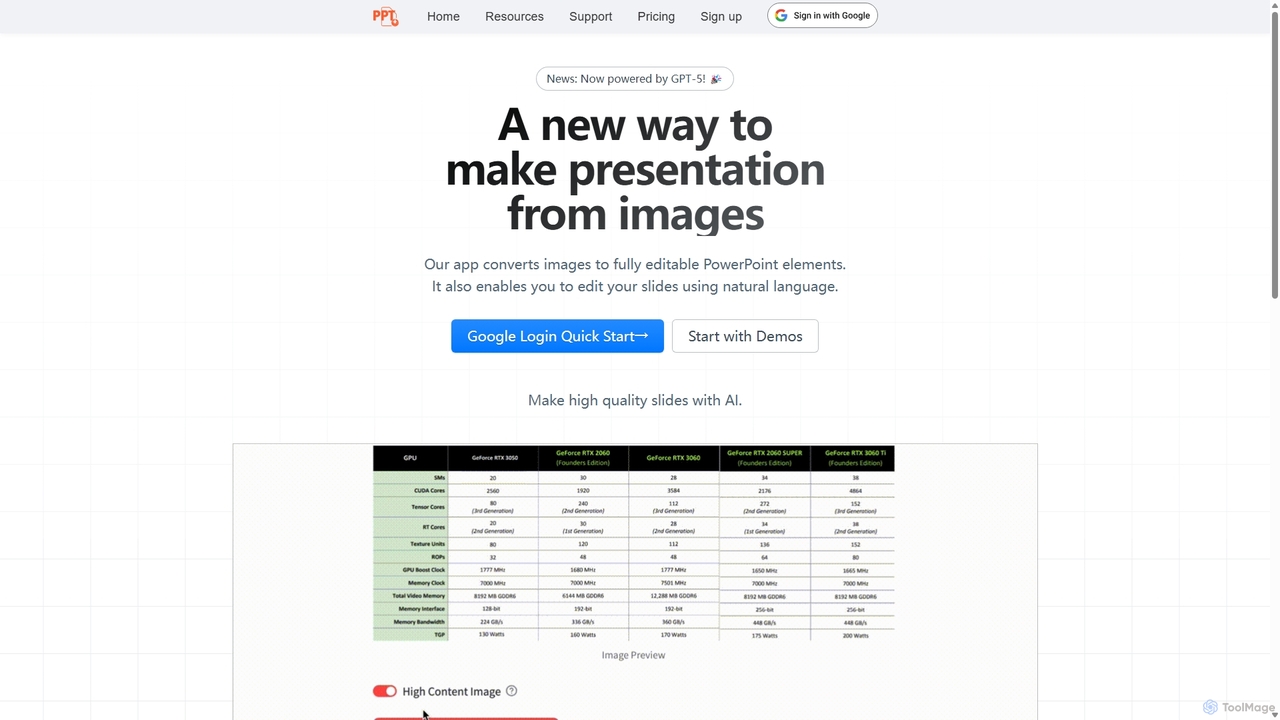
Edit in PPTは、画像、スクリーンショット、静的なスライドを完全に編集可能なPowerPointプレゼンテーションに変換するAI搭載ツールです。高度なビジョンモデルを使用してテキスト、グラフ、図形を認識し、ユーザーの手作業による再作成時間を数時間節約します。また、自然言語コマンドによるスライド編集機能も備えており、プレゼンテーション作成プロセス全体を効率化します。
自動化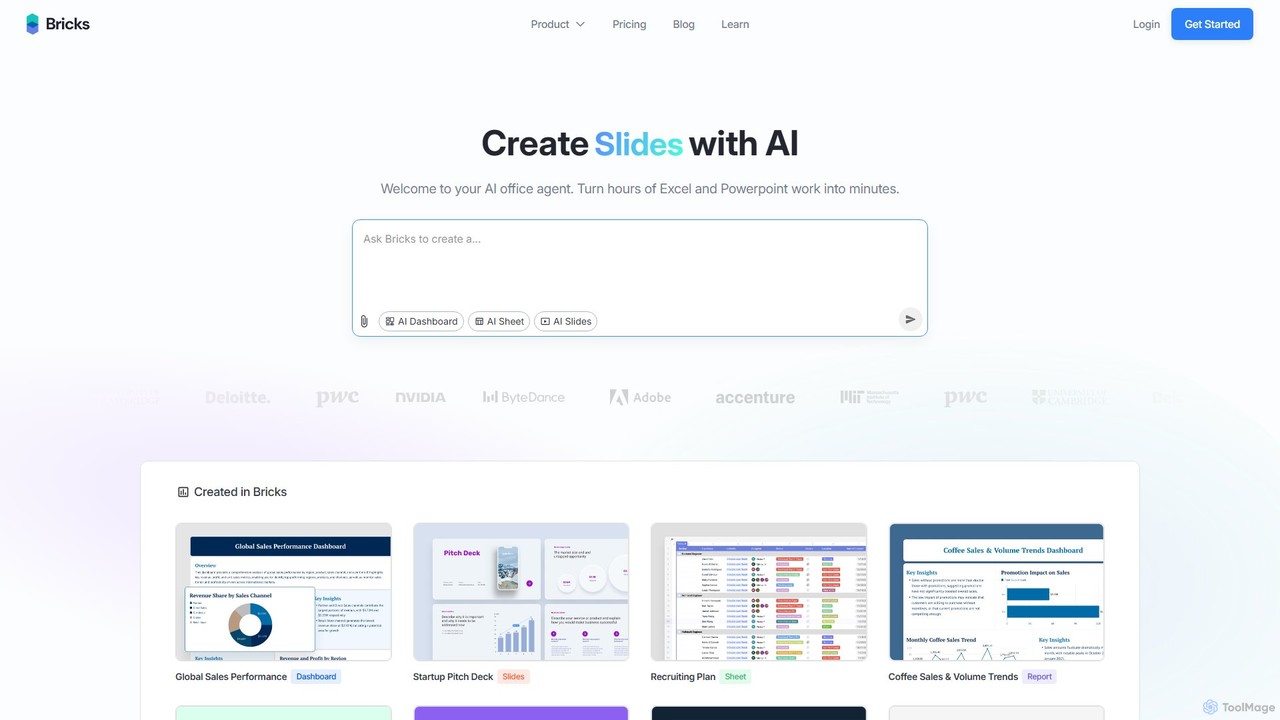
thebricksは、データ分析とレポート作成を変革するAI搭載のワークスペースです。ユーザーは簡単な自然言語のプロンプトを使用して、インタラクティブなダッシュボード、動的なスプレッドシート、プロフェッショナルなスライドを作成できます。ExcelやPowerPointでの数時間にわたる手作業を数分に短縮し、ワークフローを合理化して生産性を向上させます。
ビジネスインテリジェンス
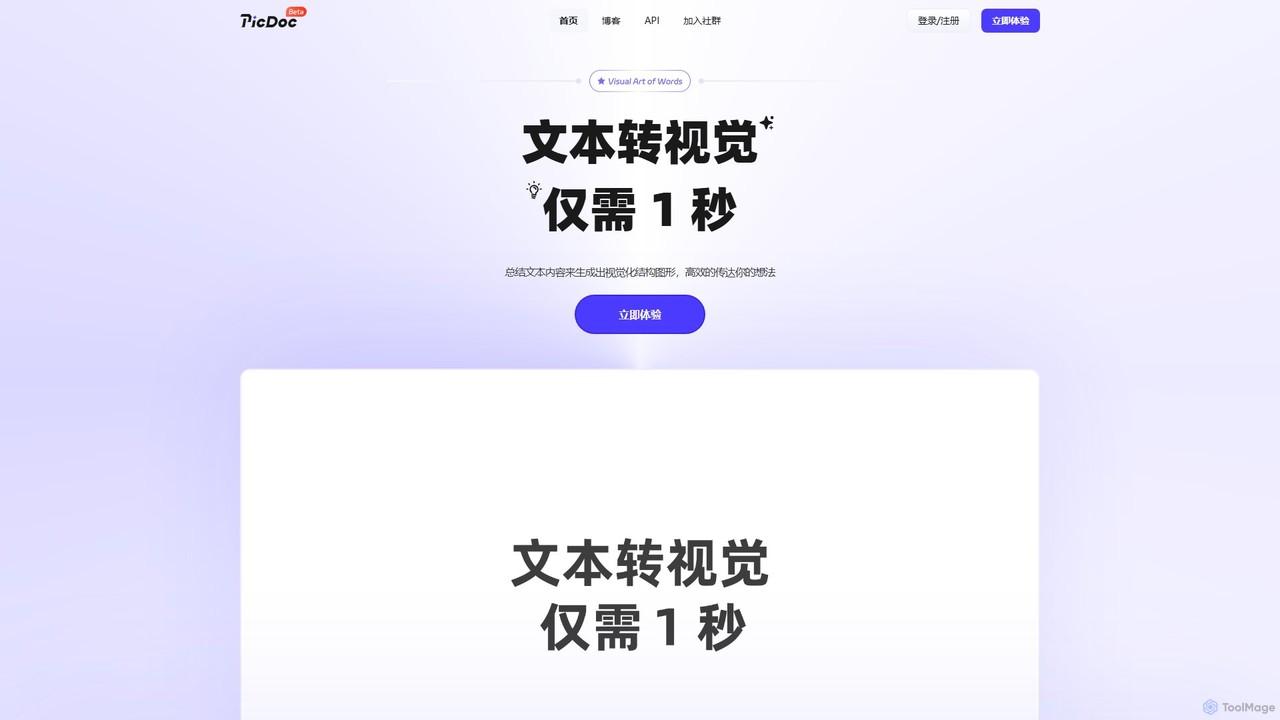
PicDocは、テキストを美しいインフォグラフィック、フローチャート、図表に即座に変換するAI搭載のテキストビジュアル化ツールです。コンテンツを入力するだけで、PicDocのAIが数秒で分析、要約、視覚化し、複雑なアイデアを効果的に伝え、デザインスキルなしでプロ級のビジュアルを作成するのに役立ちます。
インフォグラフィックス
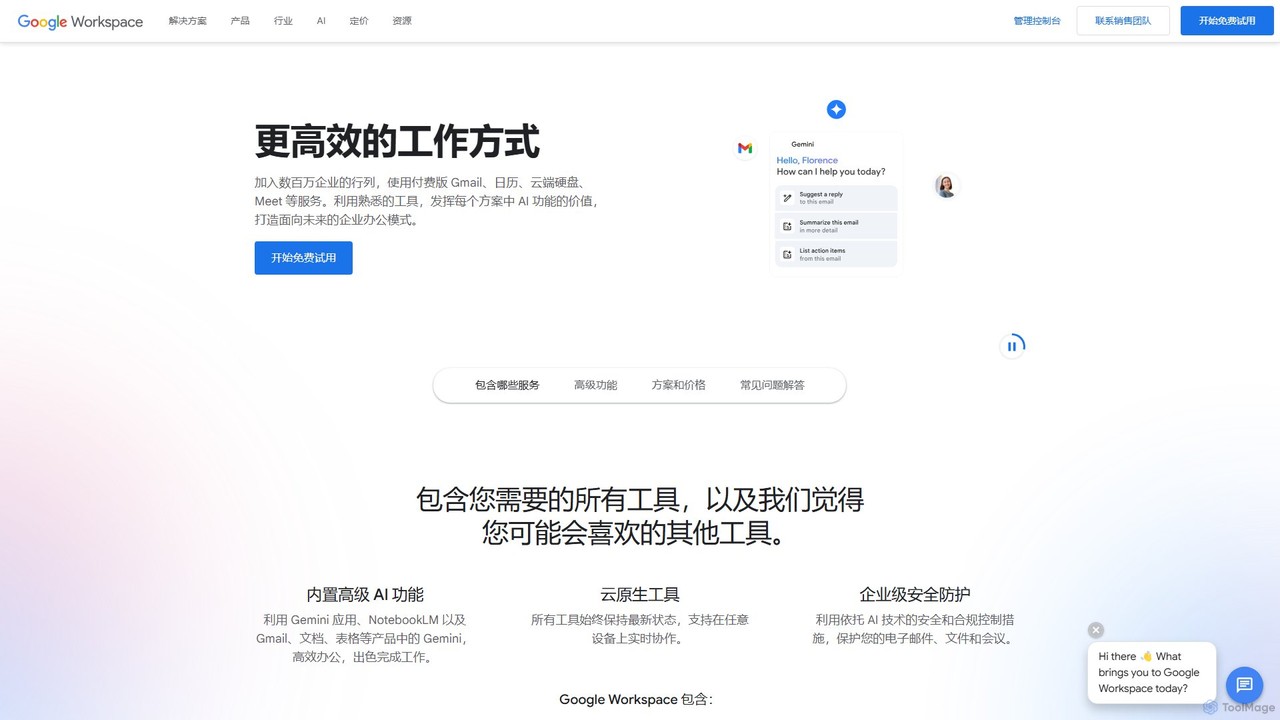
Google Workspaceは、Google AIを搭載した、安全でクラウドネイティブなコラボレーションおよび生産性向上アプリの統合スイートです。Gmail、ドキュメント、ドライブ、カレンダー、Meetなどが含まれ、あらゆる規模のチームがどのデバイスからでも効率的かつ安全に接続、作成、共同作業できるよう設計されています。
オフィススイート
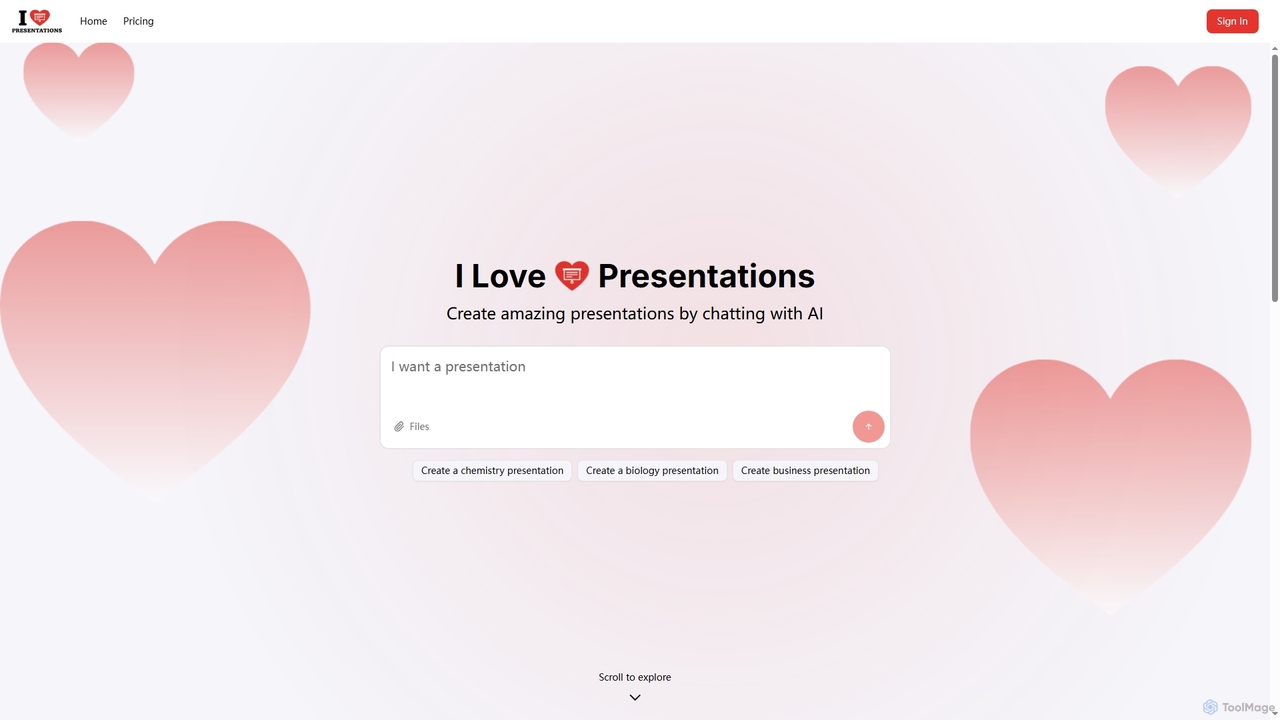
iLovePresentationsは、プレゼンテーション作成を簡素化するために設計された革新的なAI搭載ツールです。ユーザーはAIとチャットするだけで、希望するコンテンツを説明し、プロフェッショナルなスライドを生成できます。化学や生物学のような学術的なテーマからビジネスレポートまで、さまざまな目的で魅力的なプレゼンテーションを迅速かつ効率的に作成する方法を提供します。
マーケティング

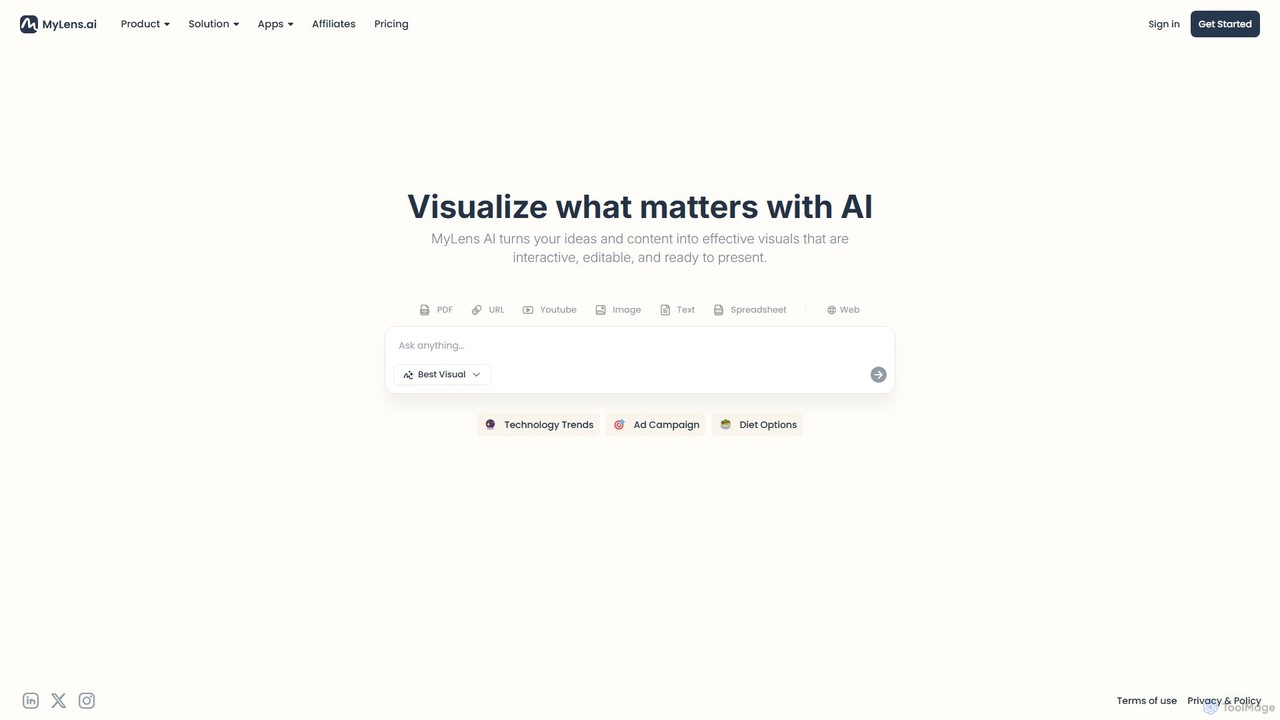
MyLensは、テキスト、データ、アイデアをインタラクティブで編集可能、そしてプレゼンテーションに最適なビジュアルに変換するAI搭載の視覚化プラットフォームです。魅力的なインフォグラフィック、チャート、図、プレゼンテーションを簡単に作成し、複雑な情報を明確かつ効果的に伝えます。
インフォグラフィックス