

ToolMage
ログイン
Rollstack
ビジネスインテリジェンス · 17.4K 月間訪問数

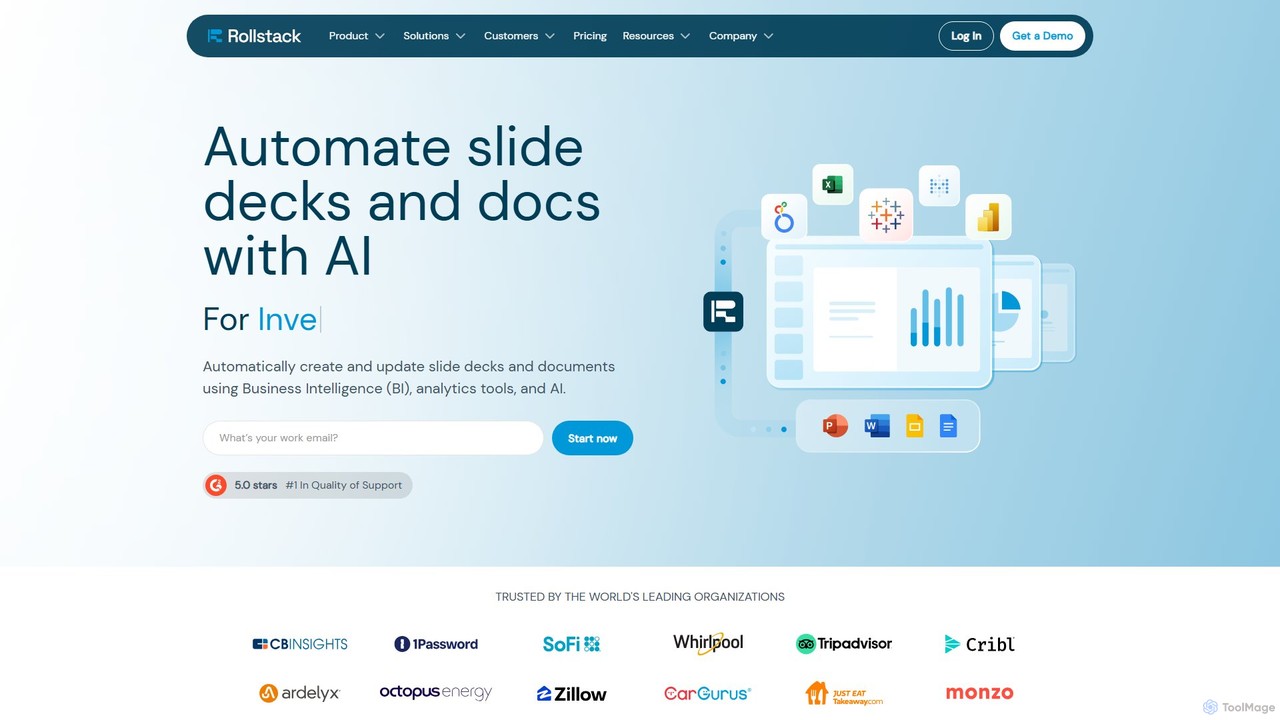
Rollstackは、ビジネスインテリジェンスツール(Tableau、Power BI、Lookerなど)やデータウェアハウス(Snowflake)をPowerPointやGoogleスライドに直接接続する自動化プラットフォームです。手作業によるデータ入力やスクリーンショットを不要にし、チームがデータ駆動型のプレゼンテーションを自動で作成・更新できるようにします。これにより、大幅な時間節約、エラー削減、そして常に最新データに基づいたレポート作成が保証されます。
VS
thebricks
ビジネスインテリジェンス · 251.6K 月間訪問数

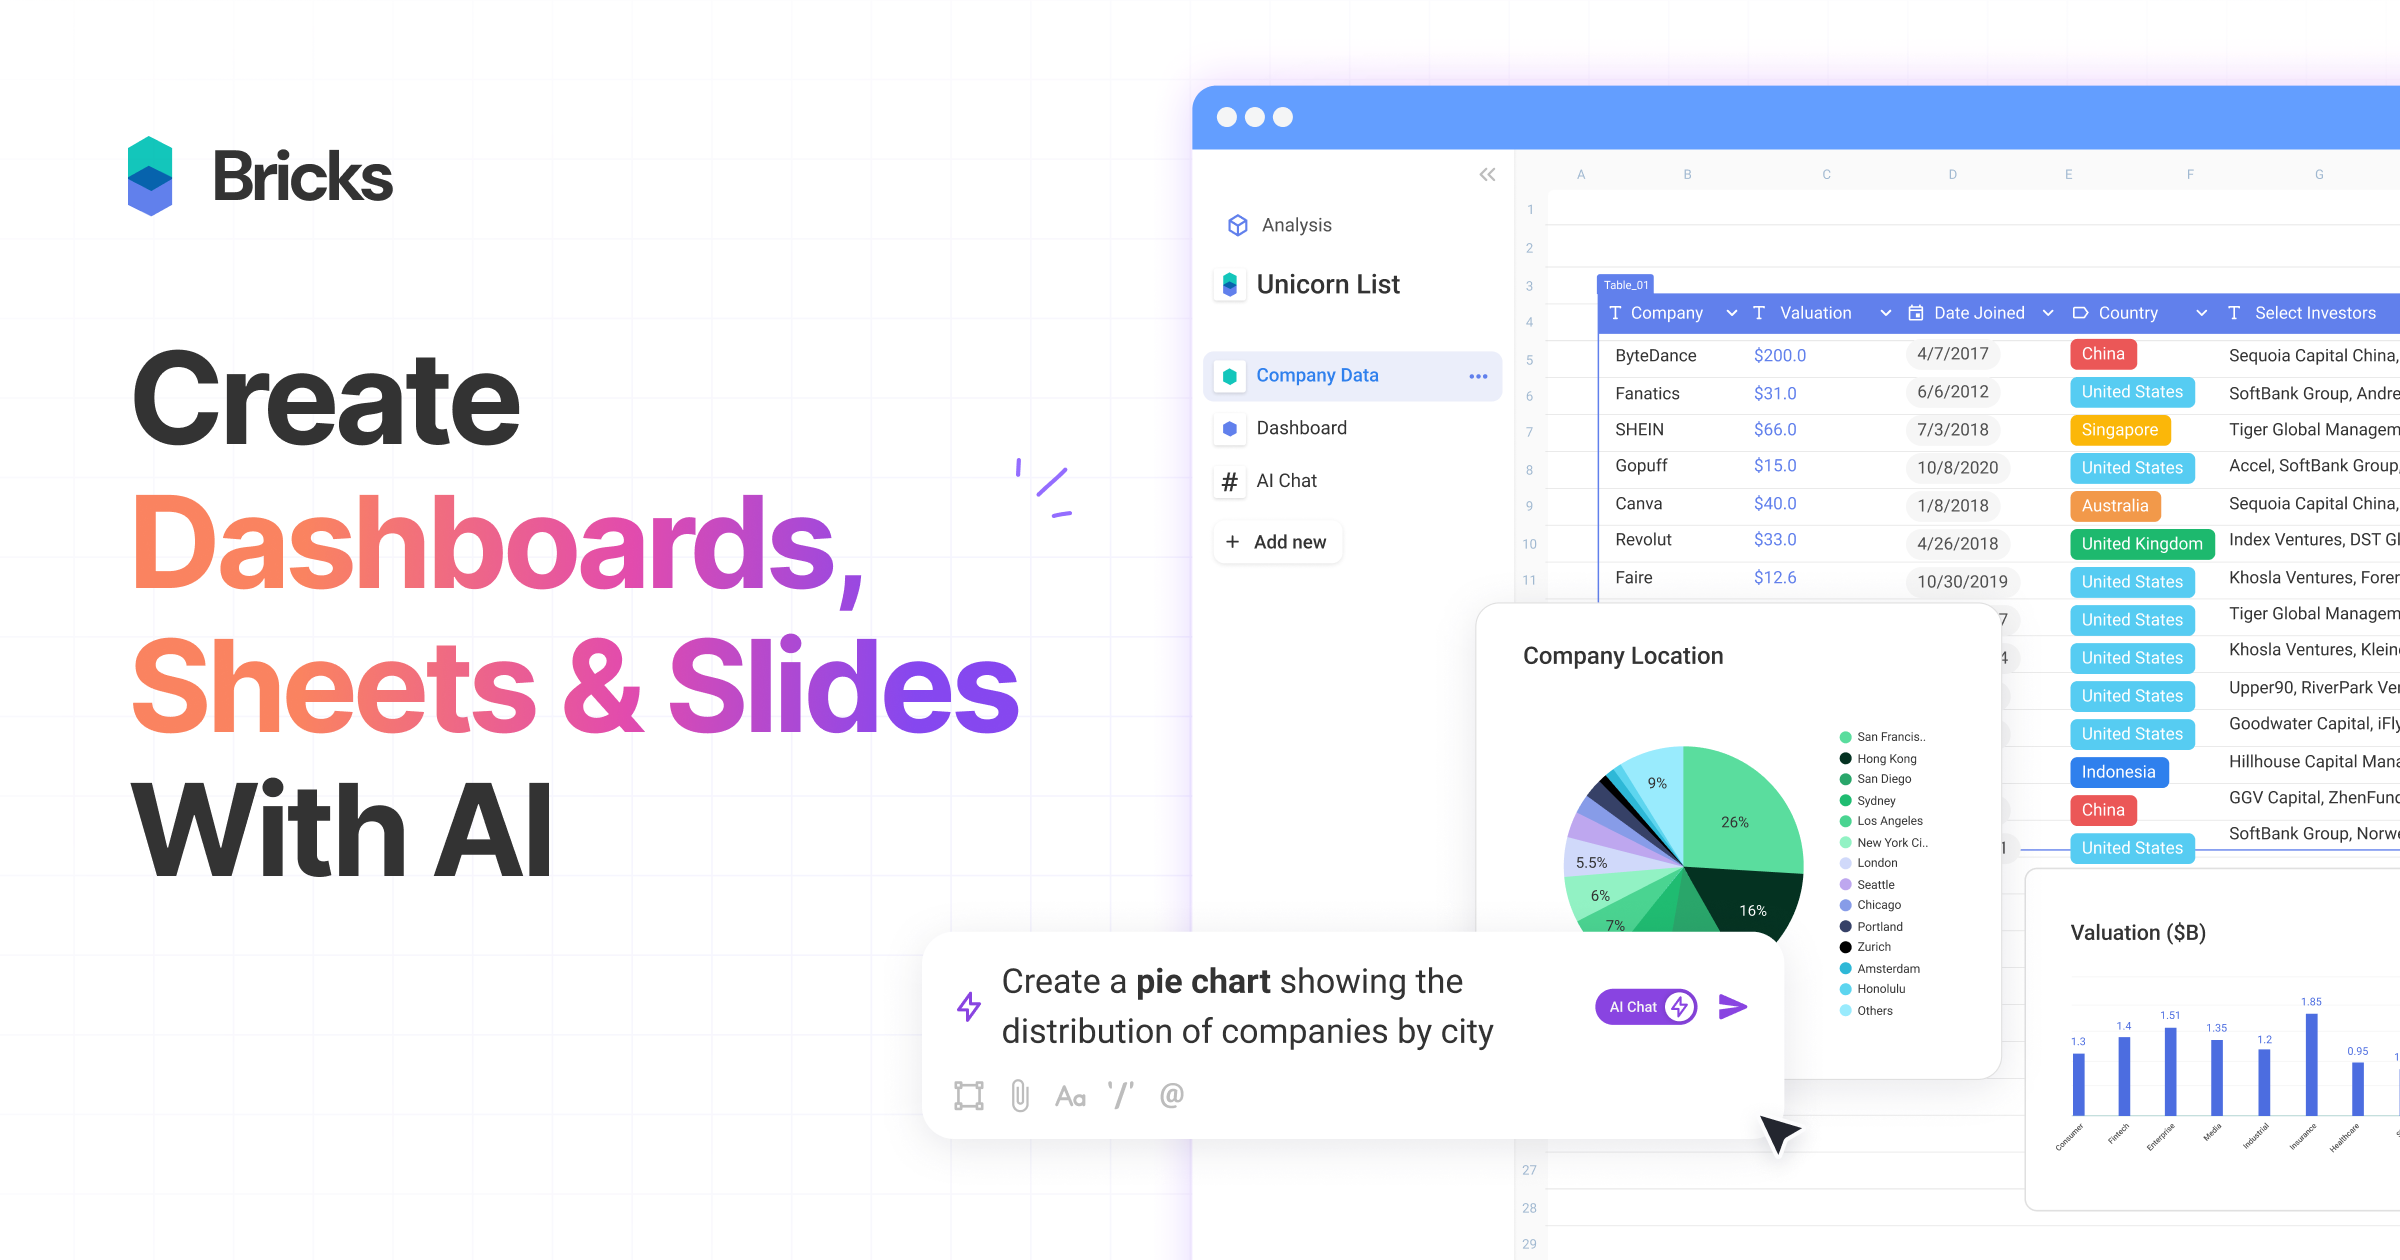
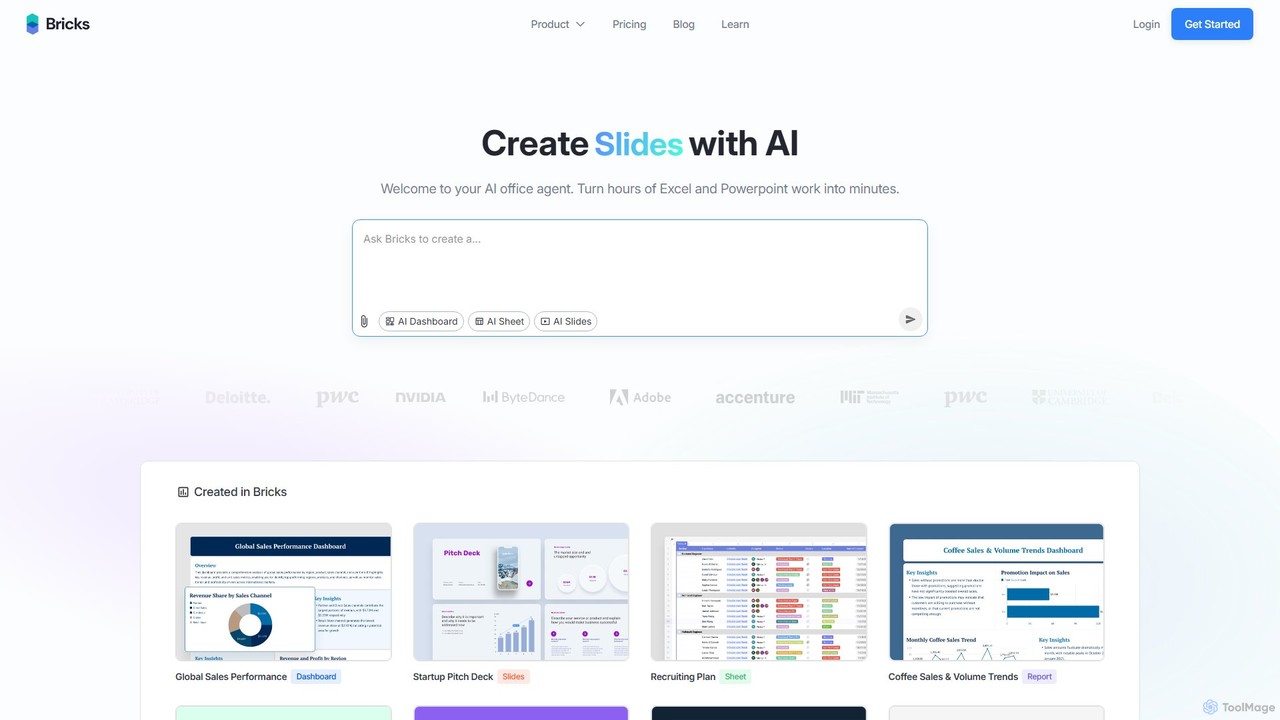
thebricksは、データ分析とレポート作成を変革するAI搭載のワークスペースです。ユーザーは簡単な自然言語のプロンプトを使用して、インタラクティブなダッシュボード、動的なスプレッドシート、プロフェッショナルなスライドを作成できます。ExcelやPowerPointでの数時間にわたる手作業を数分に短縮し、ワークフローを合理化して生産性を向上させます。

Rollstack vs thebricks:価格・機能・トラフィック比較

製品情報、分類、トラフィック、ユーザー反応に基づいて Rollstack と thebricks を比較します。

更新 2026/08/05

製品概要

Rollstack 製品概要

Rollstackは、ビジネスインテリジェンスツール(Tableau、Power BI、Lookerなど)やデータウェアハウス(Snowflake)をPowerPointやGoogleスライドに直接接続する自動化プラットフォームです。手作業によるデータ入力やスクリーンショットを不要にし、チームがデータ駆動型のプレゼンテーションを自動で作成・更新できるようにします。これにより、大幅な時間節約、エラー削減、そして常に最新データに基づいたレポート作成が保証されます。
Preview

thebricks 製品概要

thebricksは、データ分析とレポート作成を変革するAI搭載のワークスペースです。ユーザーは簡単な自然言語のプロンプトを使用して、インタラクティブなダッシュボード、動的なスプレッドシート、プロフェッショナルなスライドを作成できます。ExcelやPowerPointでの数時間にわたる手作業を数分に短縮し、ワークフローを合理化して生産性を向上させます。

Preview

Detailed feature comparison

FeatureRollstackthebricks
主要カテゴリービジネスインテリジェンスビジネスインテリジェンス
追加日2025-08-092025-08-11
価格有料フリーミアム
公式サイトwww.rollstack.comwww.thebricks.com
製品タイプウェブサイトウェブサイト
Performance data
ユーザー評価未確認未確認
コメント00
月間訪問数17.4K251.6K
月間成長率-7.9%-23.6%
お気に入り116115
Details詳細を見る詳細を見る

Rollstack vs thebricks monthly traffic

Compare Rollstack and thebricks by monthly reach, traffic trend, visit depth, top regions, and acquisition sources.

How to interpret the traffic data

In the Rollstack vs thebricks monthly traffic comparison, Rollstack currently shows 17.4K visits and thebricks shows 251.6K; thebricks has about 14.4 times the visible traffic of Rollstack, an absolute difference of about 234.2K visits. This reflects visible reach, not feature quality or paid users.

Both tools provide verified traffic details, so monthly trends, visit depth, regions, and acquisition sources can be compared on the same basis.

Rollstack monthly traffic:

Latest traffic

月間訪問数
17.4K
平均滞在時間
1:08
訪問あたりページ数
1.88
直帰率
36.21%
Data updated 2026-06-15

Monthly traffic trend

  • 2025/9: 19.8K 月間訪問数
  • 2026/1: 20.2K 月間訪問数
  • 2026/2: 19.6K 月間訪問数
  • 2026/3: 20.8K 月間訪問数
  • 2026/4: 18.9K 月間訪問数
  • 2026/5: 17.4K 月間訪問数

主要地域

Top 5 countries/regions
Country/regionPercentageTraffic
🇺🇸United States51.29%8.9K
🇮🇳India17.69%3.1K
🇩🇪Germany11.83%2.1K
🇮🇩Indonesia10.38%1.8K
🇧🇷Brazil8.81%1.5K

検索キーワード

graphs in excel powerpointhow to recreate a chart in powerpoint when the source file movedimbedding a workable excel spreadheet in power pointrollstacktableau conference 2026

thebricks monthly traffic:

Latest traffic

月間訪問数
251.6K
平均滞在時間
3:30
訪問あたりページ数
3.1
直帰率
48.17%
Data updated 2026-06-15

Monthly traffic trend

  • 2025/9: 706.4K 月間訪問数
  • 2026/1: 493.4K 月間訪問数
  • 2026/2: 382K 月間訪問数
  • 2026/3: 414.7K 月間訪問数
  • 2026/4: 329.3K 月間訪問数
  • 2026/5: 251.6K 月間訪問数

主要地域

Top 5 countries/regions
Country/regionPercentageTraffic
🇺🇸United States51.54%129.7K
🇨🇦Canada19.43%48.9K
🇮🇳India11.5%28.9K
🇬🇧United Kingdom10.12%25.5K
🇻🇳Vietnam7.41%18.6K

流入元

Source typePercentageTraffic
ダイレクト78.94%198.6K
参照元16.45%41.4K
Eメール4.61%11.6K

検索キーワード

bricksbricks aiportrait spreadsheetremove extra enters in cell excelthebricks
Traffic-based selection guidance: If public market visibility is an important first-pass criterion, investigate thebricks first. The final choice should still follow taxonomy, use case, and a real trial because higher traffic does not prove broader capabilities or better workflow fit.

Usage comparison

Compare the core capabilities of Rollstack and thebricks

Rollstack Core features

ビジネスインテリジェンス
プレゼンテーション
自動化
レポート

thebricks Core features

ビジネスインテリジェンス
プレゼンテーション
データの可視化
スプレッドシート

Use cases

Rollstack Use cases

ビジネスインテリジェンス
データ視覚化
自動レポート
データレポート
Google スライド
Looker
Power BI
PowerPoint 自動化
プレゼンテーション自動化
QBR
雪の結晶
タブロー

thebricks Use cases

ビジネスインテリジェンス
データ視覚化
AIアシスタント
ダッシュボード
データ分析
ノーコード
プレゼンテーション
生産性
レポート
スプレッドシート

Rollstack vs thebricks:In-depth comparison and selection guidance

First decide whether the products solve the same kind of need

This in-depth Rollstack vs thebricks comparison uses only the product records, taxonomy, audience, traffic, and community signals available on this page. Rollstack is primarily listed under “ビジネスインテリジェンス”, while thebricks is primarily listed under “ビジネスインテリジェンス”, so the first decision is whether your actual task matches their recorded scope.

The structured fields currently show these decision-relevant differences: Pricing (Rollstack: Paid; thebricks: Freemium); Monthly visits (Rollstack: 17.4K; thebricks: 251.6K); Monthly growth (Rollstack: -7.9%; thebricks: -23.6%); Favorites (Rollstack: 116; thebricks: 115); Website (Rollstack: www.rollstack.com; thebricks: www.thebricks.com). These facts are more useful for selection than brand visibility alone.

What market visibility and monthly traffic mean

In the Rollstack vs thebricks monthly traffic comparison, Rollstack currently shows 17.4K visits and thebricks shows 251.6K; thebricks has about 14.4 times the visible traffic of Rollstack, an absolute difference of about 234.2K visits. This reflects visible reach, not feature quality or paid users.

Both tools provide verified traffic details, so monthly trends, visit depth, regions, and acquisition sources can be compared on the same basis.

If public market visibility is an important first-pass criterion, investigate thebricks first. The final choice should still follow taxonomy, use case, and a real trial because higher traffic does not prove broader capabilities or better workflow fit.

Product positioning, use cases, and roles

Rollstack and thebricks currently overlap in shared categories: ビジネスインテリジェンス、プレゼンテーション; shared tags: ビジネスインテリジェンス、データ視覚化. This can place both on the same shortlist, but it does not prove equal implementation, depth, or cost.

Rollstack's unique categories/tags are 自動化、レポート、自動レポート、データレポート、Google スライド、Looker、Power BI、PowerPoint 自動化; thebricks's are データの可視化、スプレッドシート、AIアシスタント、ダッシュボード、データ分析、ノーコード、プレゼンテーション、生産性. These unique fields are the strongest differentiators: validate the product whose recorded scope matches the task instead of following traffic alone.

What ratings, comments, and favorites can tell you

Rollstack has no verified rating, 0 comments, 116 favorites, and 121 likes;thebricks has no verified rating, 0 comments, 115 favorites, and 131 likes。

Neither product has enough rating or comment samples for a credible reputation ranking.

Selection guidance by actual need

When to evaluate Rollstack first

Put Rollstack on the priority trial list when the task aligns with “ビジネスインテリジェンス” and especially 自動化、レポート、自動レポート、データレポート、Google スライド、Looker. This follows recorded positioning and does not imply unlisted capabilities are absent.

Rollstack also currently records: pricing is paid, product type is website, 17.4K verified monthly visits, no verified user rating. Verify any hard requirement around price, platform, or reach before trial, and do not let sparse review data substitute for testing.

When to evaluate thebricks first

Put thebricks on the priority trial list when the task aligns with “ビジネスインテリジェンス” and especially データの可視化、スプレッドシート、AIアシスタント、ダッシュボード、データ分析、ノーコード. This follows recorded positioning and does not imply unlisted capabilities are absent.

thebricks also currently records: pricing is freemium, product type is website, 251.6K verified monthly visits, no verified user rating. Verify any hard requirement around price, platform, or reach before trial, and do not let sparse review data substitute for testing.

How to validate the recommendation before deciding

The available data describes positioning, public visibility, and community signals, but it cannot prove output quality, speed, integration effort, privacy, or long-term cost in your workflow. Before deciding, run the same representative tasks in Rollstack and thebricks, then record completion time, accuracy, manual corrections, and the real paid threshold. A like-for-like trial turns this comparison into a defensible adoption decision.

比較 FAQ

How should I choose between Rollstack and thebricks?
Compare positioning, pricing, taxonomy, and traffic maturity, then verify the latest details on each official website.
Where does this comparison data come from?
The factual baseline is derived from product, taxonomy, traffic, and community data. Reviewed editorial conclusions show their source and verification date.
What do unknown fields mean?
Unknown means there is not enough reliable evidence; the page does not fill gaps with assumptions.