VisActor
ライブラリとフレームワーク · 22.3K 月間訪問数
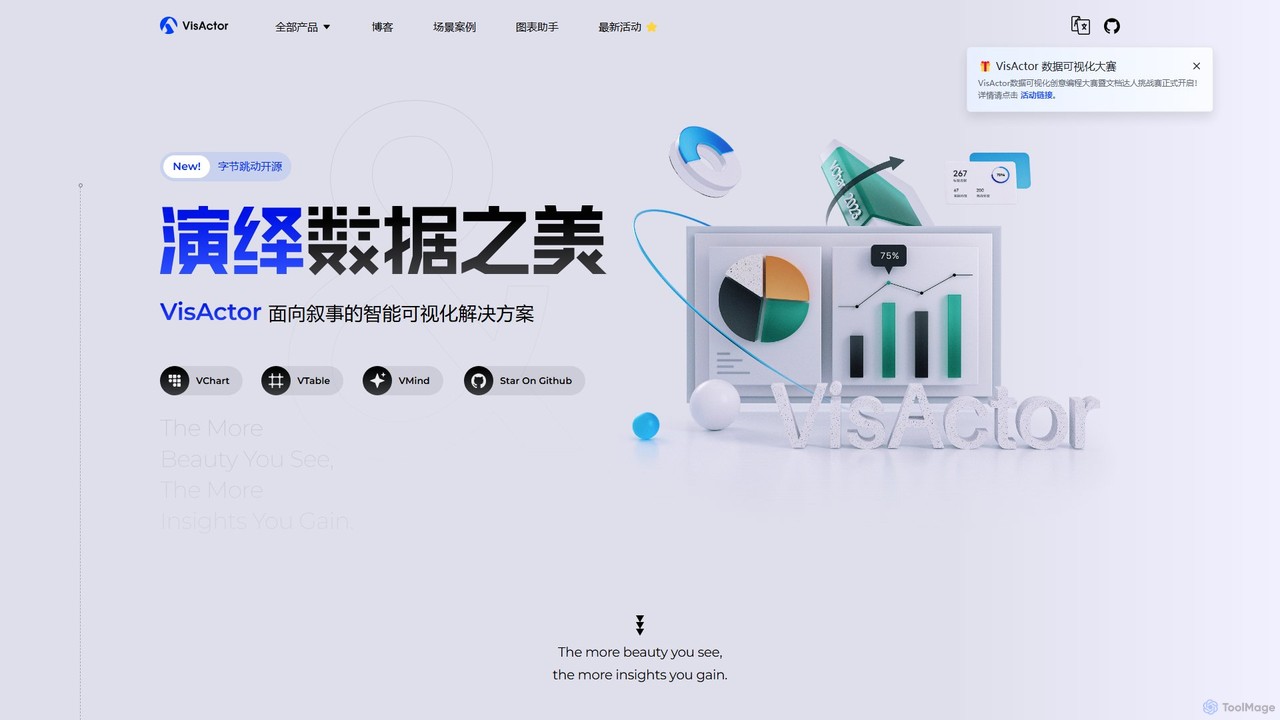
VisActorは、ByteDanceが開発したオープンソースのナラティブ指向インテリジェント可視化ソリューションです。VChartやVTableを含む包括的なツールスイートを提供し、データを魅力的なビジュアルストーリーに変換します。AI搭載コンポーネントVMindにより、チャート作成を簡素化し、ダイナミックでクロスプラットフォームなデータプレゼンテーションを実現します。
VisActorは、ByteDanceが開発したオープンソースのナラティブ指向インテリジェント可視化ソリューションです。VChartやVTableを含む包括的なツールスイートを提供し、データを魅力的なビジュアルストーリーに変換します。AI搭載コンポーネントVMindにより、チャート作成を簡素化し、ダイナミックでクロスプラットフォームなデータプレゼンテーションを実現します。
vizboxは、AIを活用したデータ可視化プラットフォームで、生データを洞察に満ちたチャート、グラフ、インタラクティブなダッシュボードに変換します。ユーザーはデータをアップロードするか、自然言語のプロンプトを使用して魅力的なビジュアルを生成でき、技術的なスキルに関係なく誰もがデータ分析にアクセスできます。
VisActorは、ByteDanceが開発したオープンソースのナラティブ指向インテリジェント可視化ソリューションです。VChartやVTableを含む包括的なツールスイートを提供し、データを魅力的なビジュアルストーリーに変換します。AI搭載コンポーネントVMindにより、チャート作成を簡素化し、ダイナミックでクロスプラットフォームなデータプレゼンテーションを実現します。
vizboxは、AIを活用したデータ可視化プラットフォームで、生データを洞察に満ちたチャート、グラフ、インタラクティブなダッシュボードに変換します。ユーザーはデータをアップロードするか、自然言語のプロンプトを使用して魅力的なビジュアルを生成でき、技術的なスキルに関係なく誰もがデータ分析にアクセスできます。
| Feature | VisActor | vizbox |
|---|---|---|
| 主要カテゴリー | ライブラリとフレームワーク | ノーコード |
| 追加日 | 2025-08-12 | 2025-08-14 |
| 価格 | 無料 | フリーミアム |
| 公式サイト | visactor.io | vizbox.app |
| 製品タイプ | ウェブサイト | ウェブサイト |
| Performance data | ||
| ユーザー評価 | 未確認 | 未確認 |
| コメント | 0 | 0 |
| 月間訪問数 | 22.3K | 4.1K |
| 月間成長率 | -27.7% | 未確認 |
| お気に入り | 127 | 127 |
| Details | 詳細を見る | 詳細を見る |
Compare VisActor and vizbox by monthly reach, traffic trend, visit depth, top regions, and acquisition sources.
In the VisActor vs vizbox monthly traffic comparison, VisActor currently shows 22.3K visits and vizbox shows 4.1K; VisActor has about 5.5 times the visible traffic of vizbox, an absolute difference of about 18.2K visits. This reflects visible reach, not feature quality or paid users.
Only VisActor has complete third-party traffic details; vizbox uses visits recorded inside ToolMage. These scopes cannot estimate market share directly, and on-site views should not be treated as the product’s total website traffic.
| Country/region | Percentage | Traffic |
|---|---|---|
| 🇨🇳China | 84.12% | 18.7K |
| 🇺🇸United States | 6.91% | 1.5K |
| 🇰🇷Korea, Republic of | 3.07% | 684 |
| 🇧🇷Brazil | 2.99% | 666 |
| 🇭🇰Hong Kong | 2.91% | 648 |
| Source type | Percentage | Traffic |
|---|---|---|
| ダイレクト | 79.43% | 17.7K |
| 参照元 | 20.57% | 4.6K |
This in-depth VisActor vs vizbox comparison uses only the product records, taxonomy, audience, traffic, and community signals available on this page. VisActor is primarily listed under “ライブラリとフレームワーク”, while vizbox is primarily listed under “ノーコード”, so the first decision is whether your actual task matches their recorded scope.
The structured fields currently show these decision-relevant differences: Primary category (VisActor: ライブラリとフレームワーク; vizbox: ノーコード); Pricing (VisActor: Free; vizbox: Freemium); Monthly visits (VisActor: 22.3K; vizbox: 4.1K); Website (VisActor: visactor.io; vizbox: vizbox.app); Added (VisActor: 2025-08-12; vizbox: 2025-08-14). These facts are more useful for selection than brand visibility alone.
In the VisActor vs vizbox monthly traffic comparison, VisActor currently shows 22.3K visits and vizbox shows 4.1K; VisActor has about 5.5 times the visible traffic of vizbox, an absolute difference of about 18.2K visits. This reflects visible reach, not feature quality or paid users.
Only VisActor has complete third-party traffic details; vizbox uses visits recorded inside ToolMage. These scopes cannot estimate market share directly, and on-site views should not be treated as the product’s total website traffic.
The current traffic scope is not sufficient for a reliable product ranking. Treat monthly visits as a market-interest signal, then decide using taxonomy, use cases, pricing, and a like-for-like trial rather than reading exposure as product capability.
VisActor and vizbox currently overlap in shared categories: ビジネスインテリジェンス; shared tags: ビジネスインテリジェンス、チャート、データストーリーテリング、データ視覚化、グラフ. This can place both on the same shortlist, but it does not prove equal implementation, depth, or cost.
VisActor's unique categories/tags are ライブラリとフレームワーク、AIチャートジェネレーター、開発者ツール、JavaScriptライブラリ、ナラティブ・ビジュアライゼーション、オープンソース; vizbox's are ノーコード、分析、AI、ダッシュボード、データ分析、NLP、レポート. These unique fields are the strongest differentiators: validate the product whose recorded scope matches the task instead of following traffic alone.
VisActor has no verified rating, 0 comments, 127 favorites, and 122 likes;vizbox has no verified rating, 0 comments, 127 favorites, and 126 likes。
Neither product has enough rating or comment samples for a credible reputation ranking.
Put VisActor on the priority trial list when the task aligns with “ライブラリとフレームワーク” and especially ライブラリとフレームワーク、AIチャートジェネレーター、開発者ツール、JavaScriptライブラリ、ナラティブ・ビジュアライゼーション、オープンソース. This follows recorded positioning and does not imply unlisted capabilities are absent.
VisActor also currently records: pricing is free, product type is website, 22.3K verified monthly visits, no verified user rating. Verify any hard requirement around price, platform, or reach before trial, and do not let sparse review data substitute for testing.
Put vizbox on the priority trial list when the task aligns with “ノーコード” and especially ノーコード、分析、AI、ダッシュボード、データ分析、NLP. This follows recorded positioning and does not imply unlisted capabilities are absent.
vizbox also currently records: pricing is freemium, product type is website, 4.1K on-site monthly views, no verified user rating. Verify any hard requirement around price, platform, or reach before trial, and do not let sparse review data substitute for testing.
The available data describes positioning, public visibility, and community signals, but it cannot prove output quality, speed, integration effort, privacy, or long-term cost in your workflow. Before deciding, run the same representative tasks in VisActor and vizbox, then record completion time, accuracy, manual corrections, and the real paid threshold. A like-for-like trial turns this comparison into a defensible adoption decision.


Othor AIは、ノーコードのビジネスインテリジェンスプラットフォームで、データを数秒で実用的なインサイトに変換します。物語形式のレポート、スマートチャート、予測分析を自動生成し、組織の誰もが技術的な専門知識なしで、より迅速にデータに基づいた意思決定を行えるようにします。データソースを接続するだけで、即座にダッシュボードとエグゼクティブサマリーを入手できます。
ビジネスインテリジェンス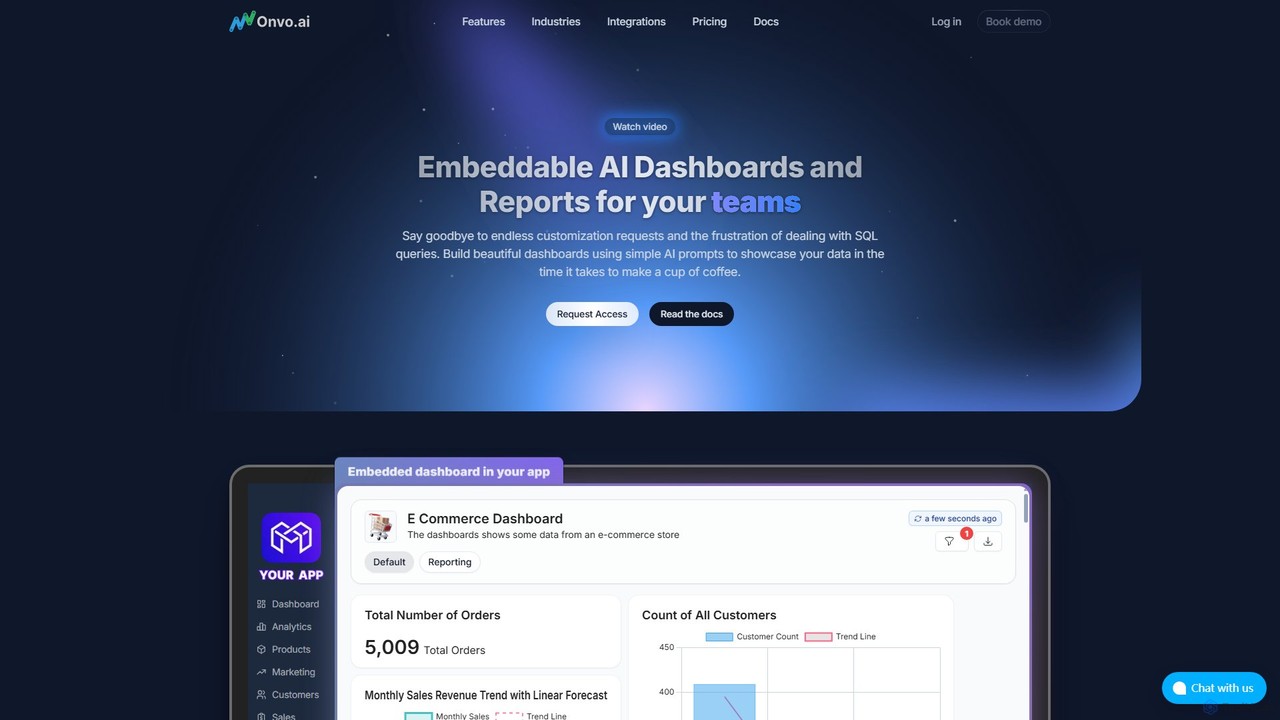
Onvo AIは、AI駆動のダッシュボードとレポートをアプリケーションに直接構築・埋め込みできる強力なプラットフォームです。複雑なSQLクエリを簡単な自然言語プロンプトに置き換え、技術者・非技術者を問わず誰でも簡単に美しいデータ可視化を作成できます。このソリューションは、エンジニアリングリソースを大幅に節約し、チームや顧客に安全なセルフサービス分析機能を提供します。
ビジネスインテリジェンス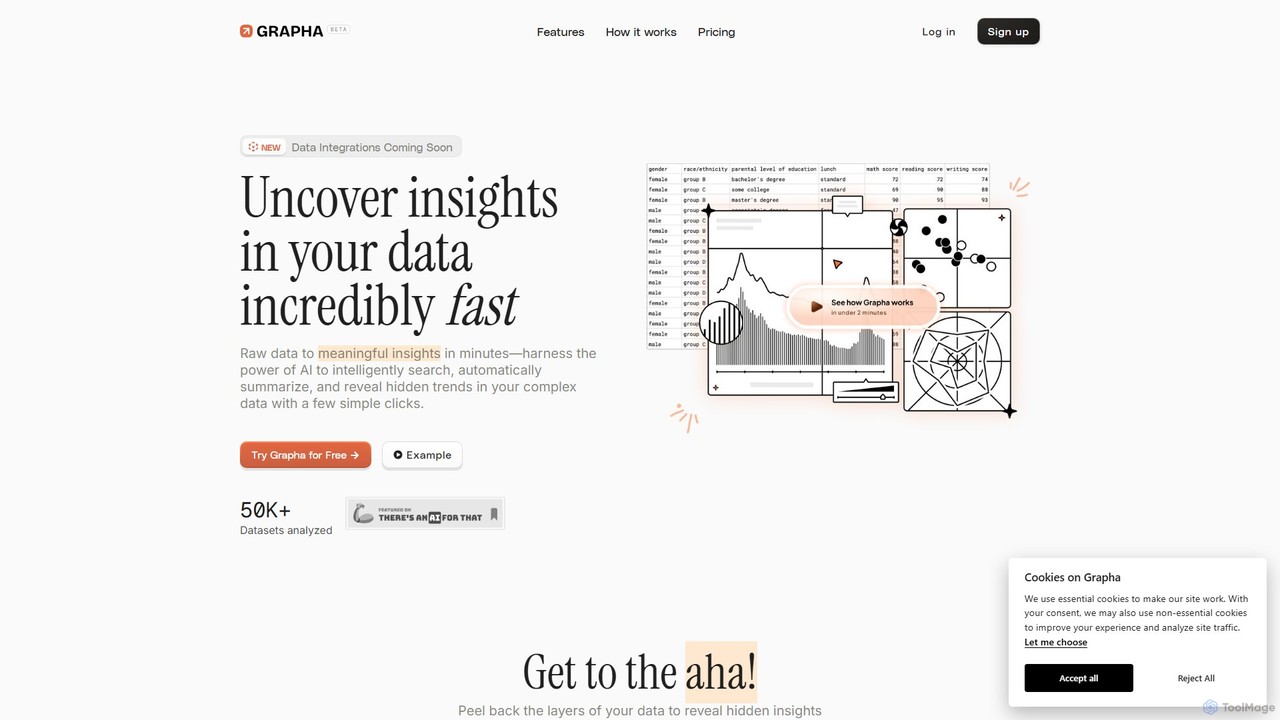
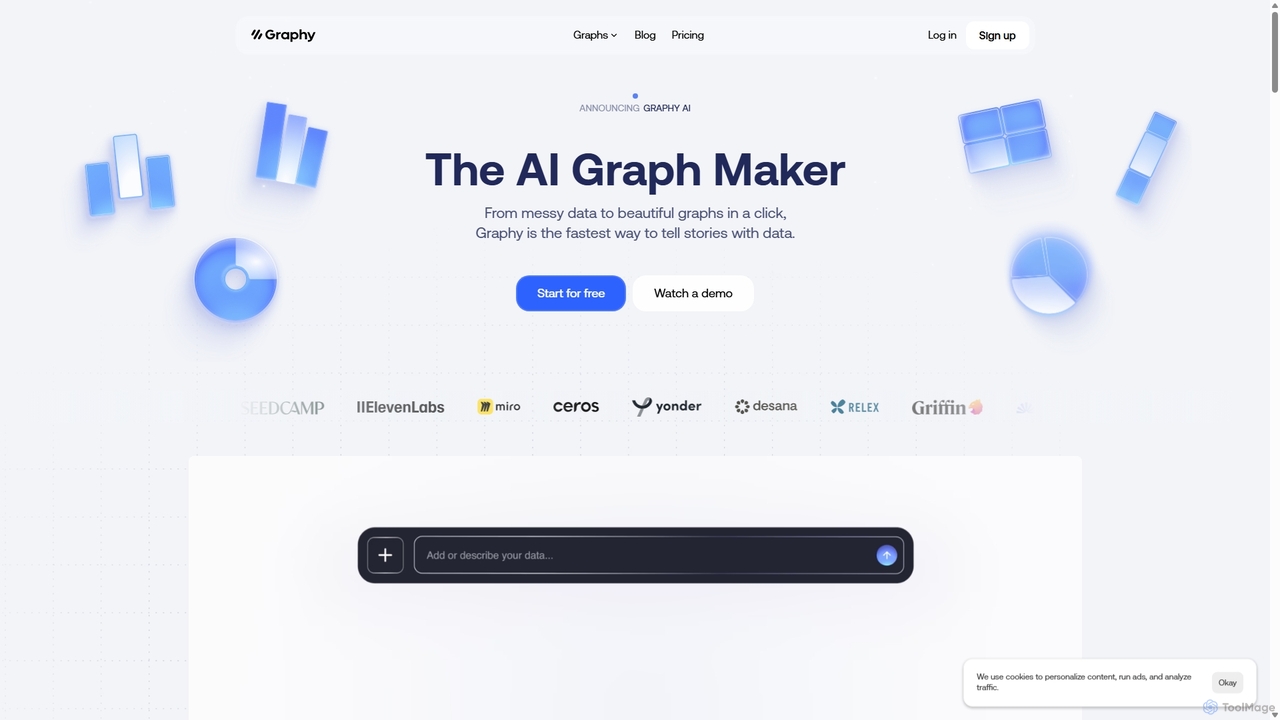
Grapha.aiは、複雑なデータセットを明確で実行可能なインサイトに変換するAI搭載のデータ探索ツールです。自然言語のコパイロットを使い、コーディングなしでデータを検索、要約、視覚化できます。ビジネスアナリストから小規模事業主まで、誰もが隠れたトレンドを発見し、数分でデータに基づいた意思決定を行えるように設計されています。
ビジネスインテリジェンス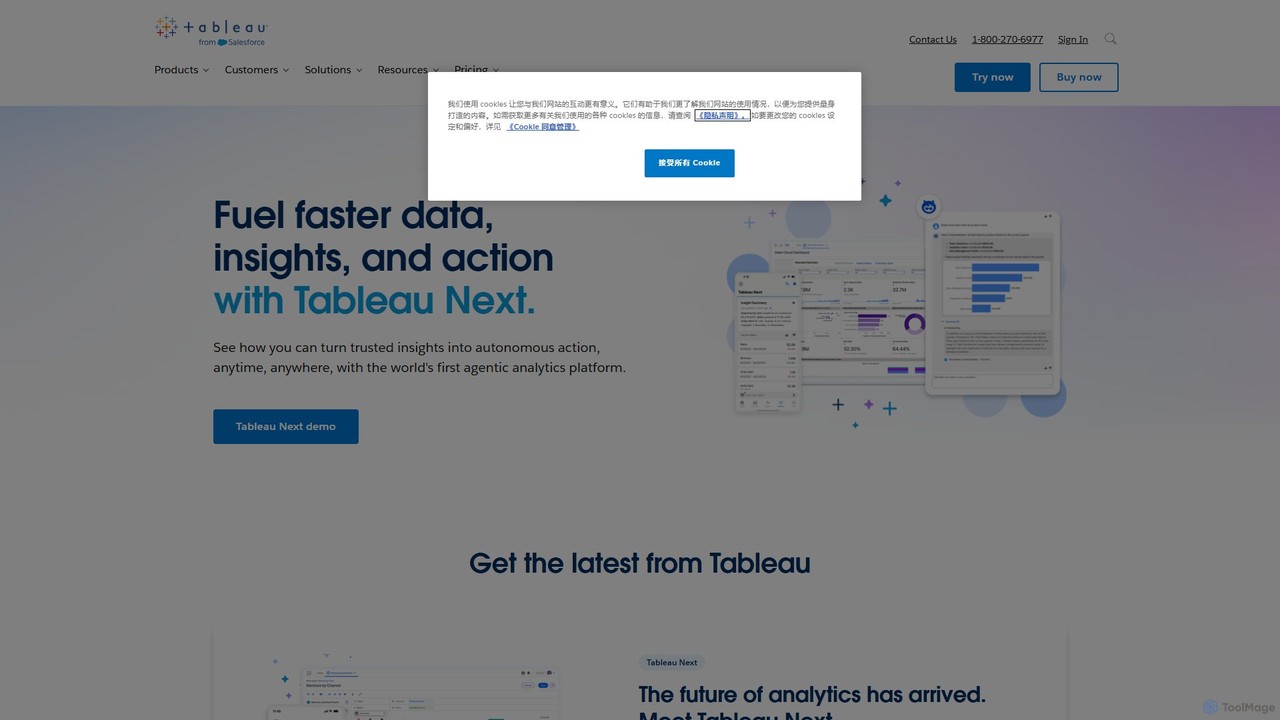
Tableauは、人々がデータを視覚化し理解するのを助ける、AIを搭載した主要なビジネスインテリジェンスおよび分析プラットフォームです。ユーザーはインタラクティブなダッシュボードを作成し、複雑なデータ分析を実行し、組織全体でインサイトを共有でき、Tableau AgentのようなAI機能によって意思決定を加速します。
ビジネスインテリジェンス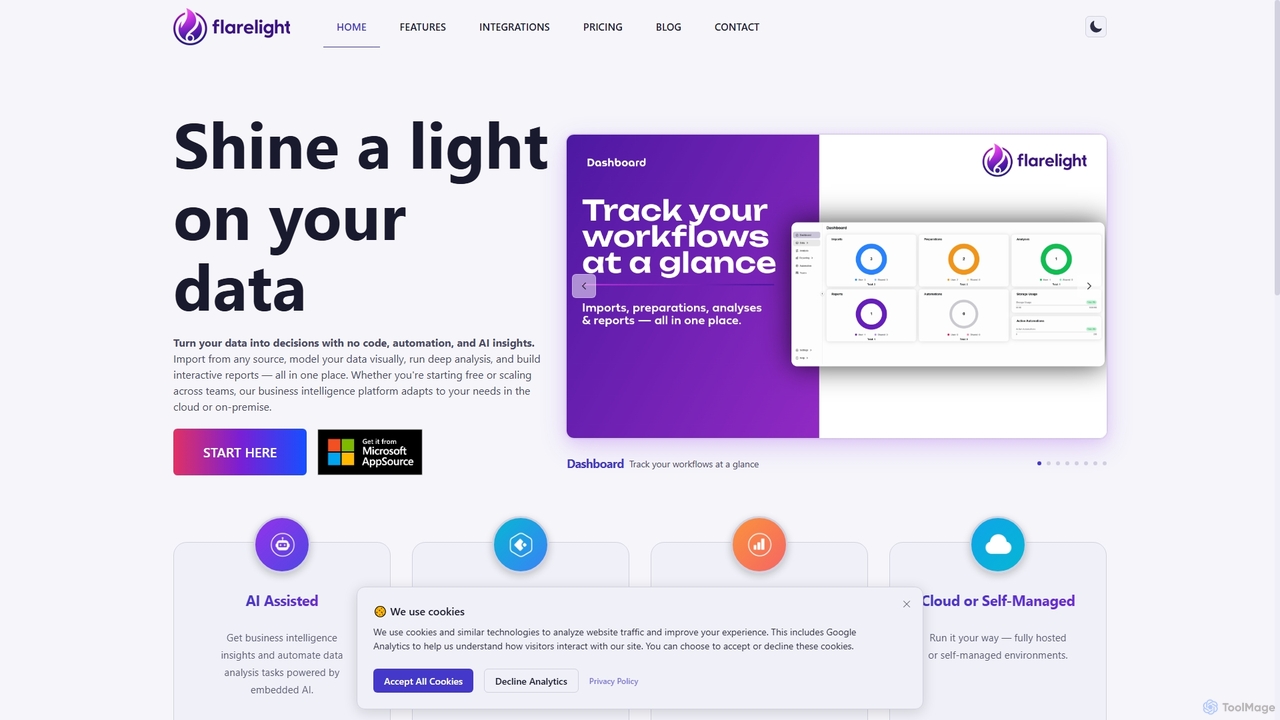
Flarelightは、データ分析と可視化のためのAI搭載ノーコード・ビジネスインテリジェンスプラットフォームです。あらゆるソースからデータをインポートし、視覚的に準備し、詳細な分析を行い、インタラクティブなレポートを作成できます。このオールインワンツールはクラウドとオンプレミスの両方のデプロイをサポートし、ワークフローの自動化と自然言語設定により、複雑なデータを実用的な意思決定に変えます。
ノーコード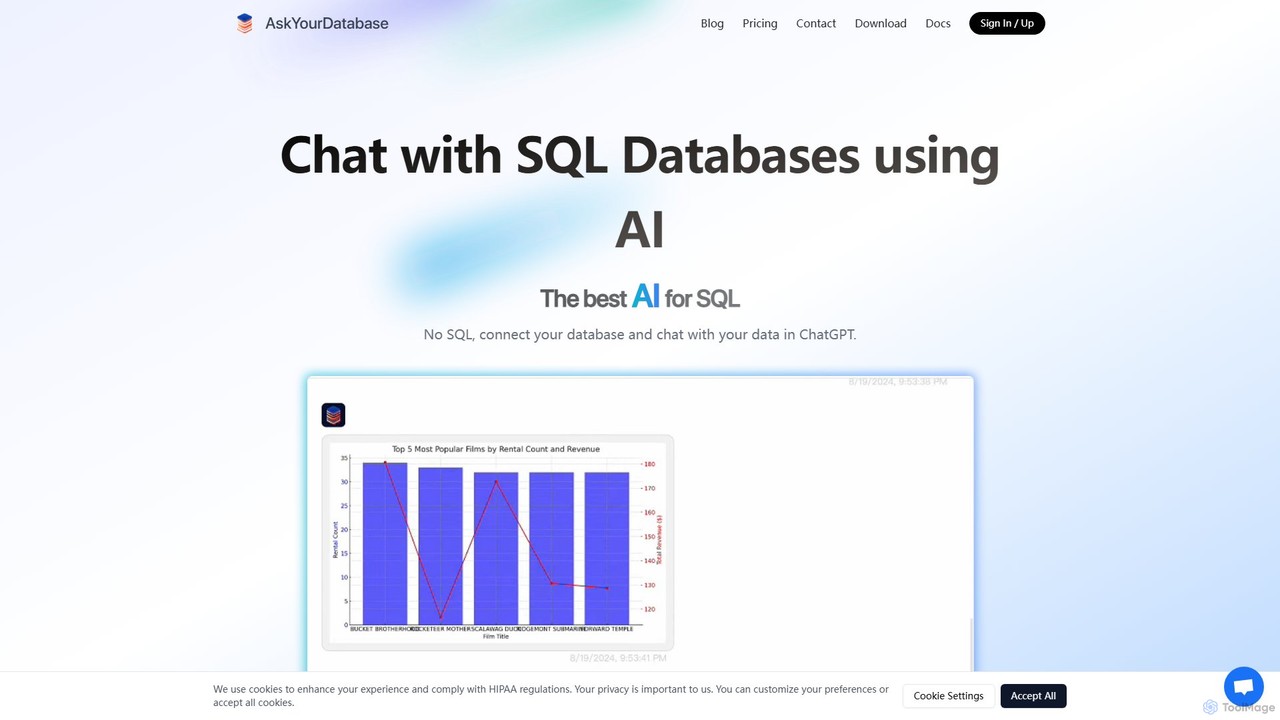
AskYourDatabaseは、自然言語を使ってデータベースと対話できる強力なAI SQLアシスタントです。SQLコードを一行も書かずに、データのクエリ、可視化の作成、インタラクティブなダッシュボードの構築が可能です。多様なデータベースをサポートし、デスクトップ版と埋め込み可能なチャットボット版を提供し、オンプレミス展開オプションでデータセキュリティを最優先します。
データ分析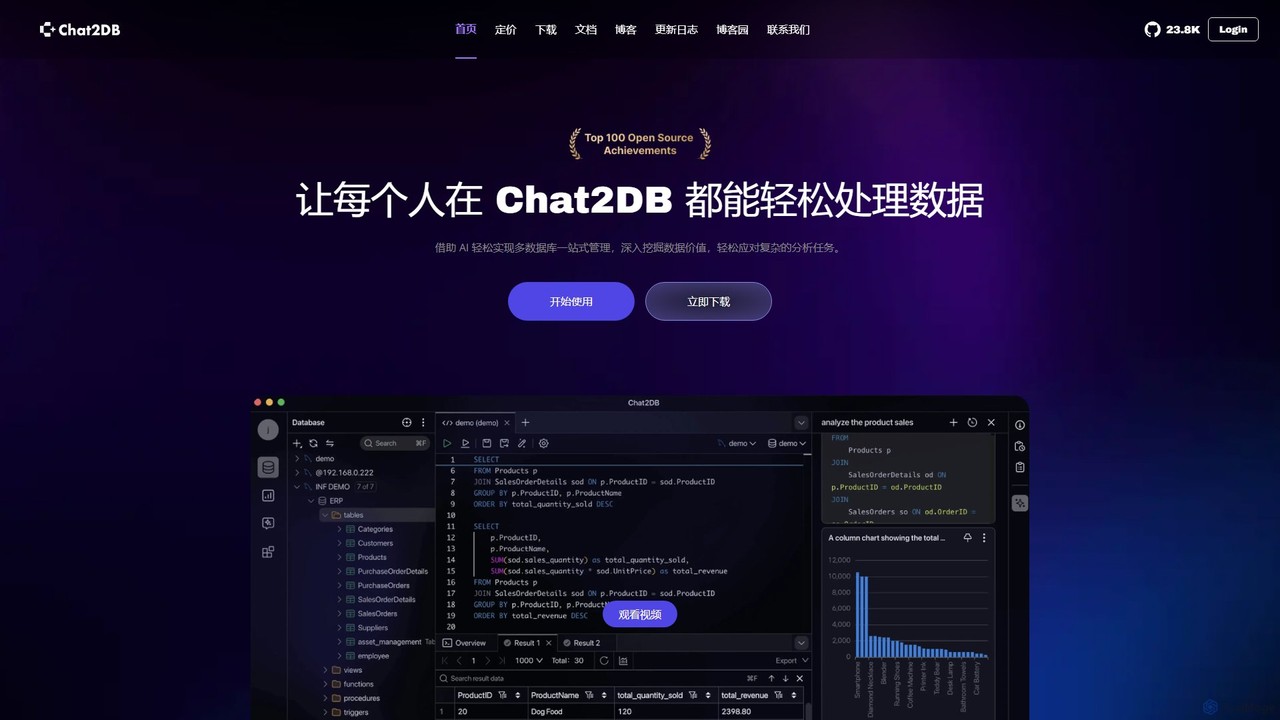
Chat2DBは、AIを搭載したインテリジェントなオールインワン・データベース管理ツールです。MySQL、PostgreSQL、MongoDBを含む30以上のデータベースをサポートし、ユーザーが自然言語を使用してデータを管理、クエリ、分析できるようにします。AI SQL生成、データ可視化、ノーコードのダッシュボード作成、堅牢なセキュリティプロトコルなどの機能を備え、開発者、アナリスト、ビジネスユーザーに最適です。
ビジネスインテリジェンス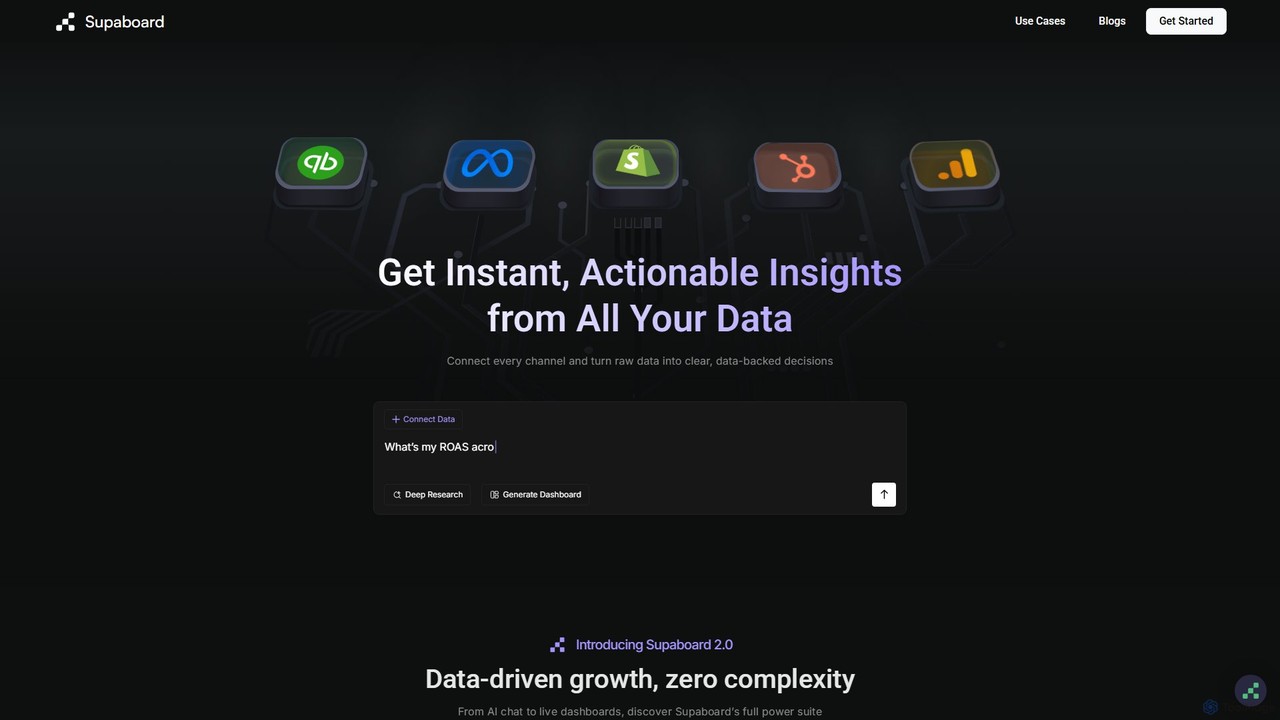
Supaboardは、すべてのデータソースを統一されたハブに接続するAI搭載のビジネスインテリジェンスプラットフォームです。生データを実用的なインサイトとライブダッシュボードに変換し、チームがコードを書いたりスプレッドシートを操作したりすることなく、データに基づいた意思決定を迅速に行えるようにします。
ビジネスインテリジェンス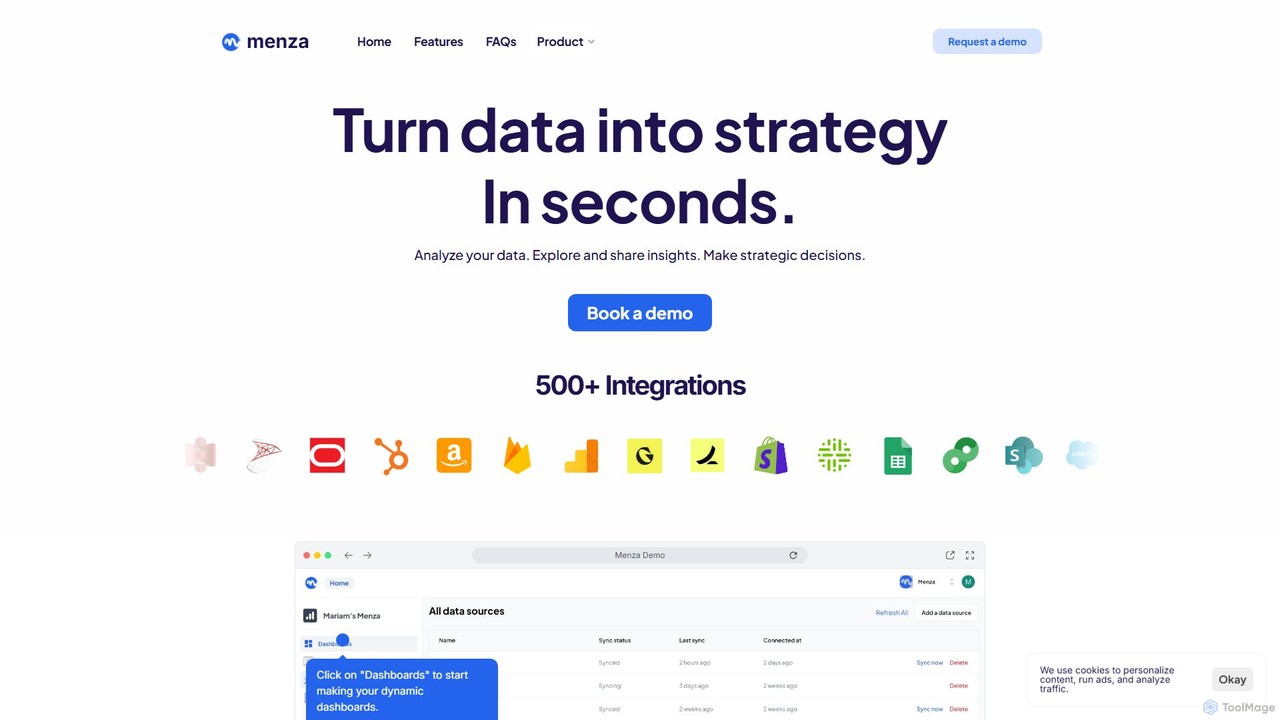
menzaは、ビジネスデータを数秒で実用的な戦略的インサイトに変換するAI搭載のデータ分析プラットフォームです。技術者でないユーザーも、平易な言葉とシンプルなインターフェースを使って、データの分析、インタラクティブなダッシュボードの構築、意思決定に関する共同作業が可能です。
ビジネスインテリジェンス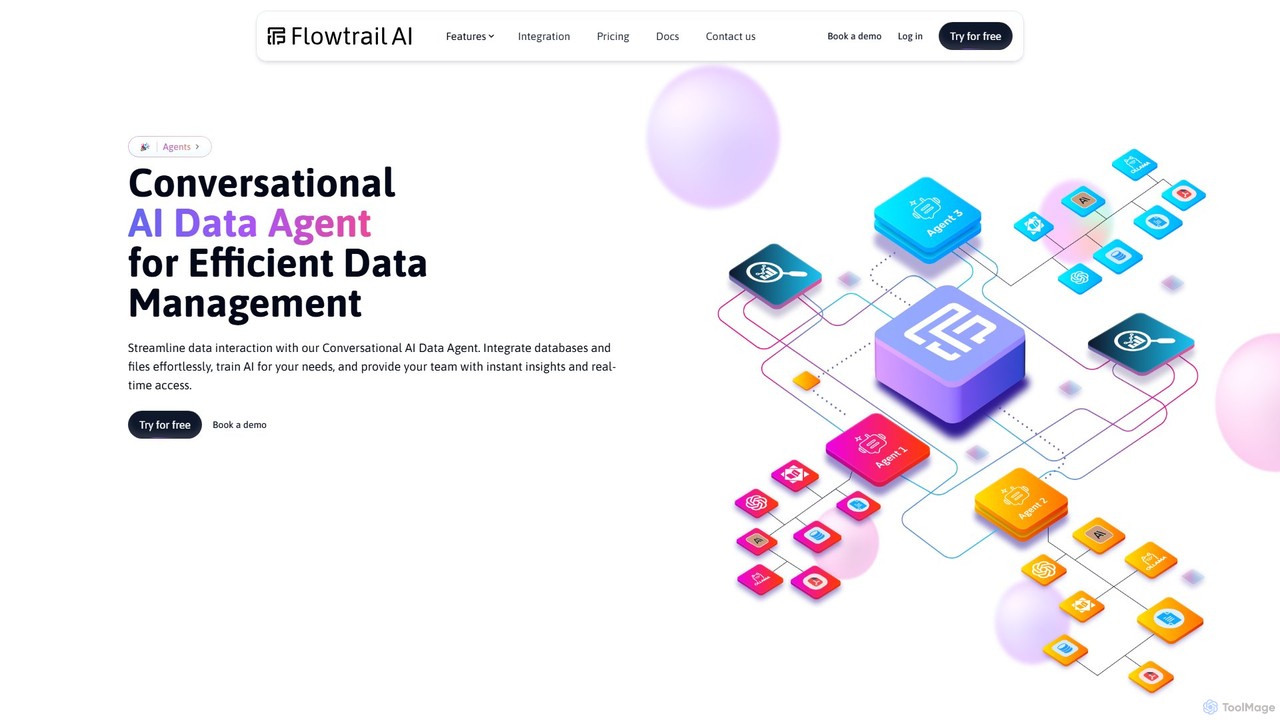
Flowtrailは、データとの対話方法を変革する対話型AIデータエージェントです。データベースやファイルを接続し、自然言語で質問するだけで、即座にインサイト、視覚化、レポートを取得できます。これは、中小企業から大企業まで、誰もがデータ分析にアクセスできるように設計されたノーコードプラットフォームであり、データ駆動型の文化を育みます。
ビジネスインテリジェンス
Stadaiは、データ分析、ビジネスインテリジェンス、予測モデリングのための高度なAI搭載プラットフォームです。直感的なノーコードインターフェースを通じて、ユーザーが複雑なデータを実用的なインサイトに変換し、レポート作成を自動化し、トレンドを予測することを可能にします。
ビジネスインテリジェンス
DatViz AIは、自然言語を用いて複雑なデータセットを洞察に満ちた視覚的に魅力的なチャートやグラフに変換する高度な分析プラットフォームです。OpenAIのLLMを搭載し、コーディング不要でデータ分析を簡素化し、主要な統計情報を計算し、棒グラフ、ヒートマップ、ジオマップなどの視覚化を生成します。
ビジネスインテリジェンス