PhantomBuster
リードジェネレーション · 502.7K 月間訪問数
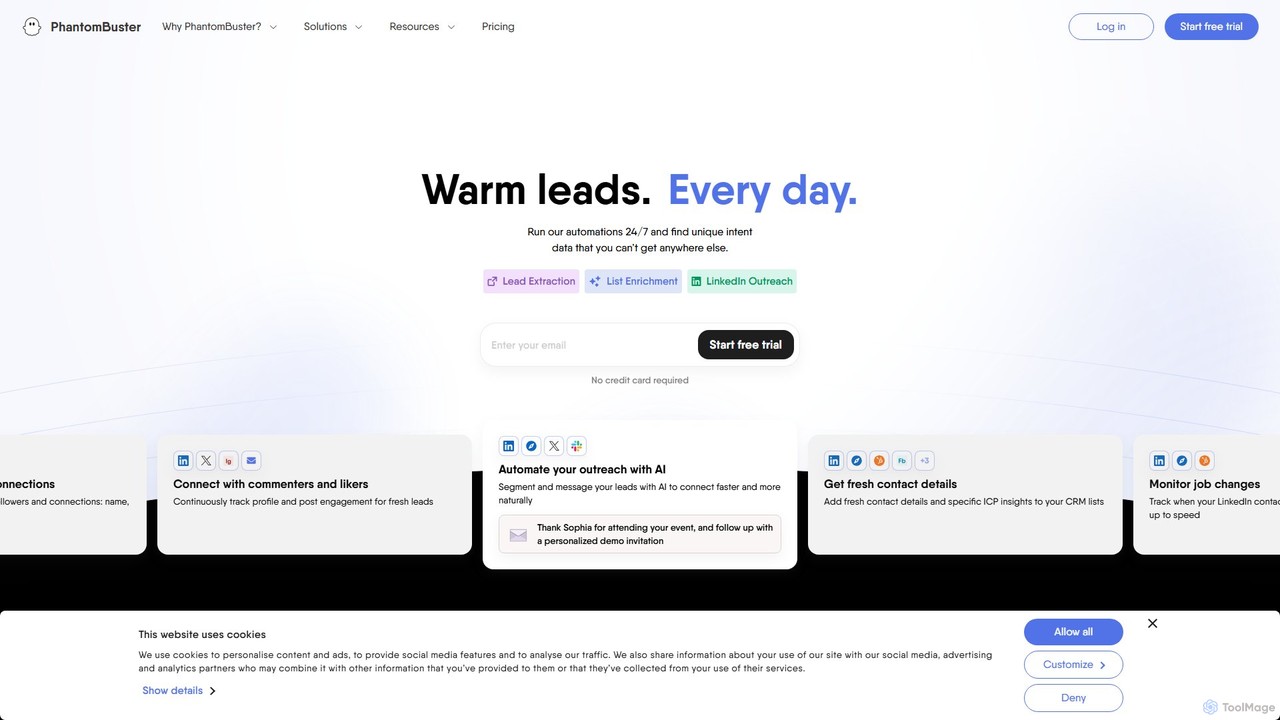
PhantomBusterは、営業、マーケティング、グロースチーム向けに設計された、業界をリードするクラウドベースの自動化およびデータ抽出ツールです。コーディング不要でウェブ上のアクションを自動化し、LinkedIn、Twitter、Instagramなどのソーシャルメディアやウェブサイトから貴重なデータを抽出し、質の高いリードを生成することができます。
PhantomBusterは、営業、マーケティング、グロースチーム向けに設計された、業界をリードするクラウドベースの自動化およびデータ抽出ツールです。コーディング不要でウェブ上のアクションを自動化し、LinkedIn、Twitter、Instagramなどのソーシャルメディアやウェブサイトから貴重なデータを抽出し、質の高いリードを生成することができます。
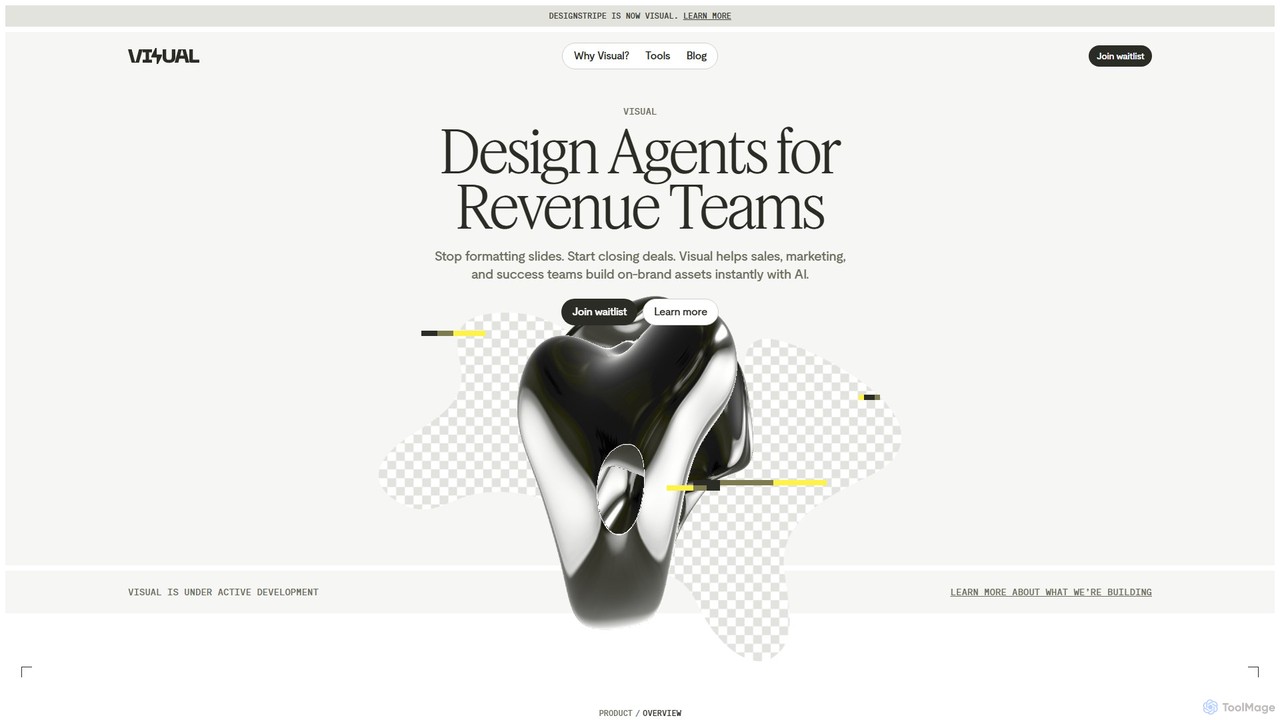
Visualは、営業、マーケティング、カスタマーサクセスなどの収益チーム向けのAIデザインエージェントプラットフォームで、プレゼンテーション、提案書、ドキュメントの作成を自動化します。シンプルなチャットインターフェースを使用し、チームは数分でブランドに準拠した資料を生成・編集でき、時間を節約し、ブランドの一貫性を確保します。
PhantomBusterは、営業、マーケティング、グロースチーム向けに設計された、業界をリードするクラウドベースの自動化およびデータ抽出ツールです。コーディング不要でウェブ上のアクションを自動化し、LinkedIn、Twitter、Instagramなどのソーシャルメディアやウェブサイトから貴重なデータを抽出し、質の高いリードを生成することができます。
Visualは、営業、マーケティング、カスタマーサクセスなどの収益チーム向けのAIデザインエージェントプラットフォームで、プレゼンテーション、提案書、ドキュメントの作成を自動化します。シンプルなチャットインターフェースを使用し、チームは数分でブランドに準拠した資料を生成・編集でき、時間を節約し、ブランドの一貫性を確保します。
| Feature | PhantomBuster | Visual |
|---|---|---|
| 主要カテゴリー | リードジェネレーション | プレゼンテーション |
| 追加日 | 2025-08-14 | 2025-08-08 |
| 価格 | フリーミアム | 未確認 |
| 公式サイト | phantombuster.com | visual.app |
| 製品タイプ | ウェブサイト | ウェブサイト |
| Performance data | ||
| ユーザー評価 | 未確認 | 未確認 |
| コメント | 0 | 0 |
| 月間訪問数 | 502.7K | 13.2K |
| 月間成長率 | -15.7% | 22.8% |
| お気に入り | 114 | 108 |
| Details | 詳細を見る | 詳細を見る |
Compare PhantomBuster and Visual by monthly reach, traffic trend, visit depth, top regions, and acquisition sources.
In the PhantomBuster vs Visual monthly traffic comparison, PhantomBuster currently shows 502.7K visits and Visual shows 13.2K; PhantomBuster has about 38.2 times the visible traffic of Visual, an absolute difference of about 489.5K visits. This reflects visible reach, not feature quality or paid users.
Both tools provide verified traffic details, so monthly trends, visit depth, regions, and acquisition sources can be compared on the same basis.
| Country/region | Percentage | Traffic |
|---|---|---|
| 🇺🇸United States | 43.24% | 217.4K |
| 🇮🇳India | 23.57% | 118.5K |
| 🇫🇷France | 12.26% | 61.6K |
| 🇧🇷Brazil | 11.33% | 57K |
| 🇬🇧United Kingdom | 9.6% | 48.3K |
| Source type | Percentage | Traffic |
|---|---|---|
| ダイレクト | 86.16% | 433.1K |
| 参照元 | 10.37% | 52.1K |
| Eメール | 3.47% | 17.4K |
| Country/region | Percentage | Traffic |
|---|---|---|
| 🇮🇳India | 25.99% | 3.4K |
| 🇺🇸United States | 21.39% | 2.8K |
| 🇫🇷France | 18.42% | 2.4K |
| 🇮🇩Indonesia | 17.39% | 2.3K |
| 🇵🇱Poland | 16.81% | 2.2K |
This in-depth PhantomBuster vs Visual comparison uses only the product records, taxonomy, audience, traffic, and community signals available on this page. PhantomBuster is primarily listed under “リードジェネレーション”, while Visual is primarily listed under “プレゼンテーション”, so the first decision is whether your actual task matches their recorded scope.
The structured fields currently show these decision-relevant differences: Primary category (PhantomBuster: リードジェネレーション; Visual: プレゼンテーション); Pricing (PhantomBuster: Freemium; Visual: Not disclosed); Monthly visits (PhantomBuster: 502.7K; Visual: 13.2K); Monthly growth (PhantomBuster: -15.7%; Visual: 22.8%); Favorites (PhantomBuster: 114; Visual: 108). These facts are more useful for selection than brand visibility alone.
In the PhantomBuster vs Visual monthly traffic comparison, PhantomBuster currently shows 502.7K visits and Visual shows 13.2K; PhantomBuster has about 38.2 times the visible traffic of Visual, an absolute difference of about 489.5K visits. This reflects visible reach, not feature quality or paid users.
Both tools provide verified traffic details, so monthly trends, visit depth, regions, and acquisition sources can be compared on the same basis.
If public market visibility is an important first-pass criterion, investigate PhantomBuster first. The final choice should still follow taxonomy, use case, and a real trial because higher traffic does not prove broader capabilities or better workflow fit.
PhantomBuster and Visual currently overlap in shared categories: 自動化; shared tags: マーケティングオートメーション. This can place both on the same shortlist, but it does not prove equal implementation, depth, or cost.
PhantomBuster's unique categories/tags are リードジェネレーション、データ抽出、自動化、データスクレイピング、グロースハック、インスタグラム、リード生成、リンクトイン; Visual's are プレゼンテーション、デザイン自動化、AIプレゼンテーション、ブランド一貫性、GTMチーム、プレゼンテーション生成ツール、提案書ジェネレーター、QBR自動化. These unique fields are the strongest differentiators: validate the product whose recorded scope matches the task instead of following traffic alone.
PhantomBuster has no verified rating, 0 comments, 114 favorites, and 127 likes;Visual has no verified rating, 0 comments, 108 favorites, and 104 likes。
Neither product has enough rating or comment samples for a credible reputation ranking.
Put PhantomBuster on the priority trial list when the task aligns with “リードジェネレーション” and especially リードジェネレーション、データ抽出、自動化、データスクレイピング、グロースハック、インスタグラム. This follows recorded positioning and does not imply unlisted capabilities are absent.
PhantomBuster also currently records: pricing is freemium, product type is website, 502.7K verified monthly visits, no verified user rating. Verify any hard requirement around price, platform, or reach before trial, and do not let sparse review data substitute for testing.
Put Visual on the priority trial list when the task aligns with “プレゼンテーション” and especially プレゼンテーション、デザイン自動化、AIプレゼンテーション、ブランド一貫性、GTMチーム、プレゼンテーション生成ツール. This follows recorded positioning and does not imply unlisted capabilities are absent.
Visual also currently records: pricing is not verified, product type is website, 13.2K verified monthly visits, no verified user rating. Verify any hard requirement around price, platform, or reach before trial, and do not let sparse review data substitute for testing.
The available data describes positioning, public visibility, and community signals, but it cannot prove output quality, speed, integration effort, privacy, or long-term cost in your workflow. Before deciding, run the same representative tasks in PhantomBuster and Visual, then record completion time, accuracy, manual corrections, and the real paid threshold. A like-for-like trial turns this comparison into a defensible adoption decision.