aiflowchart
시각화 · 462 월 방문
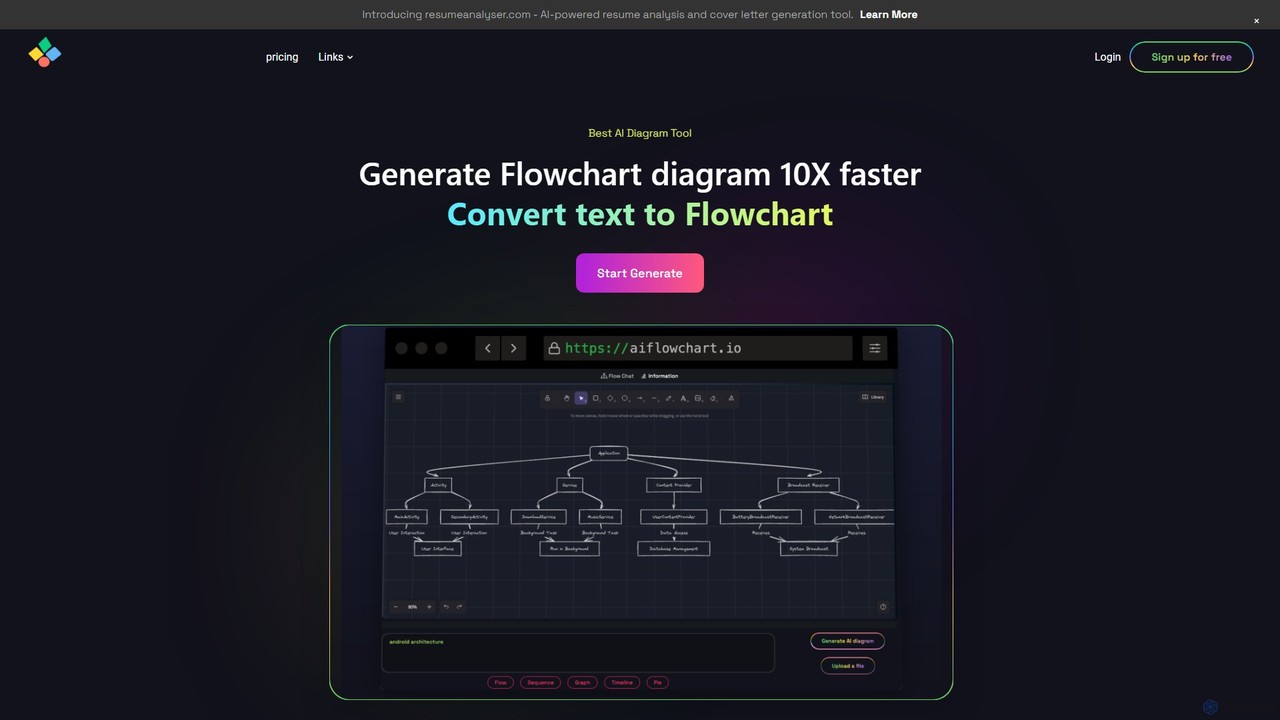
텍스트, PDF 또는 블로그 콘텐츠에서 순서도, 시퀀스 다이어그램, 파이 차트 등을 자동으로 생성하는 AI 기반 다이어그램 도구입니다. GPT-4o와 같은 모델을 활용하여 설명이 포함된 독창적이고 사용자 정의 가능한 다이어그램을 만들어 사용자의 시간과 노력을 크게 절약합니다.
텍스트, PDF 또는 블로그 콘텐츠에서 순서도, 시퀀스 다이어그램, 파이 차트 등을 자동으로 생성하는 AI 기반 다이어그램 도구입니다. GPT-4o와 같은 모델을 활용하여 설명이 포함된 독창적이고 사용자 정의 가능한 다이어그램을 만들어 사용자의 시간과 노력을 크게 절약합니다.
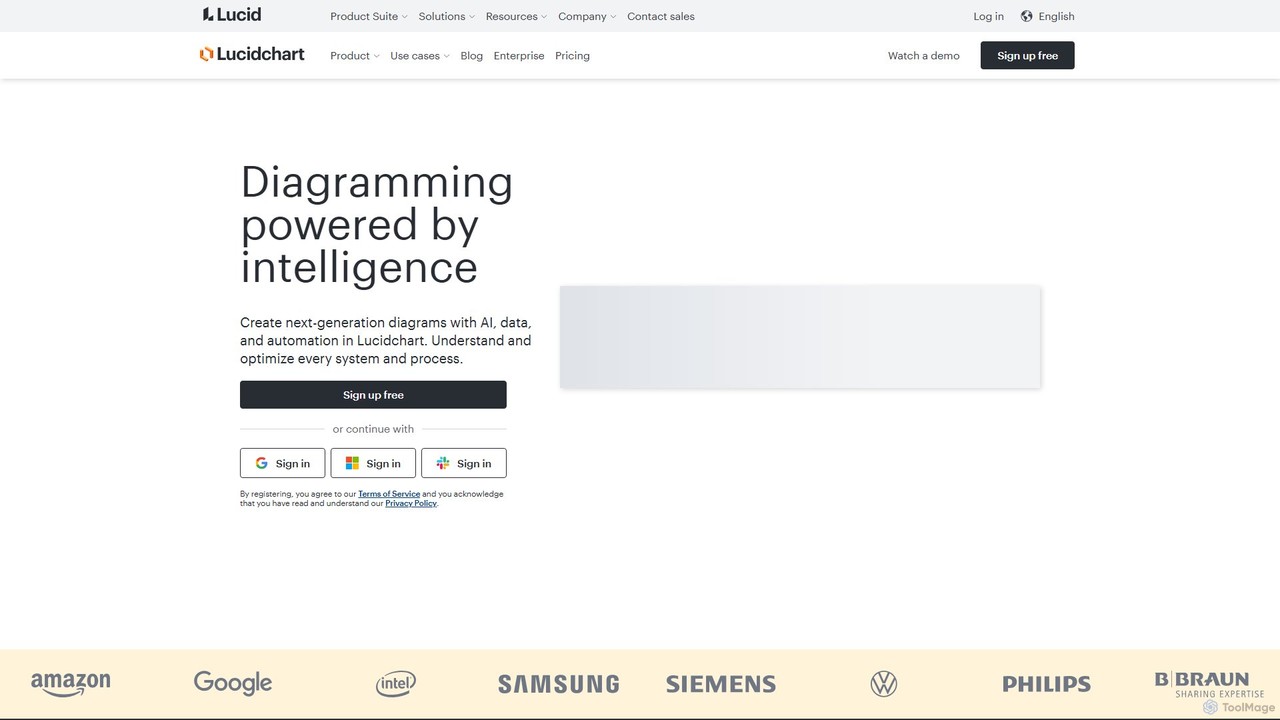
Lucidchart는 AI, 데이터 자동화 및 실시간 팀워크를 사용하여 사용자가 복잡한 시스템, 프로세스 및 아이디어를 시각화할 수 있도록 돕는 지능형 다이어그램 및 시각적 협업 플랫폼입니다. 팀이 전문적인 순서도, 조직도, 네트워크 다이어그램 등을 만들어 명확성을 높이고 혁신을 주도할 수 있도록 합니다.
텍스트, PDF 또는 블로그 콘텐츠에서 순서도, 시퀀스 다이어그램, 파이 차트 등을 자동으로 생성하는 AI 기반 다이어그램 도구입니다. GPT-4o와 같은 모델을 활용하여 설명이 포함된 독창적이고 사용자 정의 가능한 다이어그램을 만들어 사용자의 시간과 노력을 크게 절약합니다.
Lucidchart는 AI, 데이터 자동화 및 실시간 팀워크를 사용하여 사용자가 복잡한 시스템, 프로세스 및 아이디어를 시각화할 수 있도록 돕는 지능형 다이어그램 및 시각적 협업 플랫폼입니다. 팀이 전문적인 순서도, 조직도, 네트워크 다이어그램 등을 만들어 명확성을 높이고 혁신을 주도할 수 있도록 합니다.
| Feature | aiflowchart | Lucidchart |
|---|---|---|
| 주요 카테고리 | 시각화 | 프로젝트 관리 |
| 등록일 | 2025-08-01 | 2025-08-14 |
| 가격 | 프리미엄 | 프리미엄 |
| 공식 사이트 | aiflowchart.io | www.lucidchart.com |
| 제품 유형 | 웹사이트 | 웹사이트 |
| Performance data | ||
| 사용자 평점 | 확인되지 않음 | 확인되지 않음 |
| 댓글 | 0 | 0 |
| 월 방문 | 462 | 2.4M |
| 월 성장률 | -77.4% | -10.5% |
| 즐겨찾기 | 88 | 128 |
| Details | 상세 보기 | 상세 보기 |
Compare aiflowchart and Lucidchart by monthly reach, traffic trend, visit depth, top regions, and acquisition sources.
In the aiflowchart vs Lucidchart monthly traffic comparison, aiflowchart currently shows 462 visits and Lucidchart shows 2.4M; Lucidchart has about 5,129.2 times the visible traffic of aiflowchart, an absolute difference of about 2.4M visits. This reflects visible reach, not feature quality or paid users.
Both tools provide verified traffic details, so monthly trends, visit depth, regions, and acquisition sources can be compared on the same basis.
Lucidchart is registered at the www.lucidchart.com/pages subpage. Because the current data does not state whether other host pages are excluded, treat this as domain-level context rather than independent traffic for one product or project.
| Country/region | Percentage | Traffic |
|---|---|---|
| 🇮🇳India | 100% | 462 |
| Country/region | Percentage | Traffic |
|---|---|---|
| 🇺🇸United States | 42.16% | 999.1K |
| 🇲🇽Mexico | 17.72% | 419.9K |
| 🇨🇴Colombia | 16.67% | 395K |
| 🇧🇷Brazil | 13.51% | 320.1K |
| 🇵🇪Peru | 9.94% | 235.5K |
| Source type | Percentage | Traffic |
|---|---|---|
| 직접 | 81.99% | 1.9M |
| 리퍼럴 | 16.95% | 401.7K |
| 이메일 | 1.06% | 25.1K |
This in-depth aiflowchart vs Lucidchart comparison uses only the product records, taxonomy, audience, traffic, and community signals available on this page. aiflowchart is primarily listed under “시각화”, while Lucidchart is primarily listed under “프로젝트 관리”, so the first decision is whether your actual task matches their recorded scope.
The structured fields currently show these decision-relevant differences: Primary category (aiflowchart: 시각화; Lucidchart: 프로젝트 관리); Monthly visits (aiflowchart: 462; Lucidchart: 2.4M); Monthly growth (aiflowchart: -77.4%; Lucidchart: -10.5%); Favorites (aiflowchart: 88; Lucidchart: 128); Website (aiflowchart: aiflowchart.io; Lucidchart: www.lucidchart.com). These facts are more useful for selection than brand visibility alone.
In the aiflowchart vs Lucidchart monthly traffic comparison, aiflowchart currently shows 462 visits and Lucidchart shows 2.4M; Lucidchart has about 5,129.2 times the visible traffic of aiflowchart, an absolute difference of about 2.4M visits. This reflects visible reach, not feature quality or paid users.
Both tools provide verified traffic details, so monthly trends, visit depth, regions, and acquisition sources can be compared on the same basis.
Lucidchart is registered at the www.lucidchart.com/pages subpage. Because the current data does not state whether other host pages are excluded, treat this as domain-level context rather than independent traffic for one product or project.
Lucidchart is registered under a www.lucidchart.com subpath, so its large visible total may include the host platform. The current data does not justify choosing Lucidchart for traffic alone; shortlist by unique taxonomy and use case, then validate with the same tasks.
aiflowchart and Lucidchart currently overlap in shared categories: 다이어그램 작성; shared tags: AI 다이어그램, 데이터 시각화 및 프로세스 매핑. This can place both on the same shortlist, but it does not prove equal implementation, depth, or cost.
aiflowchart's unique categories/tags are 시각화, 계획, 학습 도구, ChatGPT, 다이어그램 작성기, 순서도 생성기, gpt-4o 및 마인드 맵; Lucidchart's are 프로젝트 관리, 시스템 설계, 협업, 다이어그램 작성, ERD, 순서도, 조직도 및 UML. These unique fields are the strongest differentiators: validate the product whose recorded scope matches the task instead of following traffic alone.
aiflowchart has no verified rating, 0 comments, 88 favorites, and 84 likes;Lucidchart has no verified rating, 0 comments, 128 favorites, and 115 likes。
Neither product has enough rating or comment samples for a credible reputation ranking.
Put aiflowchart on the priority trial list when the task aligns with “시각화” and especially 시각화, 계획, 학습 도구, ChatGPT, 다이어그램 작성기 및 순서도 생성기. This follows recorded positioning and does not imply unlisted capabilities are absent.
aiflowchart also currently records: pricing is freemium, product type is website, 462 verified monthly visits, no verified user rating. Verify any hard requirement around price, platform, or reach before trial, and do not let sparse review data substitute for testing.
Put Lucidchart on the priority trial list when the task aligns with “프로젝트 관리” and especially 프로젝트 관리, 시스템 설계, 협업, 다이어그램 작성, ERD 및 순서도. This follows recorded positioning and does not imply unlisted capabilities are absent.
Lucidchart also currently records: pricing is freemium, product type is website, 2.4M monthly visits shown for the registered host (subpage scope unknown), no verified user rating. Verify any hard requirement around price, platform, or reach before trial, and do not let sparse review data substitute for testing.
The available data describes positioning, public visibility, and community signals, but it cannot prove output quality, speed, integration effort, privacy, or long-term cost in your workflow. Before deciding, run the same representative tasks in aiflowchart and Lucidchart, then record completion time, accuracy, manual corrections, and the real paid threshold. A like-for-like trial turns this comparison into a defensible adoption decision.
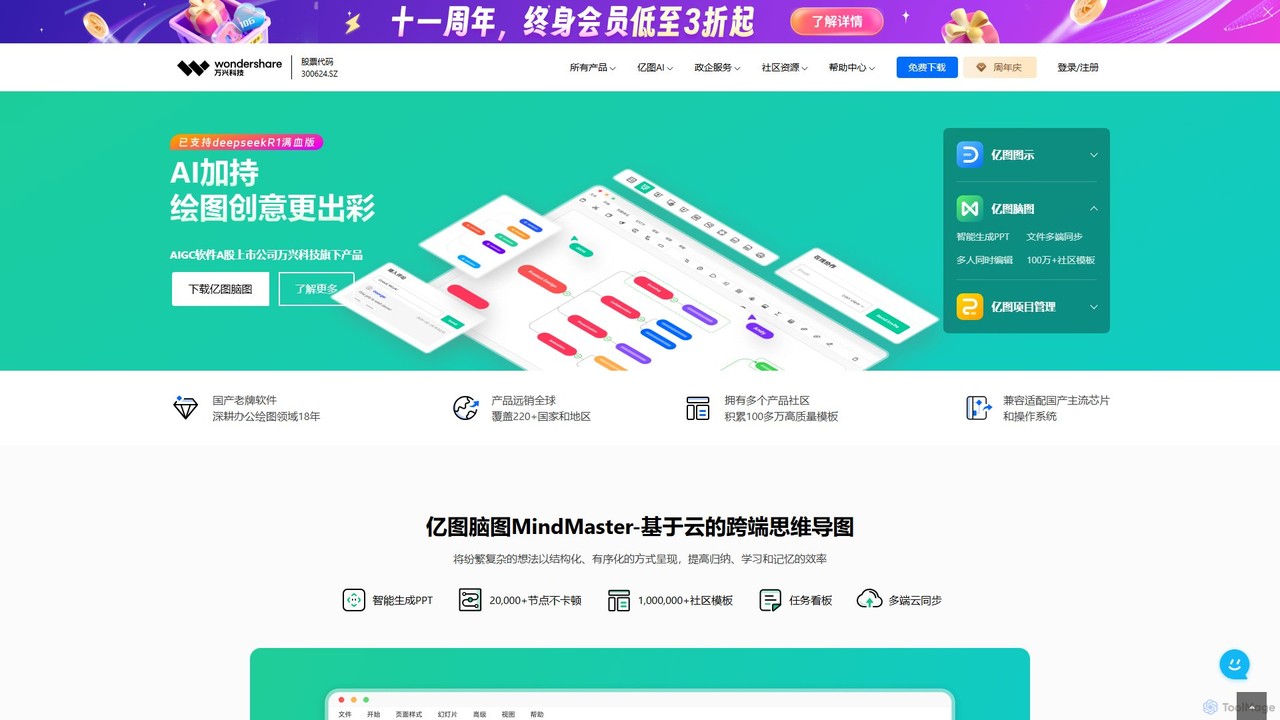
Edrawsoft는 다이어그램, 마인드맵, 프로젝트 관리를 위한 포괄적인 AI 기반 시각적 도구 모음입니다. 올인원 다이어그램 생성을 위한 EdrawMax, 브레인스토밍을 위한 EdrawMind, 간트 차트를 위한 EdrawProj가 포함되어 있습니다. AI 지원을 통해 사용자는 텍스트에서 순서도, 조직도 등을 자동으로 생성하고, 클릭 한 번으로 디자인을 아름답게 꾸미며, 여러 플랫폼에서 원활하게 협업할 수 있습니다. 개인, 팀, 기업을 위한 강력한 Visio 대안입니다.
프로젝트 관리
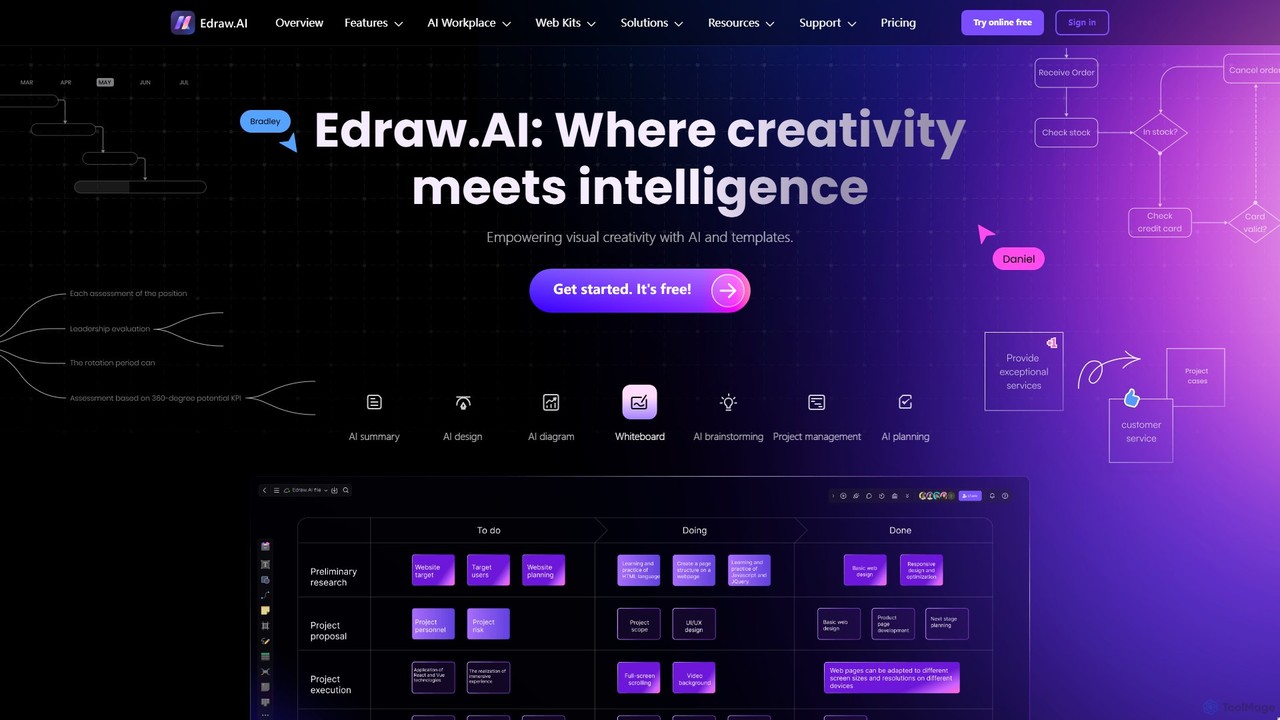
Edraw.AI는 사용자가 다이어그램, 마인드맵, 순서도 및 기타 시각 자료를 쉽게 만들 수 있도록 지원하는 AI 기반 시각적 협업 플랫폼입니다. 사용자 친화적인 인터페이스와 강력한 AI 생성, 분석 및 디자인 도구를 결합했습니다. 실시간 협업, 방대한 템플릿 및 기호 라이브러리를 특징으로 하며, 프로젝트 관리, IT, 마케팅, 교육 등 다양한 분야의 팀 생산성을 향상시키도록 설계되었습니다. 무료로 시작하여 아이디어를 전문적인 시각 자료로 변환하세요.
시각화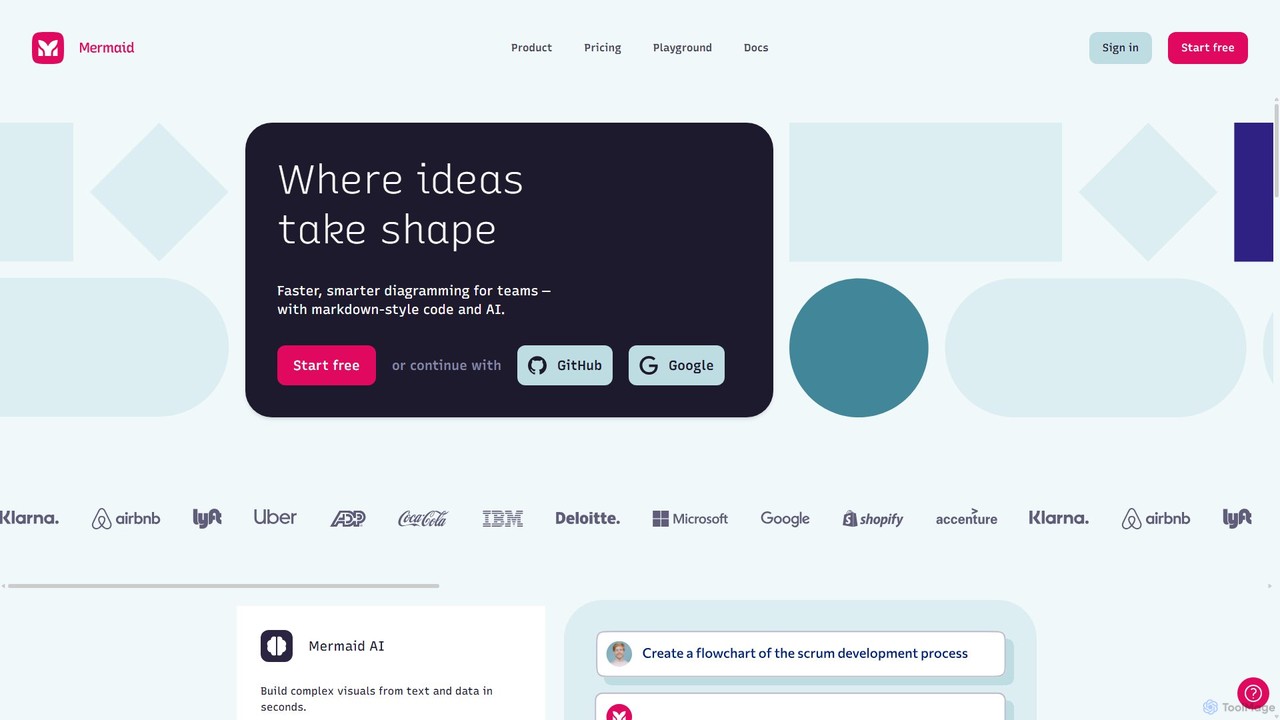
Mermaid Chart는 AI 기반 다이어그램 도구로, 팀이 마크다운 스타일 코드, 자연어 프롬프트 또는 시각적 편집기를 사용하여 순서도, 시퀀스 다이어그램, 마인드맵과 같은 복잡한 시각 자료를 만들 수 있도록 지원합니다. 더 빠르고 스마트한 다이어그램 작성과 원활한 협업을 위해 설계되었습니다.
코드 생성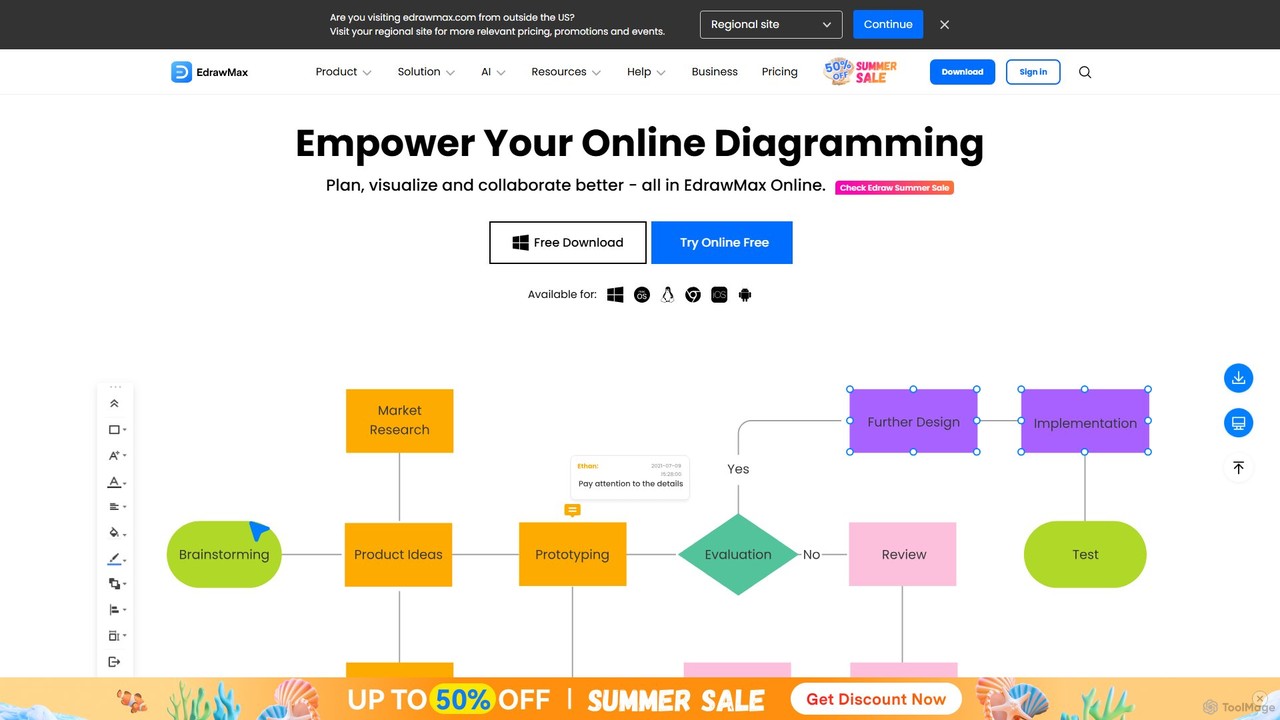
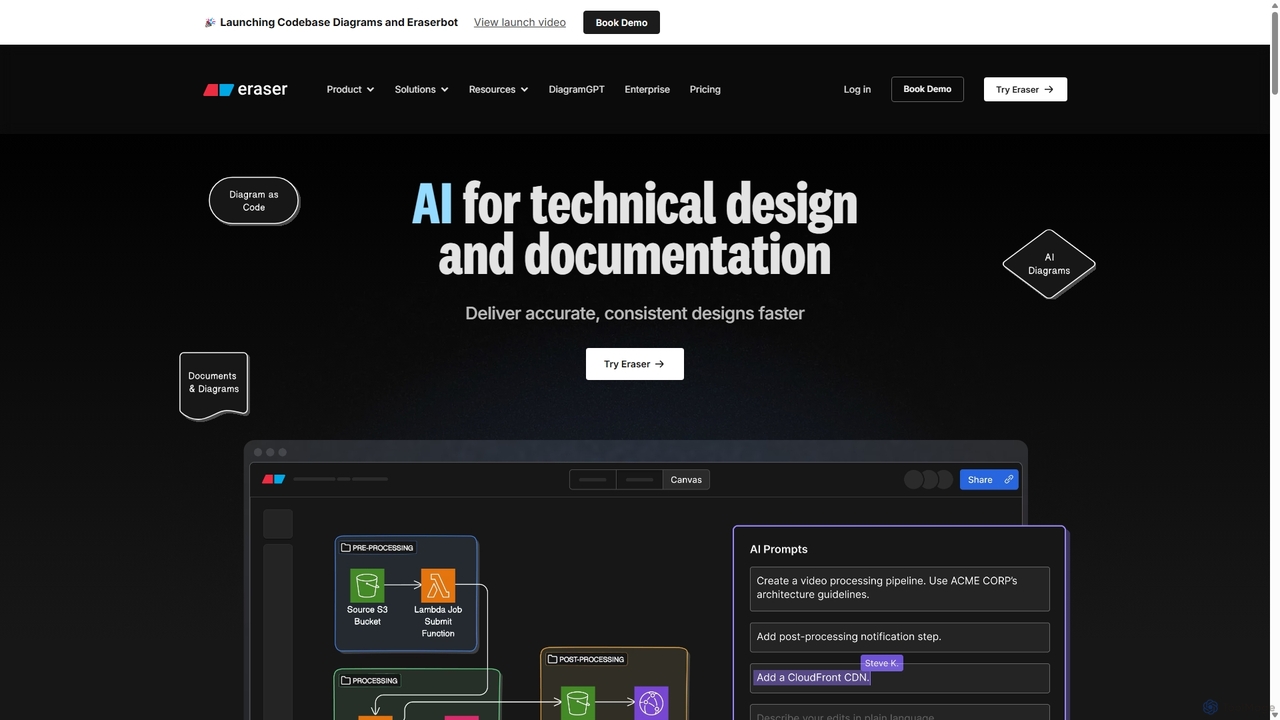
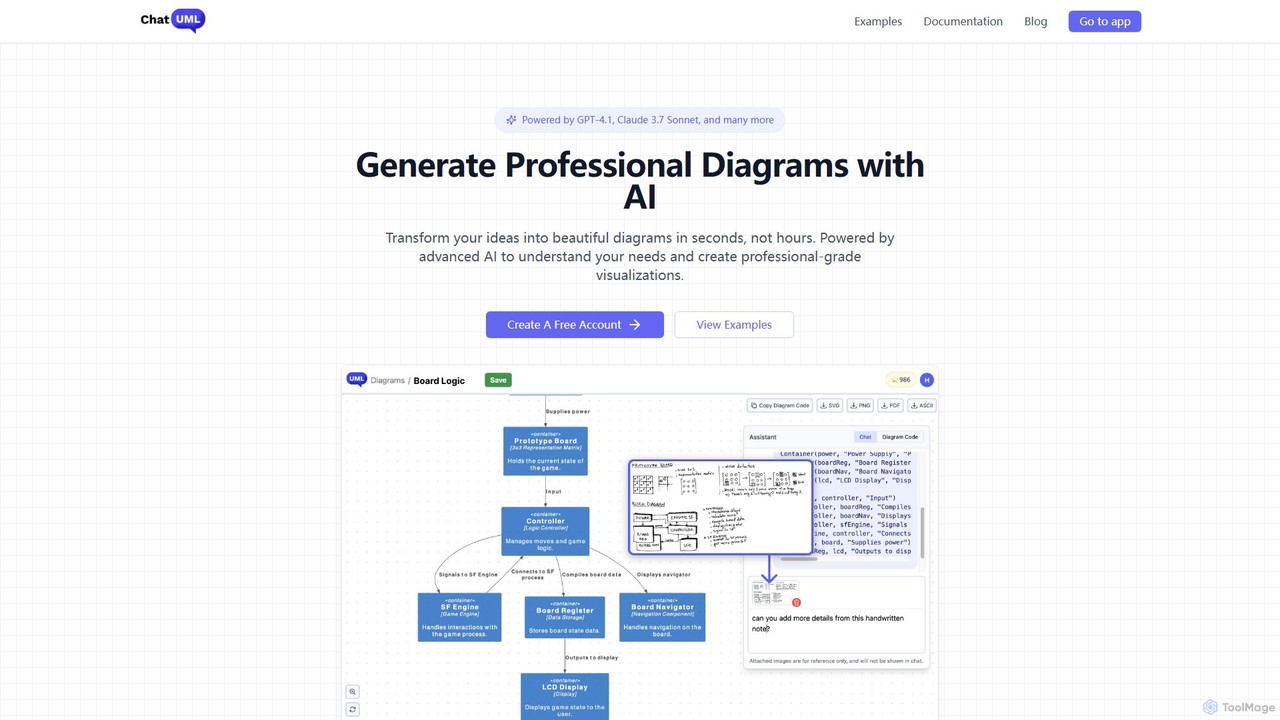

SnapDiagram은 텍스트 설명을 즉시 전문적인 다이어그램으로 변환하는 AI 기반 도구입니다. 간단한 자연어 프롬프트를 사용하여 순서도, 시퀀스 다이어그램, UML 모델, 마인드맵 등을 생성하세요. 다이어그램 작성 프로세스를 자동화하여 개발자, 비즈니스 분석가 및 프로젝트 관리자의 워크플로우를 가속화하도록 설계되었습니다.
워크플로우 관리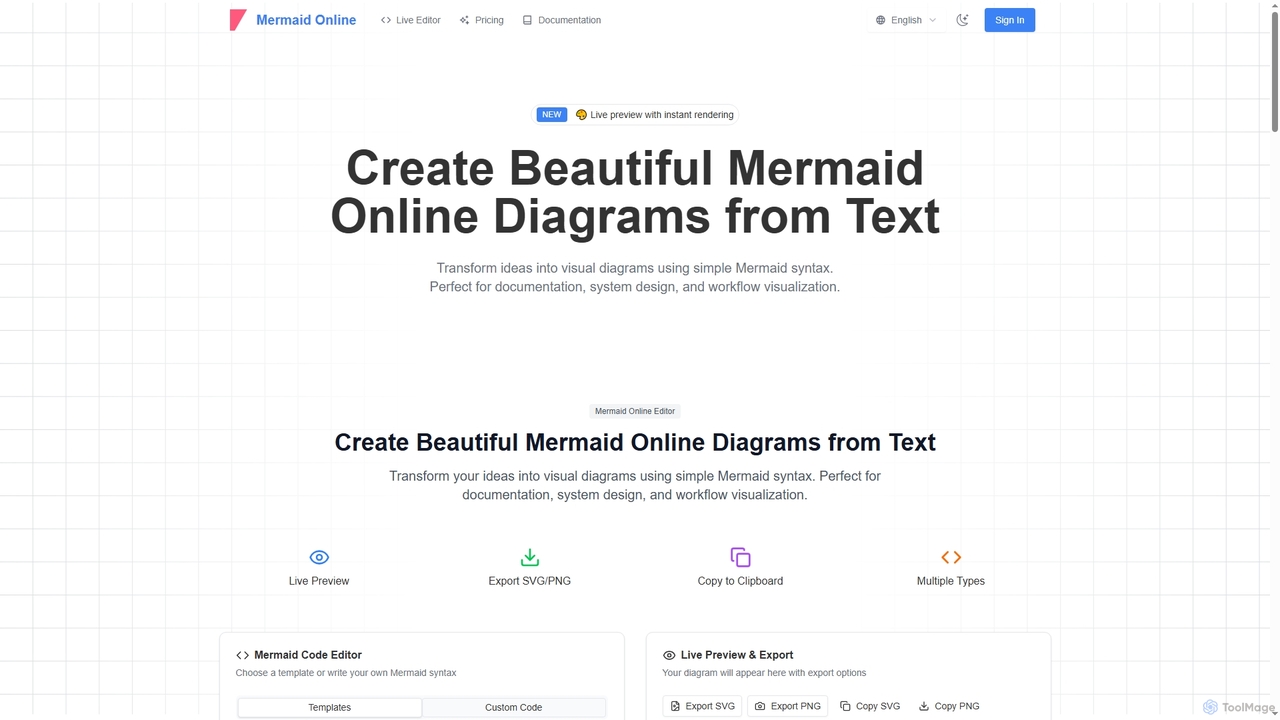
Mermaid Online은 텍스트 설명과 Mermaid 구문을 전문적인 시각 다이어그램으로 변환하는 고급 웹 기반 편집기이자 AI 기반 다이어그램 생성기입니다. 다양한 다이어그램 유형을 지원하며 실시간 미리보기 및 유연한 내보내기 옵션을 제공하여 개인 및 팀의 문서화 및 시스템 설계 워크플로우를 간소화합니다.
텍스트-다이어그램 변환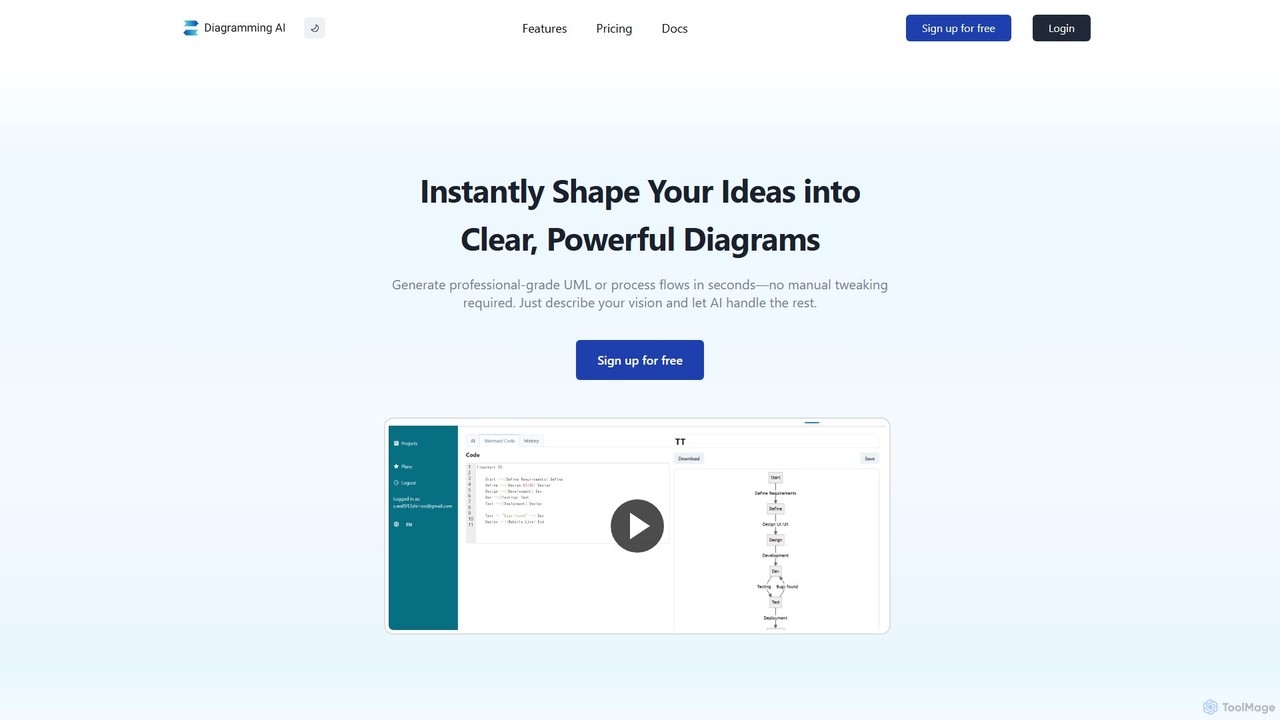
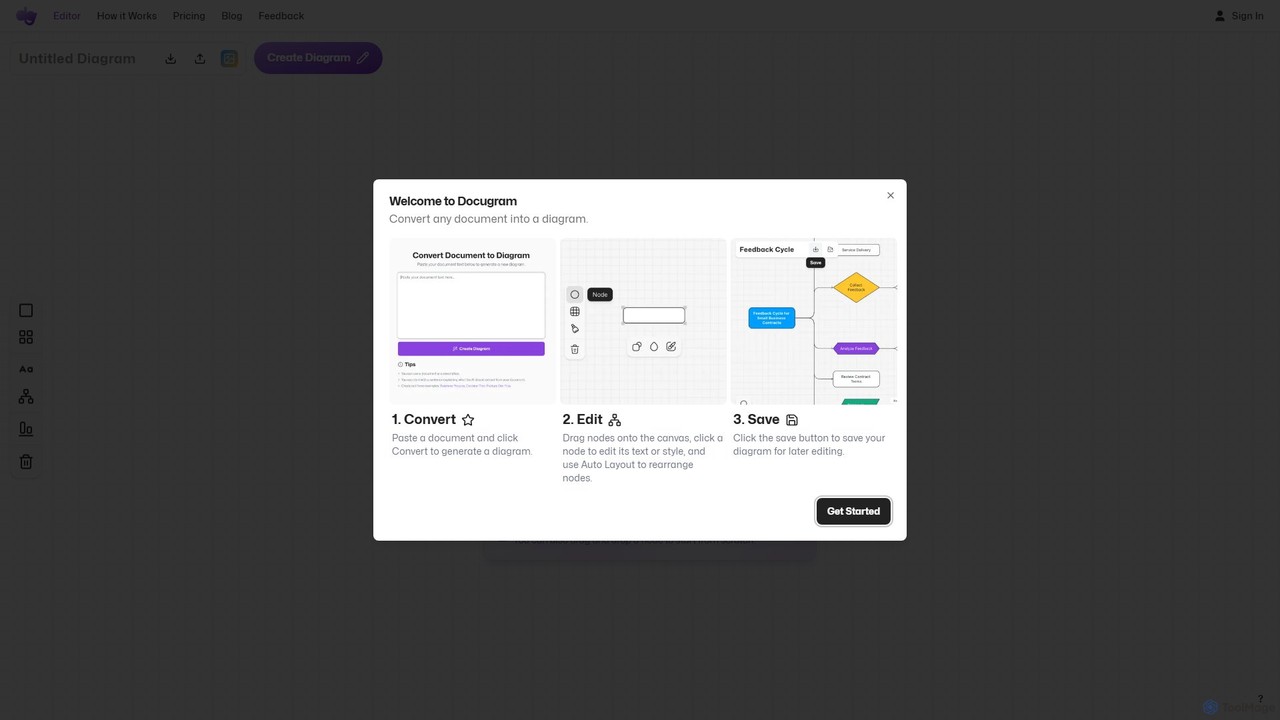
Diagramming AI는 텍스트, URL 또는 이미지에서 다양한 다이어그램을 즉시 생성하고 편집하는 고급 AI 기반 플랫폼입니다. Mermaid, PlantUML, Graphviz와 같은 인기 있는 형식을 지원하며, 실시간 수정을 위한 직관적인 AI 채팅과 정밀 조정을 위한 Excalidraw와의 시각적 편집기 통합 기능을 제공합니다.
시각화