ChartGen
차트 및 그래프 · 148.3K 월 방문
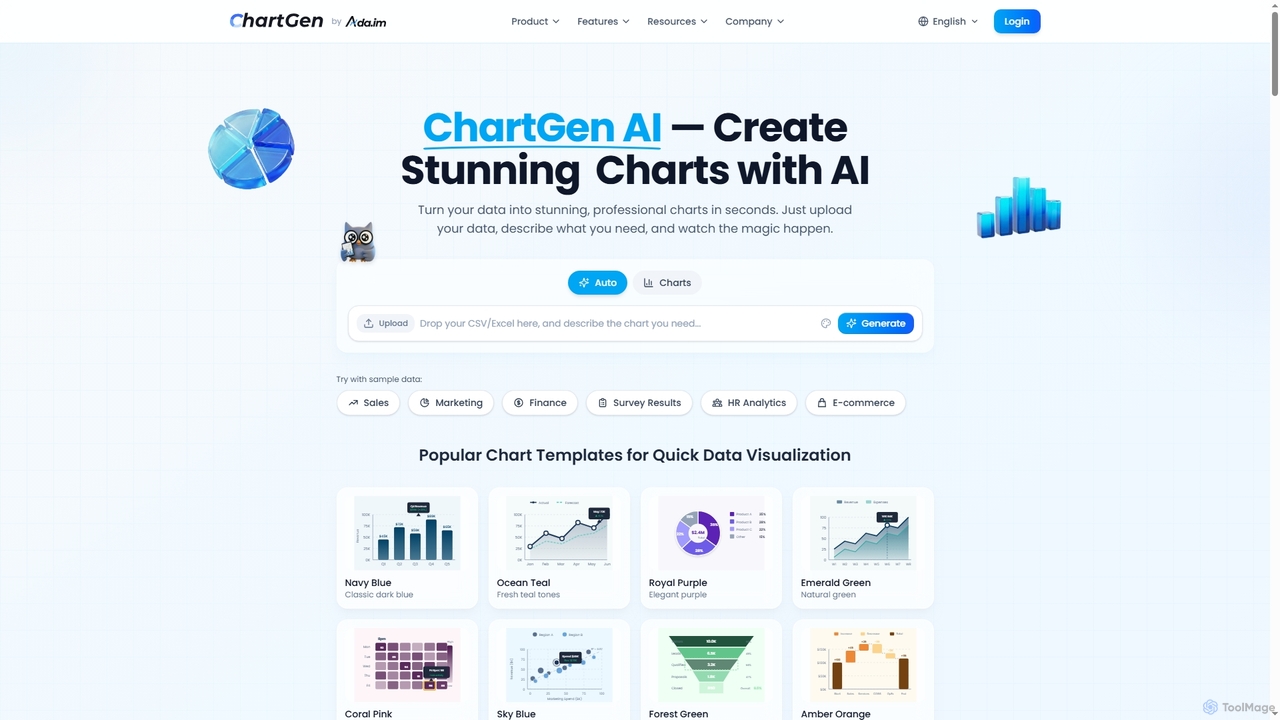
ChartGen은 원시 데이터를 멋지고 전문적인 시각화 차트로 몇 초 만에 변환하는 AI 기반 차트 생성기입니다. 사용자는 CSV 또는 Excel 파일을 업로드하고 원하는 차트를 평이한 영어로 설명하기만 하면 AI가 막대, 선, 원형 차트 등 다양한 차트 유형을 즉시 생성합니다. 디자인 또는 코딩 기술 없이도 빠르고 손쉬운 데이터 시각화를 위해 설계되었습니다.
ChartGen은 원시 데이터를 멋지고 전문적인 시각화 차트로 몇 초 만에 변환하는 AI 기반 차트 생성기입니다. 사용자는 CSV 또는 Excel 파일을 업로드하고 원하는 차트를 평이한 영어로 설명하기만 하면 AI가 막대, 선, 원형 차트 등 다양한 차트 유형을 즉시 생성합니다. 디자인 또는 코딩 기술 없이도 빠르고 손쉬운 데이터 시각화를 위해 설계되었습니다.
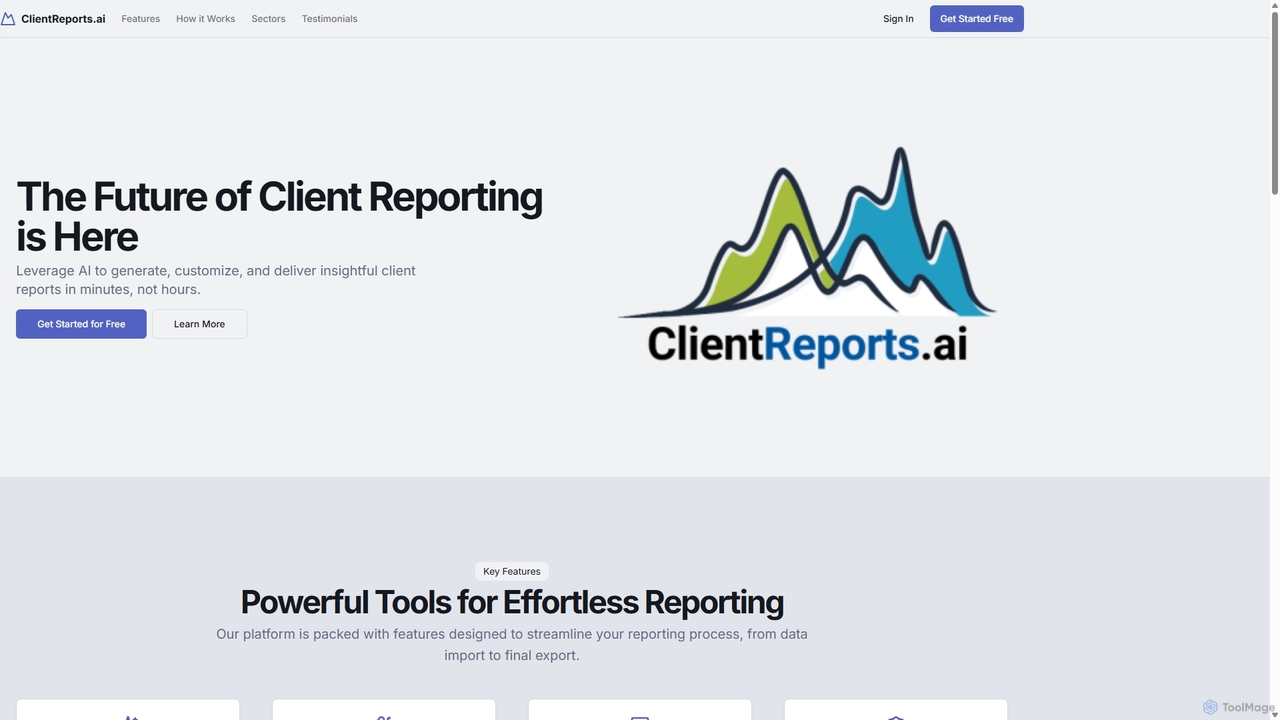
ClientReports.ai는 고객 보고서 작성을 자동화하고 간소화하기 위해 설계된 AI 기반 플랫폼입니다. 다양한 산업 분야의 전문가들이 몇 분 만에 통찰력 있는 보고서를 생성, 맞춤화 및 전달하여 상당한 시간과 노력을 절약할 수 있도록 지원합니다. 이 도구는 AI를 활용하여 콘텐츠 생성, 데이터 분석을 수행하며 안전한 협업 기능을 제공합니다.
ChartGen은 원시 데이터를 멋지고 전문적인 시각화 차트로 몇 초 만에 변환하는 AI 기반 차트 생성기입니다. 사용자는 CSV 또는 Excel 파일을 업로드하고 원하는 차트를 평이한 영어로 설명하기만 하면 AI가 막대, 선, 원형 차트 등 다양한 차트 유형을 즉시 생성합니다. 디자인 또는 코딩 기술 없이도 빠르고 손쉬운 데이터 시각화를 위해 설계되었습니다.
ClientReports.ai는 고객 보고서 작성을 자동화하고 간소화하기 위해 설계된 AI 기반 플랫폼입니다. 다양한 산업 분야의 전문가들이 몇 분 만에 통찰력 있는 보고서를 생성, 맞춤화 및 전달하여 상당한 시간과 노력을 절약할 수 있도록 지원합니다. 이 도구는 AI를 활용하여 콘텐츠 생성, 데이터 분석을 수행하며 안전한 협업 기능을 제공합니다.
| Feature | ChartGen | ClientReports.ai |
|---|---|---|
| 주요 카테고리 | 차트 및 그래프 | 보고 |
| 등록일 | 2026-01-06 | 2025-09-17 |
| 가격 | 프리미엄 | 프리미엄 |
| 공식 사이트 | chartgen.ai | clientreports.ai |
| 제품 유형 | 웹사이트 | 웹사이트 |
| Performance data | ||
| 사용자 평점 | 확인되지 않음 | 확인되지 않음 |
| 댓글 | 0 | 0 |
| 월 방문 | 148.3K | 4.1K |
| 월 성장률 | 49.6% | 확인되지 않음 |
| 즐겨찾기 | 27 | 121 |
| Details | 상세 보기 | 상세 보기 |
Compare ChartGen and ClientReports.ai by monthly reach, traffic trend, visit depth, top regions, and acquisition sources.
In the ChartGen vs ClientReports.ai monthly traffic comparison, ChartGen currently shows 148.3K visits and ClientReports.ai shows 4.1K; ChartGen has about 36.6 times the visible traffic of ClientReports.ai, an absolute difference of about 144.3K visits. This reflects visible reach, not feature quality or paid users.
Only ChartGen has complete third-party traffic details; ClientReports.ai uses visits recorded inside ToolMage. These scopes cannot estimate market share directly, and on-site views should not be treated as the product’s total website traffic.
| Country/region | Percentage | Traffic |
|---|---|---|
| 🇷🇺Russia | 27.78% | 41.2K |
| 🇺🇸United States | 25.7% | 38.1K |
| 🇸🇦Saudi Arabia | 19.54% | 29K |
| 🇮🇳India | 16.87% | 25K |
| 🇬🇧United Kingdom | 10.11% | 15K |
| Source type | Percentage | Traffic |
|---|---|---|
| 직접 | 82.55% | 122.4K |
| 리퍼럴 | 16.19% | 24K |
| 이메일 | 1.26% | 1.9K |
This in-depth ChartGen vs ClientReports.ai comparison uses only the product records, taxonomy, audience, traffic, and community signals available on this page. ChartGen is primarily listed under “차트 및 그래프”, while ClientReports.ai is primarily listed under “보고”, so the first decision is whether your actual task matches their recorded scope.
The structured fields currently show these decision-relevant differences: Primary category (ChartGen: 차트 및 그래프; ClientReports.ai: 보고); Monthly visits (ChartGen: 148.3K; ClientReports.ai: 4.1K); Favorites (ChartGen: 27; ClientReports.ai: 121); Website (ChartGen: chartgen.ai; ClientReports.ai: clientreports.ai); Added (ChartGen: 2026-01-06; ClientReports.ai: 2025-09-17). These facts are more useful for selection than brand visibility alone.
In the ChartGen vs ClientReports.ai monthly traffic comparison, ChartGen currently shows 148.3K visits and ClientReports.ai shows 4.1K; ChartGen has about 36.6 times the visible traffic of ClientReports.ai, an absolute difference of about 144.3K visits. This reflects visible reach, not feature quality or paid users.
Only ChartGen has complete third-party traffic details; ClientReports.ai uses visits recorded inside ToolMage. These scopes cannot estimate market share directly, and on-site views should not be treated as the product’s total website traffic.
The current traffic scope is not sufficient for a reliable product ranking. Treat monthly visits as a market-interest signal, then decide using taxonomy, use cases, pricing, and a like-for-like trial rather than reading exposure as product capability.
ChartGen and ClientReports.ai currently overlap in shared tags: 비즈니스 인텔리전스, 데이터 분석, 데이터 시각화 및 재무 보고; shared roles: 비즈니스 애널리스트, 컨설턴트, 재무 분석가 및 마케팅 매니저. This can place both on the same shortlist, but it does not prove equal implementation, depth, or cost.
ChartGen's unique categories/tags are 차트 및 그래프, 차트 및 다이어그램, AI 차트 생성기, 분석, 차트 메이커, 데이터 보안, 끌어서 놓기 및 부분 유료; ClientReports.ai's are 보고, 분석, 데이터 분석, 자동화, AI 보고서 생성기, 자동 보고서, 비즈니스 보고 및 고객 보고. These unique fields are the strongest differentiators: validate the product whose recorded scope matches the task instead of following traffic alone.
ChartGen has no verified rating, 0 comments, 27 favorites, and 27 likes;ClientReports.ai has no verified rating, 0 comments, 121 favorites, and 117 likes。
Neither product has enough rating or comment samples for a credible reputation ranking.
Put ChartGen on the priority trial list when the task aligns with “차트 및 그래프” and especially 차트 및 그래프, 차트 및 다이어그램, AI 차트 생성기, 분석, 차트 메이커 및 데이터 보안, or the users include 데이터 분석가, 임원, 인사 관리자 및 프로덕트 매니저. This follows recorded positioning and does not imply unlisted capabilities are absent.
ChartGen also currently records: pricing is freemium, product type is website, 148.3K verified monthly visits, no verified user rating. Verify any hard requirement around price, platform, or reach before trial, and do not let sparse review data substitute for testing.
Put ClientReports.ai on the priority trial list when the task aligns with “보고” and especially 보고, 분석, 데이터 분석, 자동화, AI 보고서 생성기 및 자동 보고서, or the users include 회계사, IT 관리자, 변호사 및 경영 컨설턴트. This follows recorded positioning and does not imply unlisted capabilities are absent.
ClientReports.ai also currently records: pricing is freemium, product type is website, 4.1K on-site monthly views, no verified user rating. Verify any hard requirement around price, platform, or reach before trial, and do not let sparse review data substitute for testing.
The available data describes positioning, public visibility, and community signals, but it cannot prove output quality, speed, integration effort, privacy, or long-term cost in your workflow. Before deciding, run the same representative tasks in ChartGen and ClientReports.ai, then record completion time, accuracy, manual corrections, and the real paid threshold. A like-for-like trial turns this comparison into a defensible adoption decision.

ChatBiReport는 AI 기반 비즈니스 인텔리전스 도구로, 자연어 설명을 사용하여 원시 데이터를 멋지고 인터랙티브한 차트와 보고서로 변환합니다. 기업의 데이터 시각화 및 보고를 간소화합니다.
3D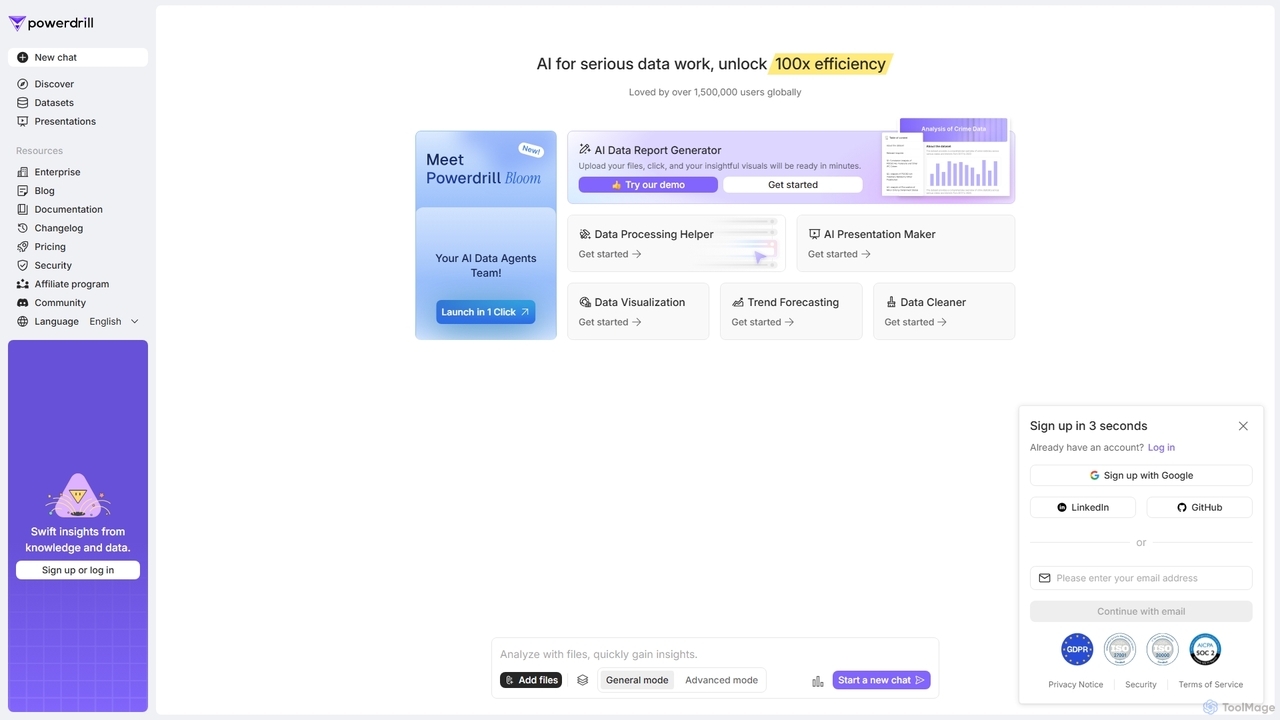
Powerdrill은 진지한 데이터 작업을 위해 설계된 AI 기반 데이터 분석 플랫폼으로, 사용자가 100배의 효율성을 달성할 수 있도록 지원합니다. 데이터 처리 및 정제부터 시각화, 보고서 생성, 추세 예측까지 전체 프로세스를 자동화합니다. 파일을 업로드(Excel, CSV, PDF)하거나 데이터베이스에 연결하기만 하면 AI가 몇 분 안에 실행 가능한 인사이트, 대화형 차트 및 포괄적인 프레젠테이션을 생성합니다.
비즈니스 인텔리전스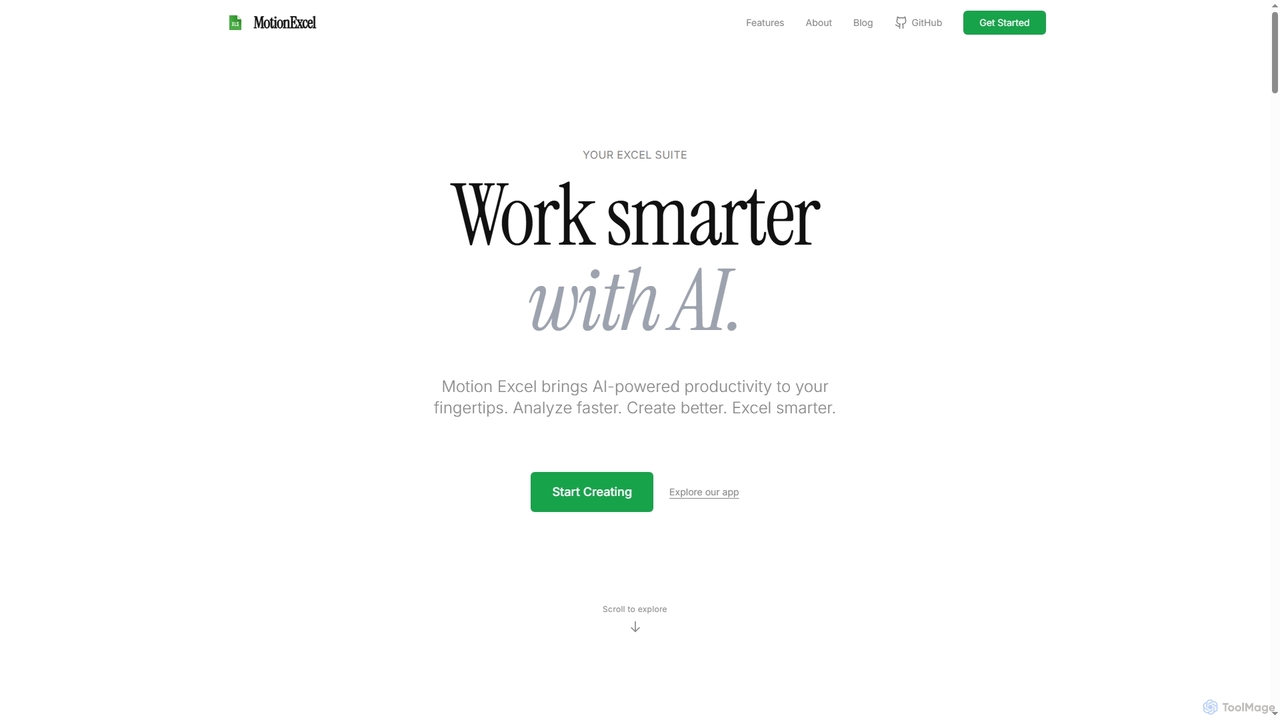
MotionExcel은 인공지능, Python, SQL을 통합하여 데이터 분석 및 자동화를 혁신하는 AI 기반 스프레드시트 편집기입니다. 지능형 에이전트와 고급 기능을 통해 사용자가 데이터를 더 빠르게 분석하고, 더 나은 통찰력을 생성하며, 더 스마트하게 작업할 수 있도록 돕습니다.
스프레드시트
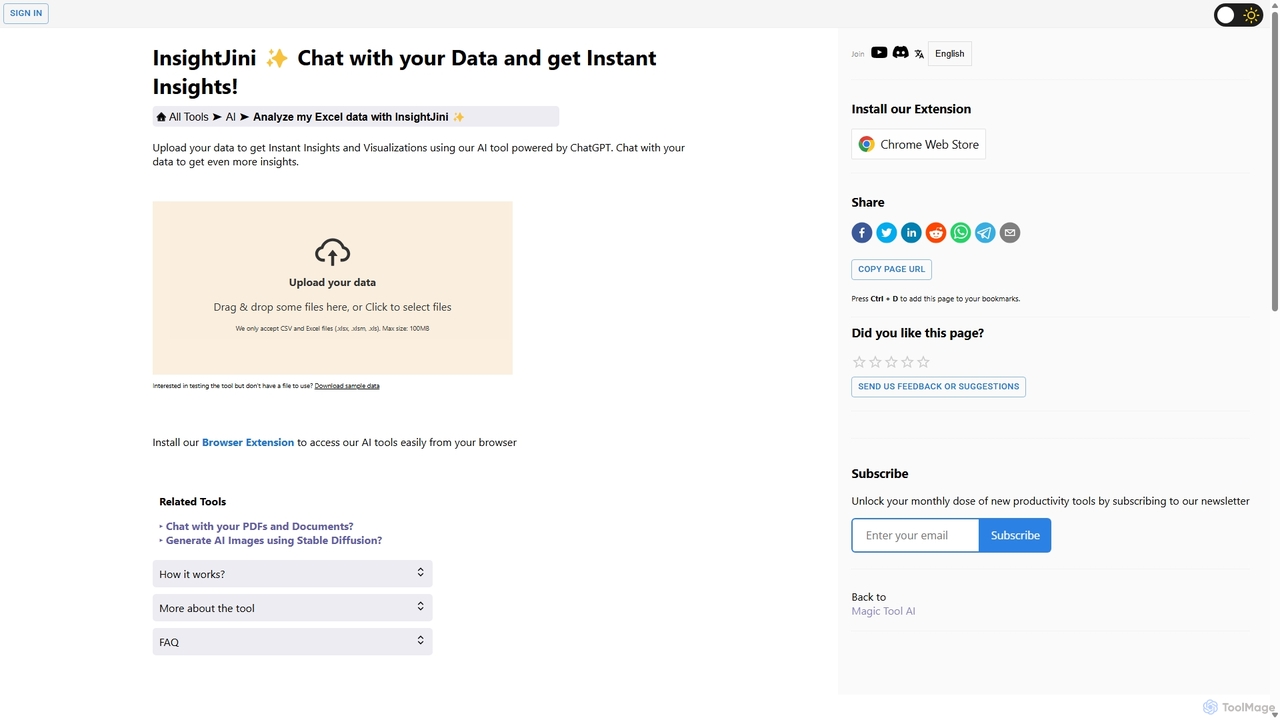
InsightJini는 AI 기반 데이터 분석 도구로, Excel 및 CSV 파일과 채팅할 수 있게 해줍니다. 코딩 없이 데이터를 업로드하여 즉시 시각화 자료와 인사이트를 생성하세요. ChatGPT로 구동되는 대화형 인터페이스는 데이터 탐색을 직관적이고 누구나 쉽게 할 수 있도록 만듭니다.
비즈니스 인텔리전스
간단한 자연어 대화를 통해 데이터를 통찰력 있는 시각화 및 요약으로 변환하는 AI 기반 챗봇입니다. 데이터 세트를 업로드하고 질문하면 즉시 차트, 그래프 및 주요 지표를 받아볼 수 있어 복잡한 소프트웨어나 코딩 기술 없이 누구나 데이터 분석을 쉽게 할 수 있습니다.
비즈니스 인텔리전스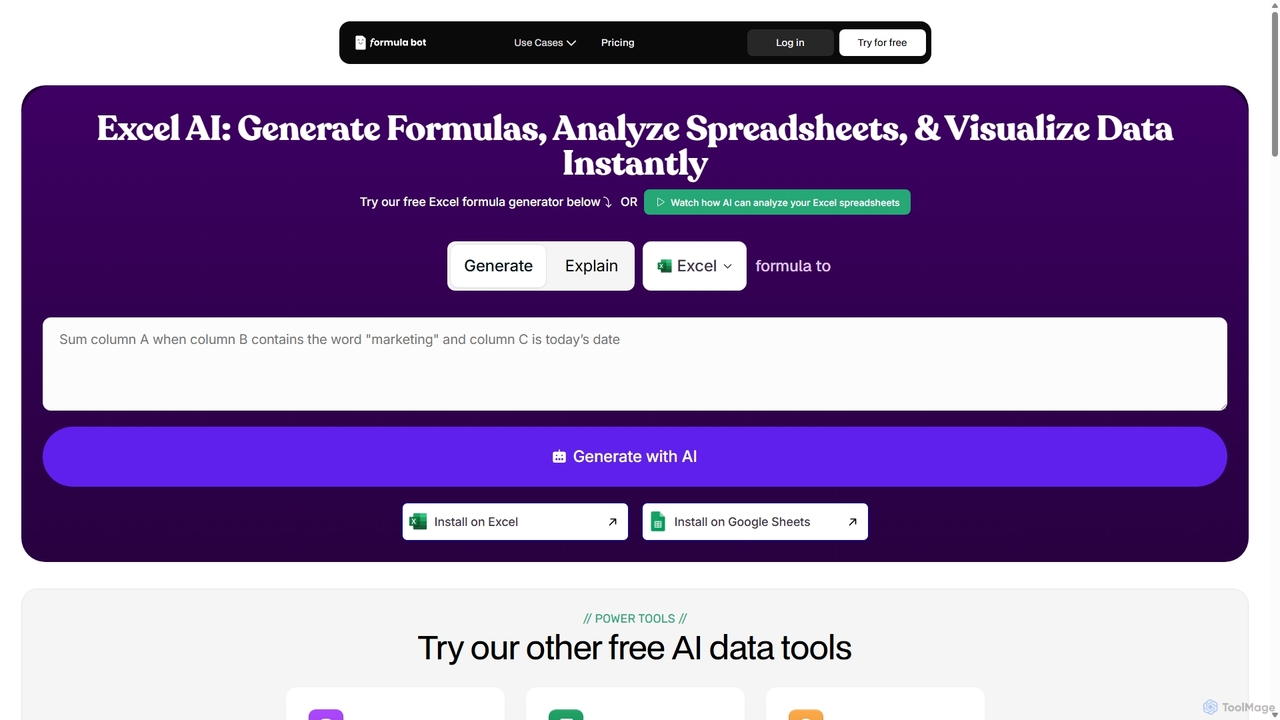
ExcelFormulaBot은 AI 기반 도구로, 텍스트 지침을 몇 초 만에 복잡한 Excel 및 Google Sheets 수식으로 변환합니다. 또한 데이터를 분석하고, 차트를 생성하며, VBA/SQL 코드를 생성하고, 수식을 설명하여 초보자부터 전문가까지 모든 사람이 스프레드시트 작업을 더 빠르고 쉽게 할 수 있도록 돕습니다.
데이터 분석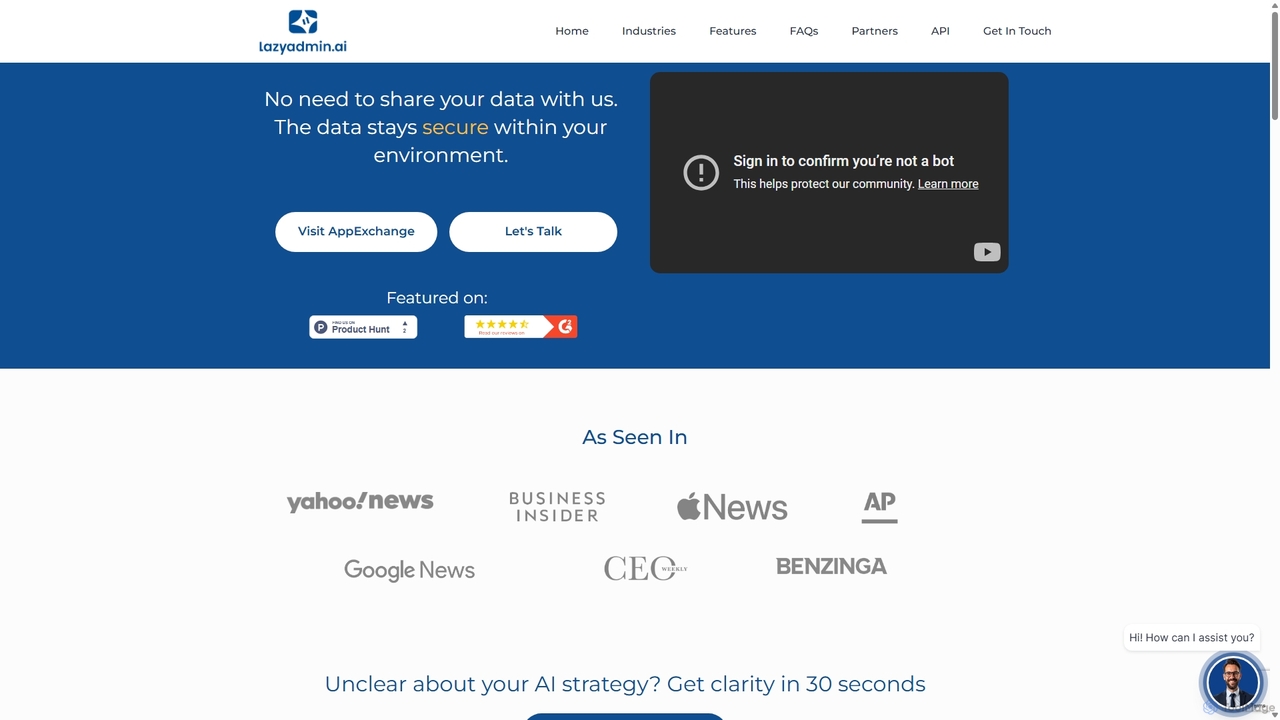
Lazy Admin은 주로 Salesforce를 위해 설계된 AI 기반 데이터 분석 및 보고 솔루션입니다. 사용자가 자연어를 사용하여 데이터를 쿼리하고, 차트를 생성하며, 대시보드를 만들 수 있게 해줍니다. 이 도구는 모든 데이터를 사용자 환경 내에 유지하여 보안을 강조하며, 특정 비즈니스 용어를 이해하도록 개인화할 수 있어 팀의 모든 구성원이 데이터 인사이트에 쉽게 접근할 수 있습니다.
비즈니스 인텔리전스
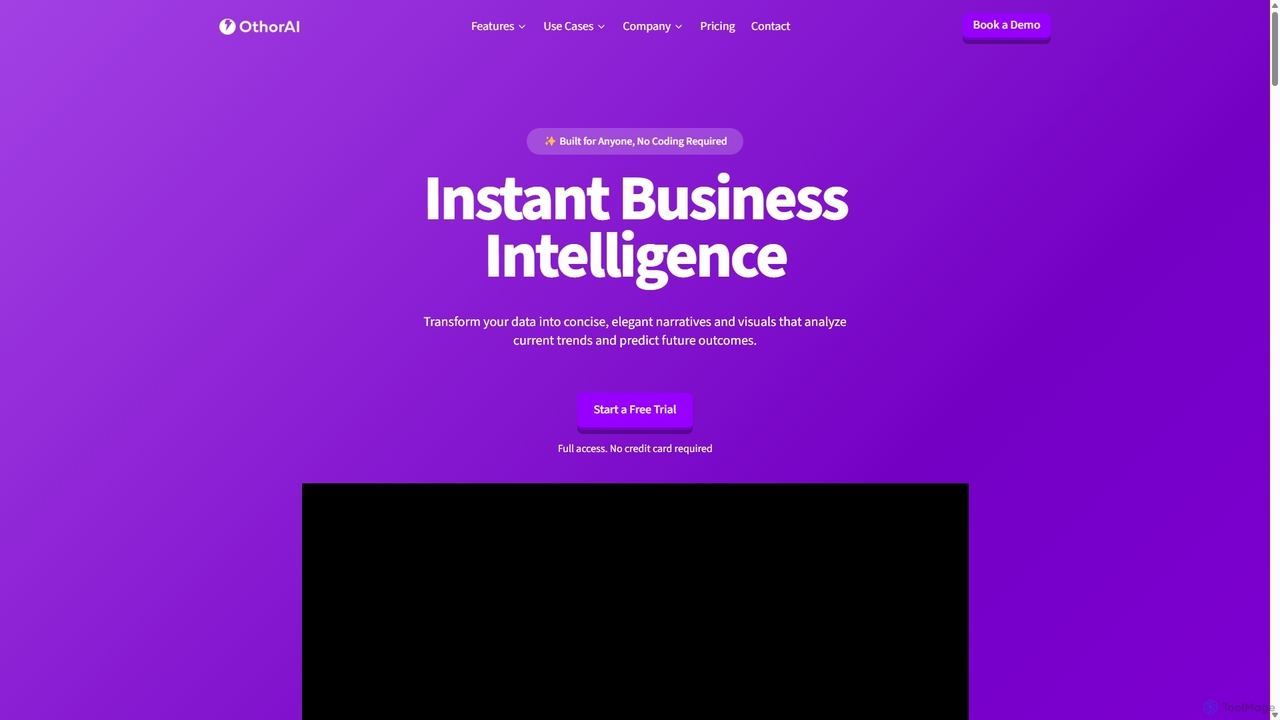
Othor AI는 코딩이 필요 없는 비즈니스 인텔리전스 플랫폼으로, 데이터를 몇 초 만에 실행 가능한 인사이트로 변환합니다. 서술형 보고서, 스마트 차트, 예측 분석을 자동으로 생성하여 조직의 모든 구성원이 기술 전문 지식 없이도 더 빠르고 데이터 기반의 의사 결정을 내릴 수 있도록 지원합니다. 데이터 소스를 연결하고 즉시 대시보드와 경영진 요약을 받아보세요.
비즈니스 인텔리전스