ToolMage
Entrar
Coefficient
Análise de Dados · 161.6K visitas mensais

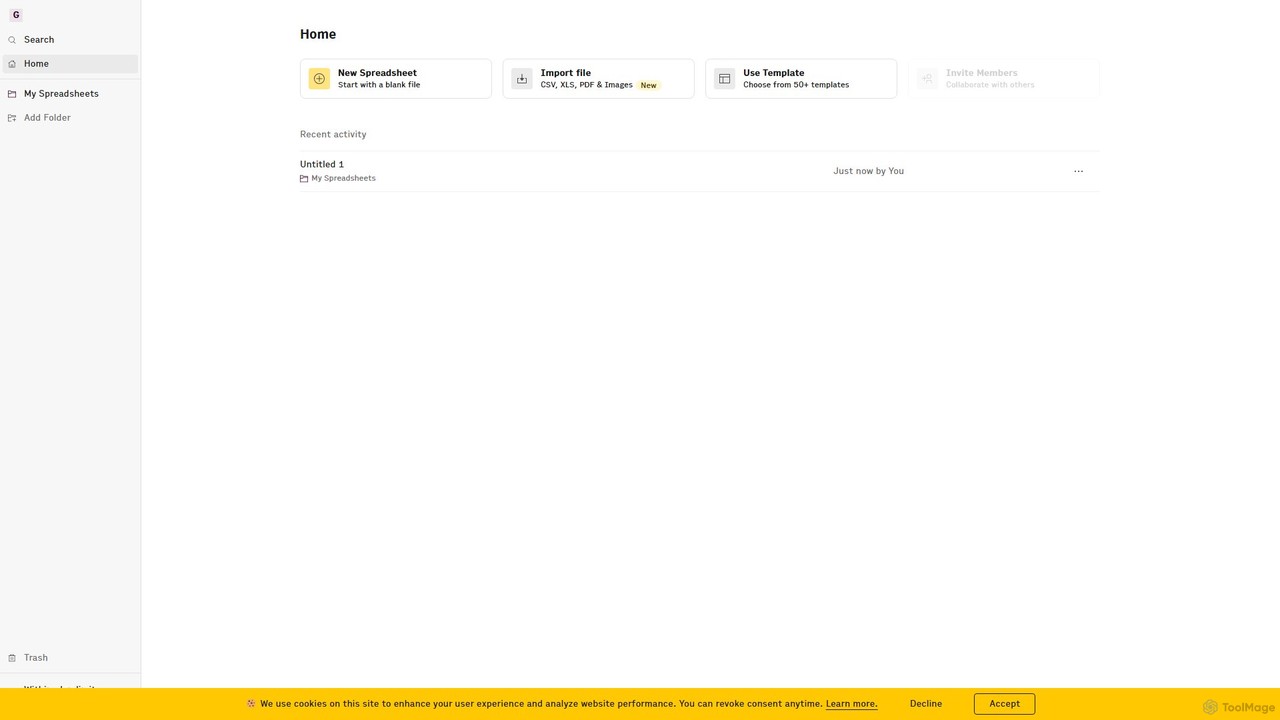
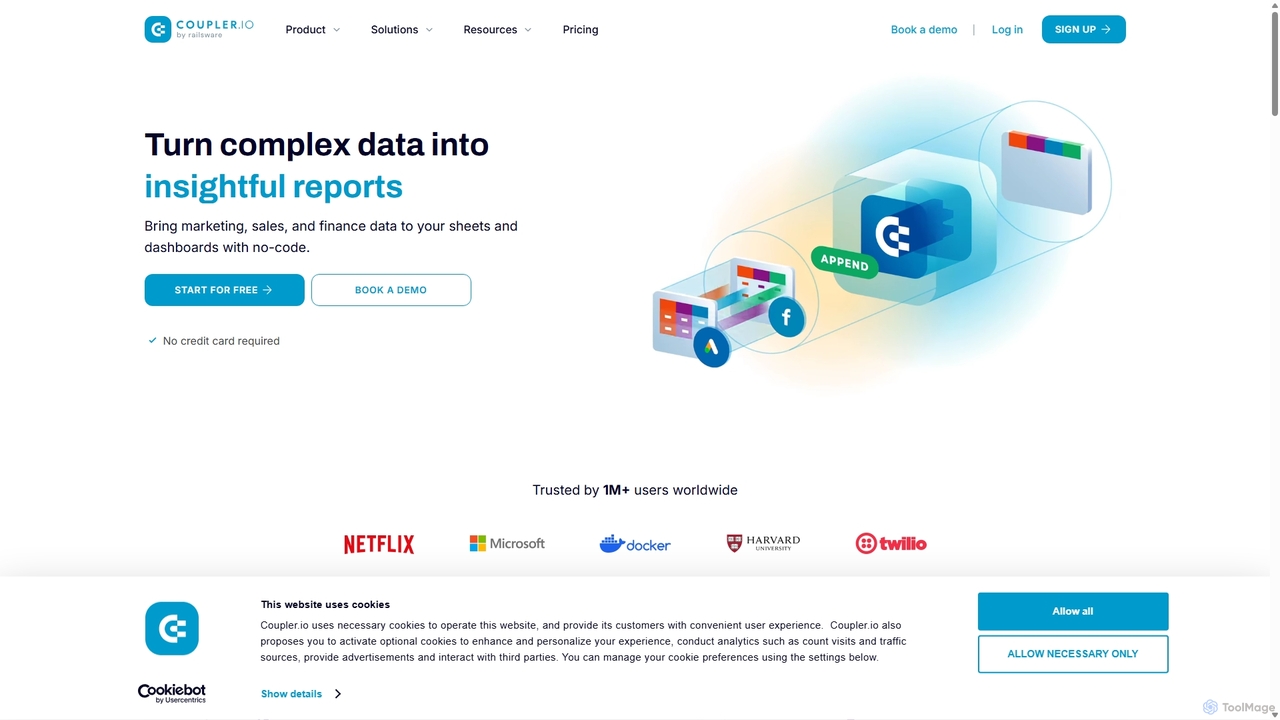
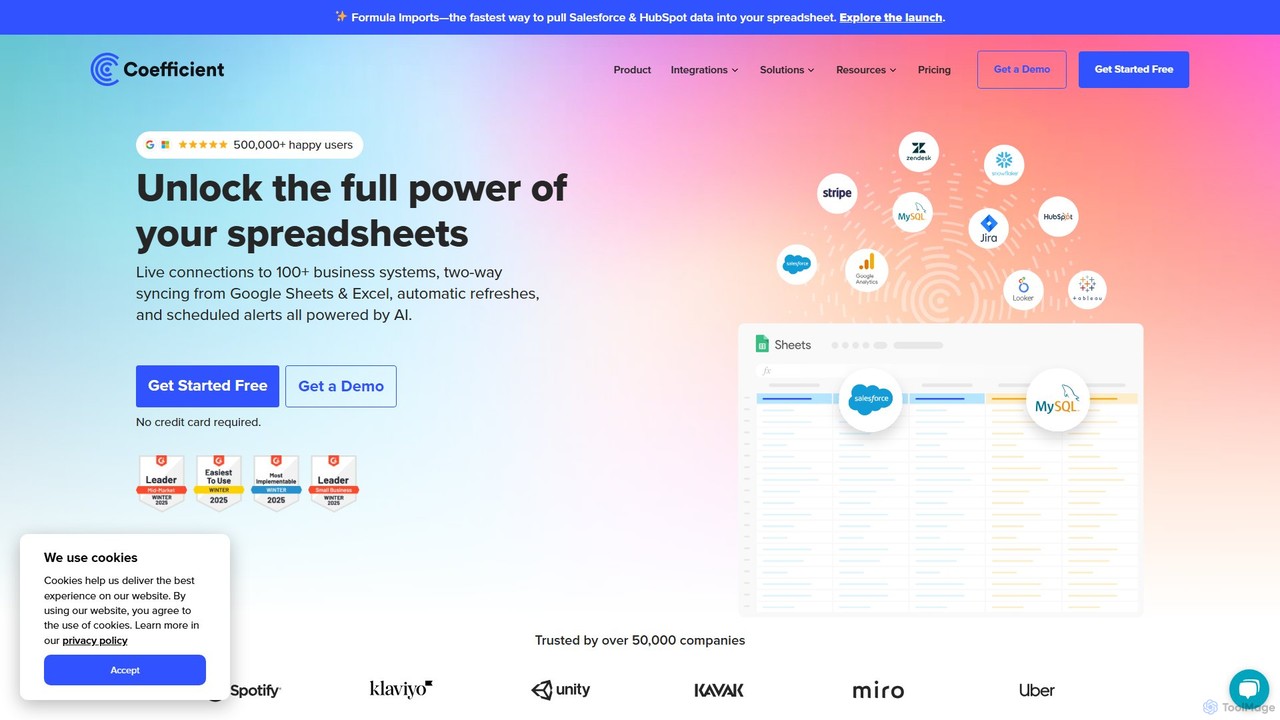
O Coefficient é um conector de dados que liga o Google Sheets e o Excel a mais de 100 sistemas empresariais como Salesforce e HubSpot. Automatiza as importações de dados, permite a sincronização bidirecional e utiliza IA para ajudar os utilizadores a criar fórmulas, consultas SQL e gráficos, transformando folhas de cálculo estáticas em dashboards dinâmicos e em tempo real.

VS
Lifesight
Análise de Dados · 43.6K visitas mensais

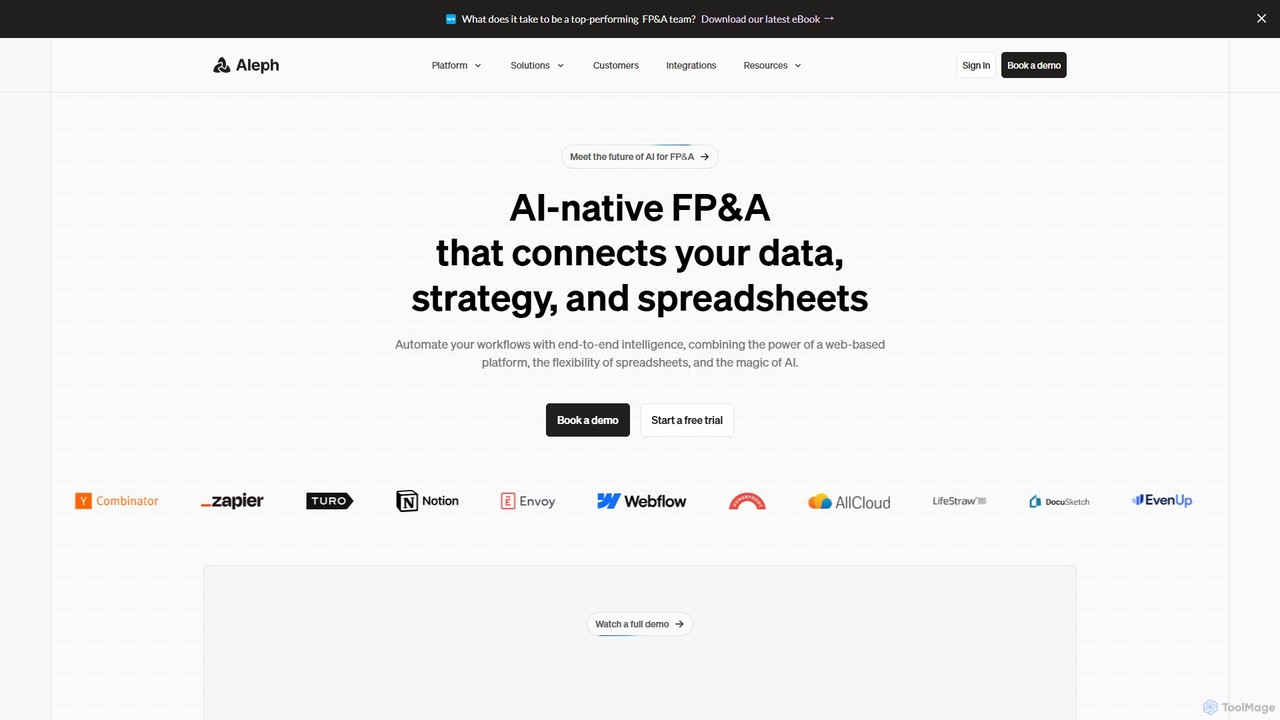
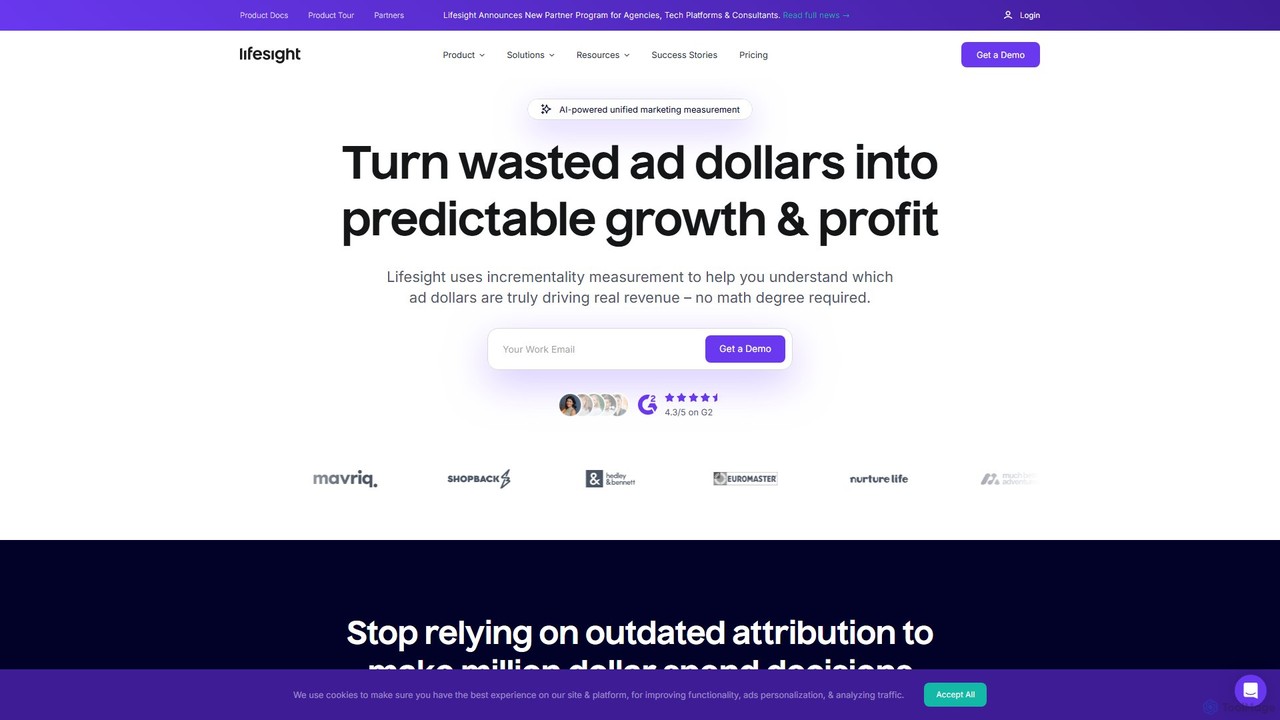
Lifesight é uma plataforma unificada de medição de marketing alimentada por IA que ajuda as empresas a otimizar os gastos com anúncios e a impulsionar um crescimento previsível. Utiliza metodologias avançadas como Modelagem de Mix de Marketing Causal (MMM), Testes de Incrementalidade e Atribuição Causal para revelar o verdadeiro impacto das atividades de marketing. Ao ir além da atribuição tradicional falha, a Lifesight fornece insights acionáveis para maximizar o ROI e alinhar as equipes de marketing e finanças.

Coefficient vs Lifesight: preços, recursos e tráfego

Compare Coefficient e Lifesight por posicionamento, preço, recursos, tráfego e avaliações.

Atualizado 5 de ago. de 2026

Visão geral

Coefficient Visão geral

O Coefficient é um conector de dados que liga o Google Sheets e o Excel a mais de 100 sistemas empresariais como Salesforce e HubSpot. Automatiza as importações de dados, permite a sincronização bidirecional e utiliza IA para ajudar os utilizadores a criar fórmulas, consultas SQL e gráficos, transformando folhas de cálculo estáticas em dashboards dinâmicos e em tempo real.
Preview

Lifesight Visão geral

Lifesight é uma plataforma unificada de medição de marketing alimentada por IA que ajuda as empresas a otimizar os gastos com anúncios e a impulsionar um crescimento previsível. Utiliza metodologias avançadas como Modelagem de Mix de Marketing Causal (MMM), Testes de Incrementalidade e Atribuição Causal para revelar o verdadeiro impacto das atividades de marketing. Ao ir além da atribuição tradicional falha, a Lifesight fornece insights acionáveis para maximizar o ROI e alinhar as equipes de marketing e finanças.

Preview

Detailed feature comparison

FeatureCoefficientLifesight
Categoria principalAnálise de DadosAnálise de Dados
Adicionado2025-08-012025-08-05
PreçoFreemiumPago
Site oficialcoefficient.iolifesight.io
Tipo de produtoExtensão do navegadorSite
Performance data
AvaliaçãoNão verificadoNão verificado
Comentários00
Visitas mensais161.6K43.6K
Crescimento mensal-7.7%-14.9%
Favoritos90100
DetailsVer detalhesVer detalhes

Coefficient vs Lifesight monthly traffic

Compare Coefficient and Lifesight by monthly reach, traffic trend, visit depth, top regions, and acquisition sources.

How to interpret the traffic data

In the Coefficient vs Lifesight monthly traffic comparison, Coefficient currently shows 161.6K visits and Lifesight shows 43.6K; Coefficient has about 3.7 times the visible traffic of Lifesight, an absolute difference of about 118K visits. This reflects visible reach, not feature quality or paid users.

Both tools provide verified traffic details, so monthly trends, visit depth, regions, and acquisition sources can be compared on the same basis.

Coefficient monthly traffic:

Latest traffic

Visitas mensais
161.6K
Duração média
0:50
Páginas por visita
2
Taxa de rejeição
43.1%
Data updated 2026-06-15

Monthly traffic trend

  • 2025/9: 319.4K Visitas mensais
  • 2026/1: 334.5K Visitas mensais
  • 2026/2: 212.8K Visitas mensais
  • 2026/3: 190.8K Visitas mensais
  • 2026/4: 175.1K Visitas mensais
  • 2026/5: 161.6K Visitas mensais

Principais regiões

Top 5 countries/regions
Country/regionPercentageTraffic
🇺🇸United States63.08%102K
🇮🇳India15.95%25.8K
🇵🇭Philippines8.99%14.5K
🇩🇪Germany6.22%10.1K
🇬🇧United Kingdom5.76%9.3K

Fontes de tráfego

Source typePercentageTraffic
Direto65.35%105.6K
Referência31.17%50.4K
E-mail3.48%5.6K

Palavras-chave

coefficientcoefficient aimonthly cash flow template at salvation army on excel free downloadshipping invoice examplesytd profit and loss statement

Lifesight monthly traffic:

Latest traffic

Visitas mensais
43.6K
Duração média
0:37
Páginas por visita
2.11
Taxa de rejeição
36.11%
Data updated 2026-06-15

Monthly traffic trend

  • 2025/9: 99.3K Visitas mensais
  • 2026/1: 82.8K Visitas mensais
  • 2026/2: 57.9K Visitas mensais
  • 2026/3: 56K Visitas mensais
  • 2026/4: 51.3K Visitas mensais
  • 2026/5: 43.6K Visitas mensais

Principais regiões

Top 5 countries/regions
Country/regionPercentageTraffic
🇺🇸United States32.42%14.1K
🇮🇳India28.19%12.3K
🇬🇧United Kingdom13.75%6K
🇻🇳Vietnam13.32%5.8K
🇧🇷Brazil12.32%5.4K

Palavras-chave

lifesightnorthbeampolar analyticsrockerboxworkmagic
Traffic-based selection guidance: If public market visibility is an important first-pass criterion, investigate Coefficient first. The final choice should still follow taxonomy, use case, and a real trial because higher traffic does not prove broader capabilities or better workflow fit.

Usage comparison

Compare the core capabilities of Coefficient and Lifesight

Coefficient Core features

Análise de Dados
Análise
Planilhas
CRM

Lifesight Core features

Análise de Dados
Análise
Previsão

Use cases

Coefficient Use cases

Inteligência de Negócios
análise de dados
automação
Conector de dados
Excel
Google Planilhas
HubSpot
No-code
Relatórios
Salesforce
automação de planilhas

Lifesight Use cases

Inteligência de Negócios
análise de dados
Gastos com publicidade
Atribuição Causal
Previsão
Teste de incrementalidade
Análise de Marketing
Modelagem de Marketing Mix
MMM
Otimização de ROI

Coefficient vs Lifesight:In-depth comparison and selection guidance

First decide whether the products solve the same kind of need

This in-depth Coefficient vs Lifesight comparison uses only the product records, taxonomy, audience, traffic, and community signals available on this page. Coefficient is primarily listed under “Análise de Dados”, while Lifesight is primarily listed under “Análise de Dados”, so the first decision is whether your actual task matches their recorded scope.

The structured fields currently show these decision-relevant differences: Product type (Coefficient: Browser extension; Lifesight: Website); Pricing (Coefficient: Freemium; Lifesight: Paid); Monthly visits (Coefficient: 161.6K; Lifesight: 43.6K); Monthly growth (Coefficient: -7.7%; Lifesight: -14.9%); Favorites (Coefficient: 90; Lifesight: 100). These facts are more useful for selection than brand visibility alone.

What market visibility and monthly traffic mean

In the Coefficient vs Lifesight monthly traffic comparison, Coefficient currently shows 161.6K visits and Lifesight shows 43.6K; Coefficient has about 3.7 times the visible traffic of Lifesight, an absolute difference of about 118K visits. This reflects visible reach, not feature quality or paid users.

Both tools provide verified traffic details, so monthly trends, visit depth, regions, and acquisition sources can be compared on the same basis.

If public market visibility is an important first-pass criterion, investigate Coefficient first. The final choice should still follow taxonomy, use case, and a real trial because higher traffic does not prove broader capabilities or better workflow fit.

Product positioning, use cases, and roles

Coefficient and Lifesight currently overlap in shared categories: Análise de Dados e Análise; shared tags: Inteligência de Negócios e análise de dados. This can place both on the same shortlist, but it does not prove equal implementation, depth, or cost.

Coefficient's unique categories/tags are Planilhas, CRM, automação, Conector de dados, Excel, Google Planilhas, HubSpot e No-code; Lifesight's are Previsão, Gastos com publicidade, Atribuição Causal, Teste de incrementalidade, Análise de Marketing, Modelagem de Marketing Mix, MMM e Otimização de ROI. These unique fields are the strongest differentiators: validate the product whose recorded scope matches the task instead of following traffic alone.

What ratings, comments, and favorites can tell you

Coefficient has no verified rating, 0 comments, 90 favorites, and 99 likes;Lifesight has no verified rating, 0 comments, 100 favorites, and 110 likes。

Neither product has enough rating or comment samples for a credible reputation ranking.

Selection guidance by actual need

When to evaluate Coefficient first

Put Coefficient on the priority trial list when the task aligns with “Análise de Dados” and especially Planilhas, CRM, automação, Conector de dados, Excel e Google Planilhas. This follows recorded positioning and does not imply unlisted capabilities are absent.

Coefficient also currently records: pricing is freemium, product type is browser extension, 161.6K verified monthly visits, no verified user rating. Verify any hard requirement around price, platform, or reach before trial, and do not let sparse review data substitute for testing.

When to evaluate Lifesight first

Put Lifesight on the priority trial list when the task aligns with “Análise de Dados” and especially Previsão, Gastos com publicidade, Atribuição Causal, Teste de incrementalidade, Análise de Marketing e Modelagem de Marketing Mix. This follows recorded positioning and does not imply unlisted capabilities are absent.

Lifesight also currently records: pricing is paid, product type is website, 43.6K verified monthly visits, no verified user rating. Verify any hard requirement around price, platform, or reach before trial, and do not let sparse review data substitute for testing.

How to validate the recommendation before deciding

The available data describes positioning, public visibility, and community signals, but it cannot prove output quality, speed, integration effort, privacy, or long-term cost in your workflow. Before deciding, run the same representative tasks in Coefficient and Lifesight, then record completion time, accuracy, manual corrections, and the real paid threshold. A like-for-like trial turns this comparison into a defensible adoption decision.

FAQ da comparação

How should I choose between Coefficient and Lifesight?
Compare positioning, pricing, taxonomy, and traffic maturity, then verify the latest details on each official website.
Where does this comparison data come from?
The factual baseline is derived from product, taxonomy, traffic, and community data. Reviewed editorial conclusions show their source and verification date.
What do unknown fields mean?
Unknown means there is not enough reliable evidence; the page does not fill gaps with assumptions.