

ToolMage
Đăng nhập
GraphMaker
Kinh doanh thông minh · 17.5K lượt truy cập tháng

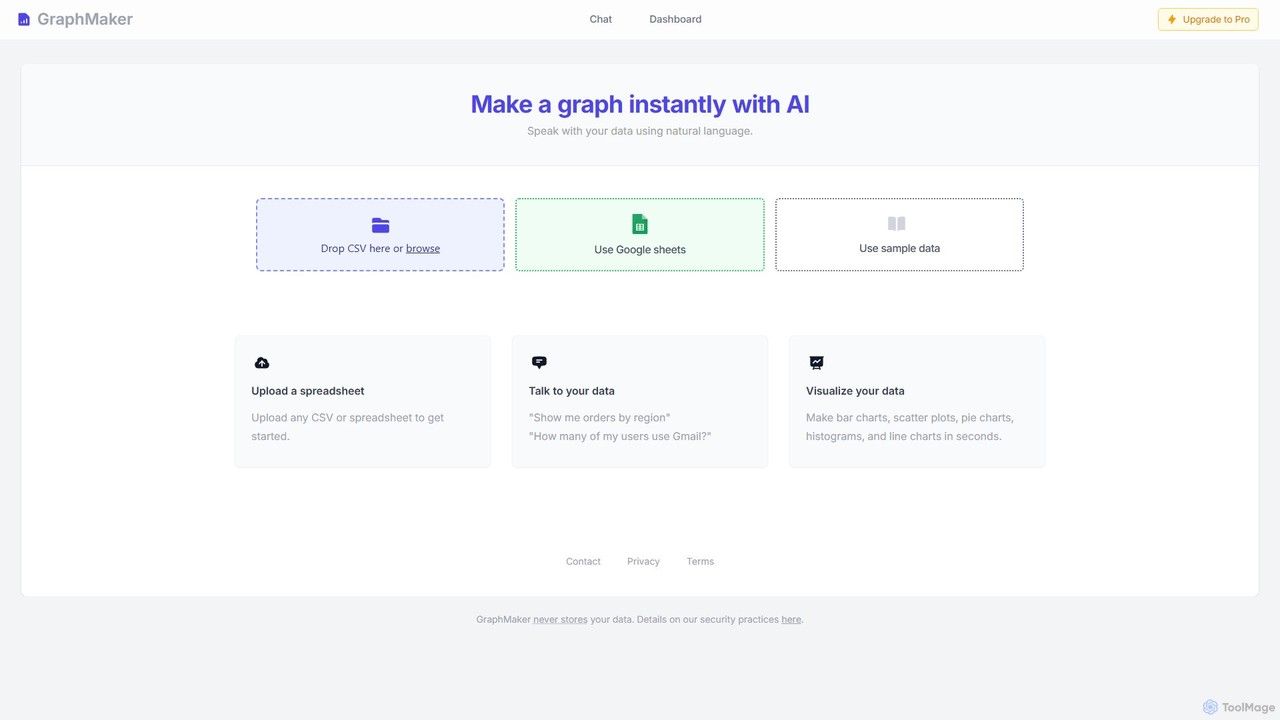
GraphMaker là một công cụ trực quan hóa dữ liệu được hỗ trợ bởi AI, cho phép bạn tạo ra các biểu đồ và đồ thị khác nhau trong vài giây. Chỉ cần tải lên dữ liệu của bạn từ tệp CSV hoặc Google Sheets và sử dụng các lệnh ngôn ngữ tự nhiên để tạo ra các hình ảnh trực quan sâu sắc như biểu đồ cột, biểu đồ tròn và biểu đồ tần suất. Nó được thiết kế vì tốc độ, sự đơn giản và bảo mật, vì nó không bao giờ lưu trữ dữ liệu của bạn.

VS
Kanaries
3D · 155.1K lượt truy cập tháng

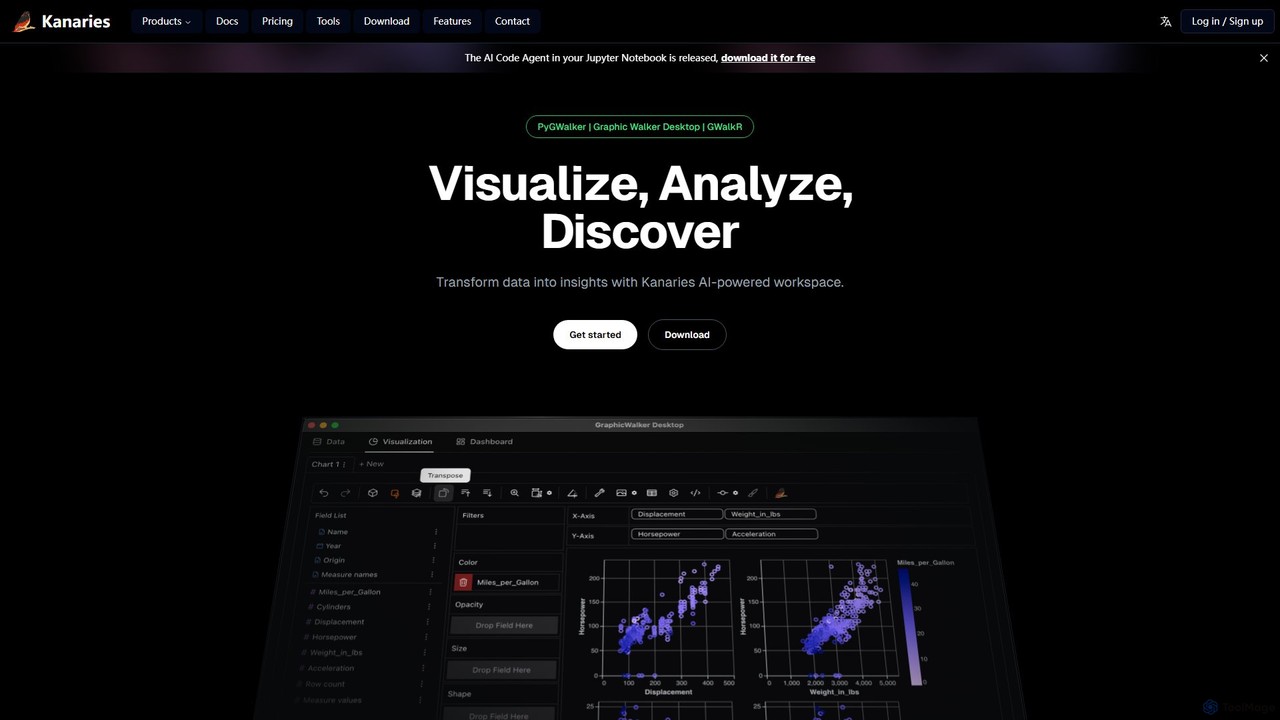
Kanaries là một không gian làm việc được hỗ trợ bởi AI được thiết kế để phân tích dữ liệu khám phá (EDA) và trực quan hóa. Nó cung cấp một bộ công cụ, bao gồm PyGWalker cho Python và GWalkR cho R, giúp chuyển đổi các dataframe thành các ứng dụng phân tích trực quan tương tác chỉ với một dòng mã. Nó có giao diện kéo và thả, trò chuyện AI để truy vấn dữ liệu và các tính năng cộng tác, hợp lý hóa toàn bộ quy trình làm việc từ dữ liệu đến thông tin chi tiết cho các nhà phân tích, nhà khoa học dữ liệu và nhà phát triển.

GraphMaker vs Kanaries: giá, tính năng và lưu lượng

So sánh GraphMaker và Kanaries theo định vị, giá, khả năng, lưu lượng và phản hồi người dùng.

Cập nhật 5 thg 8, 2026

Tổng quan sản phẩm

GraphMaker Tổng quan sản phẩm

GraphMaker là một công cụ trực quan hóa dữ liệu được hỗ trợ bởi AI, cho phép bạn tạo ra các biểu đồ và đồ thị khác nhau trong vài giây. Chỉ cần tải lên dữ liệu của bạn từ tệp CSV hoặc Google Sheets và sử dụng các lệnh ngôn ngữ tự nhiên để tạo ra các hình ảnh trực quan sâu sắc như biểu đồ cột, biểu đồ tròn và biểu đồ tần suất. Nó được thiết kế vì tốc độ, sự đơn giản và bảo mật, vì nó không bao giờ lưu trữ dữ liệu của bạn.
Preview

Kanaries Tổng quan sản phẩm

Kanaries là một không gian làm việc được hỗ trợ bởi AI được thiết kế để phân tích dữ liệu khám phá (EDA) và trực quan hóa. Nó cung cấp một bộ công cụ, bao gồm PyGWalker cho Python và GWalkR cho R, giúp chuyển đổi các dataframe thành các ứng dụng phân tích trực quan tương tác chỉ với một dòng mã. Nó có giao diện kéo và thả, trò chuyện AI để truy vấn dữ liệu và các tính năng cộng tác, hợp lý hóa toàn bộ quy trình làm việc từ dữ liệu đến thông tin chi tiết cho các nhà phân tích, nhà khoa học dữ liệu và nhà phát triển.

Preview

Detailed feature comparison

FeatureGraphMakerKanaries
Danh mục chínhKinh doanh thông minh3D
Ngày thêm2025-08-152025-08-11
GiáFreemiumFreemium
Trang chính thứcwww.graphmaker.aikanaries.net
Loại sản phẩmTrang webTrang web
Performance data
Đánh giá người dùngChưa xác minhChưa xác minh
Bình luận00
Lượt truy cập tháng17.5K155.1K
Tăng trưởng tháng-23.4%-2.3%
Yêu thích105140
DetailsXem chi tiếtXem chi tiết

GraphMaker vs Kanaries monthly traffic

Compare GraphMaker and Kanaries by monthly reach, traffic trend, visit depth, top regions, and acquisition sources.

How to interpret the traffic data

In the GraphMaker vs Kanaries monthly traffic comparison, GraphMaker currently shows 17.5K visits and Kanaries shows 155.1K; Kanaries has about 8.9 times the visible traffic of GraphMaker, an absolute difference of about 137.6K visits. This reflects visible reach, not feature quality or paid users.

Both tools provide verified traffic details, so monthly trends, visit depth, regions, and acquisition sources can be compared on the same basis.

GraphMaker monthly traffic:

Latest traffic

Lượt truy cập tháng
17.5K
Thời lượng trung bình
0:07
Trang mỗi lượt
1.56
Tỷ lệ thoát
40.1%
Data updated 2026-06-15

Monthly traffic trend

  • 2025/9: 109.9K Lượt truy cập tháng
  • 2026/1: 41.1K Lượt truy cập tháng
  • 2026/2: 29.5K Lượt truy cập tháng
  • 2026/3: 34.7K Lượt truy cập tháng
  • 2026/4: 22.9K Lượt truy cập tháng
  • 2026/5: 17.5K Lượt truy cập tháng

Khu vực hàng đầu

Top 5 countries/regions
Country/regionPercentageTraffic
🇺🇸United States44.07%7.7K
🇧🇷Brazil19.78%3.5K
🇬🇧United Kingdom14.08%2.5K
🇮🇳India11.85%2.1K
🇩🇪Germany10.22%1.8K

Từ khóa tìm kiếm

ai tool for bar chartexcel to graph aigraph chart maker aigraph makergraph maker ai

Kanaries monthly traffic:

Latest traffic

Lượt truy cập tháng
155.1K
Thời lượng trung bình
0:45
Trang mỗi lượt
1.54
Tỷ lệ thoát
52.2%
Data updated 2026-06-15

Monthly traffic trend

  • 2025/9: 286.7K Lượt truy cập tháng
  • 2026/1: 197.8K Lượt truy cập tháng
  • 2026/2: 144.5K Lượt truy cập tháng
  • 2026/3: 152.6K Lượt truy cập tháng
  • 2026/4: 158.7K Lượt truy cập tháng
  • 2026/5: 155.1K Lượt truy cập tháng

Khu vực hàng đầu

Top 5 countries/regions
Country/regionPercentageTraffic
🇨🇳China25.12%39K
🇰🇷Korea, Republic of22.09%34.3K
🇺🇸United States19.23%29.8K
🇯🇵Japan18.33%28.4K
🇩🇪Germany15.23%23.6K

Nguồn lưu lượng

Source typePercentageTraffic
Trực tiếp50.41%78.2K
Giới thiệu48.97%75.9K
Email0.62%962

Từ khóa tìm kiếm

chatgpt jailbreak promptgemini和chatgpt区别gemini和gpt订阅哪一个pygwalker在线 地图气泡图
Traffic-based selection guidance: If public market visibility is an important first-pass criterion, investigate Kanaries first. The final choice should still follow taxonomy, use case, and a real trial because higher traffic does not prove broader capabilities or better workflow fit.

Usage comparison

Compare the core capabilities of GraphMaker and Kanaries

GraphMaker Core features

Kinh doanh thông minh
Trực quan hóa
Phân tích Dữ liệu

Kanaries Core features

Kinh doanh thông minh
3D
Công cụ dành cho nhà phát triển

Use cases

GraphMaker Use cases

Trí tuệ doanh nghiệp
Công cụ tạo biểu đồ
phân tích dữ liệu
trực quan hóa dữ liệu
Phân tích dữ liệu AI
CSV sang biểu đồ
Google Trang tính
Trình tạo đồ thị
xử lý ngôn ngữ tự nhiên
No-code

Kanaries Use cases

Trí tuệ doanh nghiệp
Công cụ tạo biểu đồ
phân tích dữ liệu
trực quan hóa dữ liệu
Tác nhân mã AI
kéo và thả
EDA
Phân tích dữ liệu khám phá
Jupyter Notebook
pandas
Python
R

GraphMaker vs Kanaries:In-depth comparison and selection guidance

First decide whether the products solve the same kind of need

This in-depth GraphMaker vs Kanaries comparison uses only the product records, taxonomy, audience, traffic, and community signals available on this page. GraphMaker is primarily listed under “Kinh doanh thông minh”, while Kanaries is primarily listed under “3D”, so the first decision is whether your actual task matches their recorded scope.

The structured fields currently show these decision-relevant differences: Primary category (GraphMaker: Kinh doanh thông minh; Kanaries: 3D); Monthly visits (GraphMaker: 17.5K; Kanaries: 155.1K); Monthly growth (GraphMaker: -23.4%; Kanaries: -2.3%); Favorites (GraphMaker: 105; Kanaries: 140); Website (GraphMaker: www.graphmaker.ai; Kanaries: kanaries.net). These facts are more useful for selection than brand visibility alone.

What market visibility and monthly traffic mean

In the GraphMaker vs Kanaries monthly traffic comparison, GraphMaker currently shows 17.5K visits and Kanaries shows 155.1K; Kanaries has about 8.9 times the visible traffic of GraphMaker, an absolute difference of about 137.6K visits. This reflects visible reach, not feature quality or paid users.

Both tools provide verified traffic details, so monthly trends, visit depth, regions, and acquisition sources can be compared on the same basis.

If public market visibility is an important first-pass criterion, investigate Kanaries first. The final choice should still follow taxonomy, use case, and a real trial because higher traffic does not prove broader capabilities or better workflow fit.

Product positioning, use cases, and roles

GraphMaker and Kanaries currently overlap in shared categories: Kinh doanh thông minh; shared tags: Trí tuệ doanh nghiệp, Công cụ tạo biểu đồ, phân tích dữ liệu và trực quan hóa dữ liệu. This can place both on the same shortlist, but it does not prove equal implementation, depth, or cost.

GraphMaker's unique categories/tags are Trực quan hóa, Phân tích Dữ liệu, Phân tích dữ liệu AI, CSV sang biểu đồ, Google Trang tính, Trình tạo đồ thị, xử lý ngôn ngữ tự nhiên và No-code; Kanaries's are 3D, Công cụ dành cho nhà phát triển, Tác nhân mã AI, kéo và thả, EDA, Phân tích dữ liệu khám phá, Jupyter Notebook và pandas. These unique fields are the strongest differentiators: validate the product whose recorded scope matches the task instead of following traffic alone.

What ratings, comments, and favorites can tell you

GraphMaker has no verified rating, 0 comments, 105 favorites, and 125 likes;Kanaries has no verified rating, 0 comments, 140 favorites, and 141 likes。

Neither product has enough rating or comment samples for a credible reputation ranking.

Selection guidance by actual need

When to evaluate GraphMaker first

Put GraphMaker on the priority trial list when the task aligns with “Kinh doanh thông minh” and especially Trực quan hóa, Phân tích Dữ liệu, Phân tích dữ liệu AI, CSV sang biểu đồ, Google Trang tính và Trình tạo đồ thị. This follows recorded positioning and does not imply unlisted capabilities are absent.

GraphMaker also currently records: pricing is freemium, product type is website, 17.5K verified monthly visits, no verified user rating. Verify any hard requirement around price, platform, or reach before trial, and do not let sparse review data substitute for testing.

When to evaluate Kanaries first

Put Kanaries on the priority trial list when the task aligns with “3D” and especially 3D, Công cụ dành cho nhà phát triển, Tác nhân mã AI, kéo và thả, EDA và Phân tích dữ liệu khám phá. This follows recorded positioning and does not imply unlisted capabilities are absent.

Kanaries also currently records: pricing is freemium, product type is website, 155.1K verified monthly visits, no verified user rating. Verify any hard requirement around price, platform, or reach before trial, and do not let sparse review data substitute for testing.

How to validate the recommendation before deciding

The available data describes positioning, public visibility, and community signals, but it cannot prove output quality, speed, integration effort, privacy, or long-term cost in your workflow. Before deciding, run the same representative tasks in GraphMaker and Kanaries, then record completion time, accuracy, manual corrections, and the real paid threshold. A like-for-like trial turns this comparison into a defensible adoption decision.

Câu hỏi thường gặp

How should I choose between GraphMaker and Kanaries?
Compare positioning, pricing, taxonomy, and traffic maturity, then verify the latest details on each official website.
Where does this comparison data come from?
The factual baseline is derived from product, taxonomy, traffic, and community data. Reviewed editorial conclusions show their source and verification date.
What do unknown fields mean?
Unknown means there is not enough reliable evidence; the page does not fill gaps with assumptions.