

ToolMage
Anmelden
Rollstack
Business Intelligence · 17.4K monatliche besuche

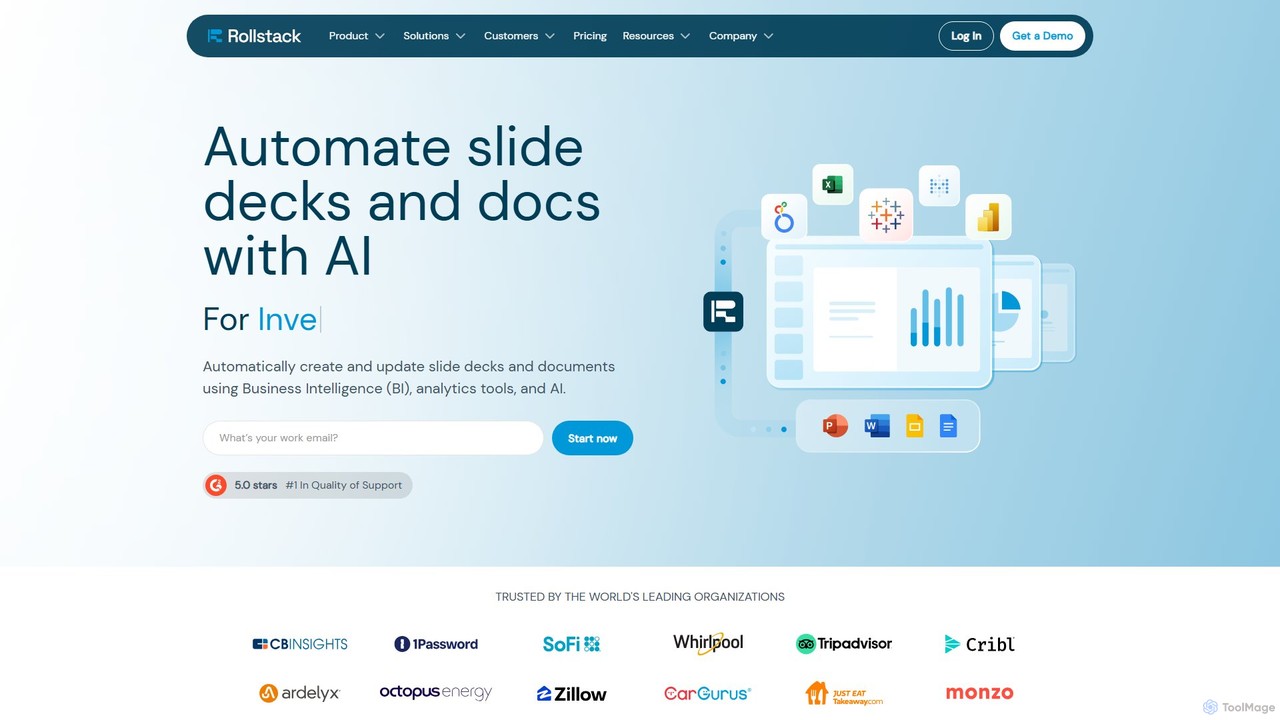
Rollstack ist eine Automatisierungsplattform, die Ihre Business-Intelligence-Tools (wie Tableau, Power BI, Looker) und Data Warehouses (Snowflake) direkt mit PowerPoint und Google Slides verbindet. Sie eliminiert manuelle Dateneingabe und das Erstellen von Screenshots, sodass Teams datengesteuerte Präsentationen automatisch erstellen und aktualisieren können. Dies spart erheblich Zeit, reduziert Fehler und stellt sicher, dass Berichte immer auf den neuesten Daten basieren.

VS
Ultimaps
Business Intelligence · 135.3K monatliche besuche

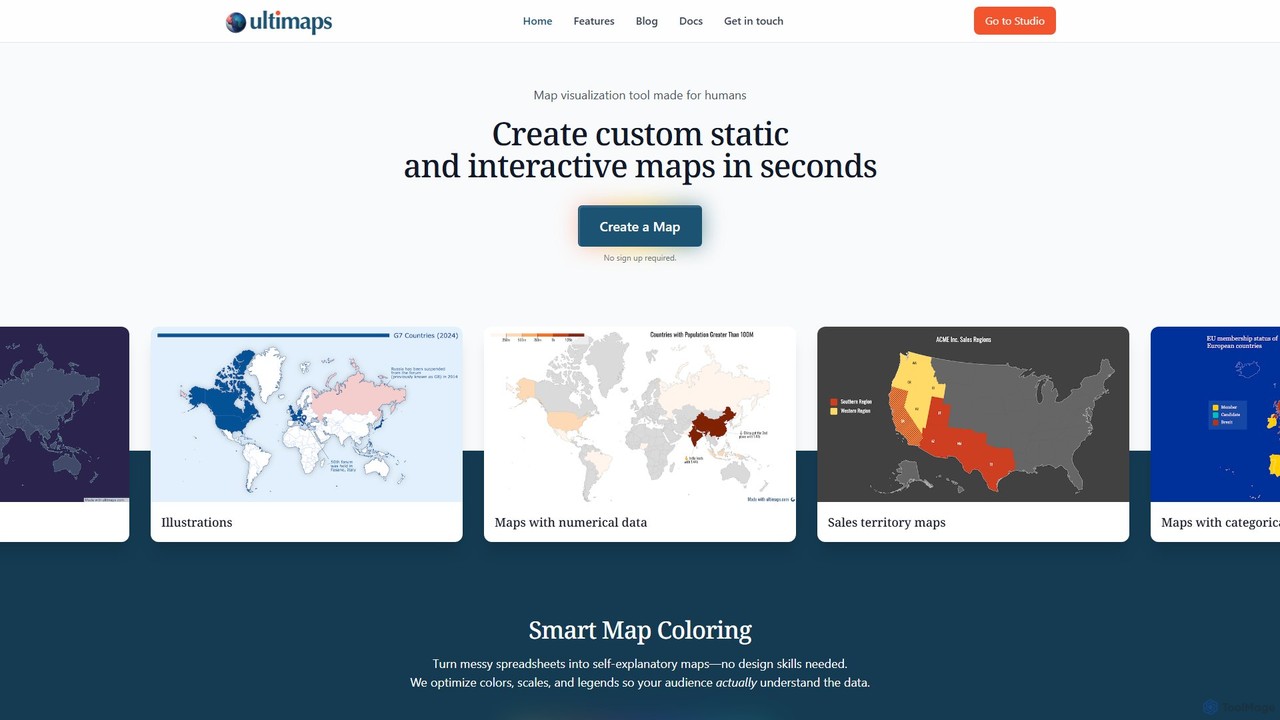
Ultimaps ist ein KI-gestütztes Kartenvisualisierungstool, mit dem jeder in Sekundenschnelle beeindruckende statische und interaktive Karten erstellen kann. Importieren Sie Daten aus Tabellenkalkulationen, verwenden Sie KI-Anweisungen oder färben Sie manuell. Es optimiert automatisch Farben, Skalen und Legenden, um komplexe Daten ohne Designkenntnisse in klare, präsentationsfertige Visualisierungen umzuwandeln.

Rollstack vs Ultimaps: Preise, Funktionen und Traffic

Vergleiche Rollstack und Ultimaps nach Positionierung, Preis, Funktionen, Traffic und Nutzerfeedback.

Aktualisiert 05.08.2026

Produktübersicht

Rollstack Produktübersicht

Rollstack ist eine Automatisierungsplattform, die Ihre Business-Intelligence-Tools (wie Tableau, Power BI, Looker) und Data Warehouses (Snowflake) direkt mit PowerPoint und Google Slides verbindet. Sie eliminiert manuelle Dateneingabe und das Erstellen von Screenshots, sodass Teams datengesteuerte Präsentationen automatisch erstellen und aktualisieren können. Dies spart erheblich Zeit, reduziert Fehler und stellt sicher, dass Berichte immer auf den neuesten Daten basieren.
Preview

Ultimaps Produktübersicht

Ultimaps ist ein KI-gestütztes Kartenvisualisierungstool, mit dem jeder in Sekundenschnelle beeindruckende statische und interaktive Karten erstellen kann. Importieren Sie Daten aus Tabellenkalkulationen, verwenden Sie KI-Anweisungen oder färben Sie manuell. Es optimiert automatisch Farben, Skalen und Legenden, um komplexe Daten ohne Designkenntnisse in klare, präsentationsfertige Visualisierungen umzuwandeln.

Preview

Detailed feature comparison

FeatureRollstackUltimaps
HauptkategorieBusiness IntelligenceBusiness Intelligence
Hinzugefügt2025-08-092025-08-10
PreismodellKostenpflichtigFreemium
Offizielle Websitewww.rollstack.comultimaps.com
ProdukttypWebsiteWebsite
Performance data
NutzerbewertungNicht verifiziertNicht verifiziert
Kommentare00
Monatliche Besuche17.4K135.3K
Monatliches Wachstum-7.9%27.1%
Favoriten116102
DetailsDetails ansehenDetails ansehen

Rollstack vs Ultimaps monthly traffic

Compare Rollstack and Ultimaps by monthly reach, traffic trend, visit depth, top regions, and acquisition sources.

How to interpret the traffic data

In the Rollstack vs Ultimaps monthly traffic comparison, Rollstack currently shows 17.4K visits and Ultimaps shows 135.3K; Ultimaps has about 7.8 times the visible traffic of Rollstack, an absolute difference of about 117.8K visits. This reflects visible reach, not feature quality or paid users.

Both tools provide verified traffic details, so monthly trends, visit depth, regions, and acquisition sources can be compared on the same basis.

Rollstack monthly traffic:

Latest traffic

Monatliche Besuche
17.4K
Ø Besuchsdauer
1:08
Seiten pro Besuch
1.88
Absprungrate
36.21%
Data updated 2026-06-15

Monthly traffic trend

  • 2025/9: 19.8K Monatliche Besuche
  • 2026/1: 20.2K Monatliche Besuche
  • 2026/2: 19.6K Monatliche Besuche
  • 2026/3: 20.8K Monatliche Besuche
  • 2026/4: 18.9K Monatliche Besuche
  • 2026/5: 17.4K Monatliche Besuche

Top-Regionen

Top 5 countries/regions
Country/regionPercentageTraffic
🇺🇸United States51.29%8.9K
🇮🇳India17.69%3.1K
🇩🇪Germany11.83%2.1K
🇮🇩Indonesia10.38%1.8K
🇧🇷Brazil8.81%1.5K

Suchbegriffe

graphs in excel powerpointhow to recreate a chart in powerpoint when the source file movedimbedding a workable excel spreadheet in power pointrollstacktableau conference 2026

Ultimaps monthly traffic:

Latest traffic

Monatliche Besuche
135.3K
Ø Besuchsdauer
0:33
Seiten pro Besuch
1.85
Absprungrate
46.61%
Data updated 2026-06-15

Monthly traffic trend

  • 2025/9: 39.7K Monatliche Besuche
  • 2026/1: 84.4K Monatliche Besuche
  • 2026/2: 71.2K Monatliche Besuche
  • 2026/3: 100.1K Monatliche Besuche
  • 2026/4: 106.4K Monatliche Besuche
  • 2026/5: 135.3K Monatliche Besuche

Top-Regionen

Top 5 countries/regions
Country/regionPercentageTraffic
🇺🇸United States65.94%89.2K
🇮🇳India20.2%27.3K
🇬🇧United Kingdom6.58%8.9K
🇨🇦Canada3.79%5.1K
🇳🇬Nigeria3.49%4.7K

Traffic-Quellen

Source typePercentageTraffic
Direkt77.81%105.2K
Verweis20.72%28K
E-Mail1.47%2K

Suchbegriffe

asia mapblank map of the united statesmap of eurasiaultimapswhat county am i in
Traffic-based selection guidance: If public market visibility is an important first-pass criterion, investigate Ultimaps first. The final choice should still follow taxonomy, use case, and a real trial because higher traffic does not prove broader capabilities or better workflow fit.

Usage comparison

Compare the core capabilities of Rollstack and Ultimaps

Rollstack Core features

Business Intelligence
Präsentationen
Automatisierung
Berichte

Ultimaps Core features

Business Intelligence
Präsentationen
Analysen

Use cases

Rollstack Use cases

Datenvisualisierung
Automatisierte Berichte
Business Intelligence
Datenberichterstattung
Google Präsentationen
Looker
Power BI
PowerPoint-Automatisierung
Präsentationsautomatisierung
QBR
Schneeflocke
Tableau

Ultimaps Use cases

Datenvisualisierung
KI-Karte
Diagramm-Ersteller
Choroplethenkarte
Datenmapping
Geografische Visualisierung
interaktive Karte
Kartengenerator
Vertriebsgebietskarte

Rollstack vs Ultimaps:In-depth comparison and selection guidance

First decide whether the products solve the same kind of need

This in-depth Rollstack vs Ultimaps comparison uses only the product records, taxonomy, audience, traffic, and community signals available on this page. Rollstack is primarily listed under “Business Intelligence”, while Ultimaps is primarily listed under “Business Intelligence”, so the first decision is whether your actual task matches their recorded scope.

The structured fields currently show these decision-relevant differences: Pricing (Rollstack: Paid; Ultimaps: Freemium); Monthly visits (Rollstack: 17.4K; Ultimaps: 135.3K); Monthly growth (Rollstack: -7.9%; Ultimaps: 27.1%); Favorites (Rollstack: 116; Ultimaps: 102); Website (Rollstack: www.rollstack.com; Ultimaps: ultimaps.com). These facts are more useful for selection than brand visibility alone.

What market visibility and monthly traffic mean

In the Rollstack vs Ultimaps monthly traffic comparison, Rollstack currently shows 17.4K visits and Ultimaps shows 135.3K; Ultimaps has about 7.8 times the visible traffic of Rollstack, an absolute difference of about 117.8K visits. This reflects visible reach, not feature quality or paid users.

Both tools provide verified traffic details, so monthly trends, visit depth, regions, and acquisition sources can be compared on the same basis.

If public market visibility is an important first-pass criterion, investigate Ultimaps first. The final choice should still follow taxonomy, use case, and a real trial because higher traffic does not prove broader capabilities or better workflow fit.

Product positioning, use cases, and roles

Rollstack and Ultimaps currently overlap in shared categories: Business Intelligence und Präsentationen; shared tags: Datenvisualisierung. This can place both on the same shortlist, but it does not prove equal implementation, depth, or cost.

Rollstack's unique categories/tags are Automatisierung, Berichte, Automatisierte Berichte, Business Intelligence, Datenberichterstattung, Google Präsentationen, Looker und Power BI; Ultimaps's are Analysen, KI-Karte, Diagramm-Ersteller, Choroplethenkarte, Datenmapping, Geografische Visualisierung, interaktive Karte und Kartengenerator. These unique fields are the strongest differentiators: validate the product whose recorded scope matches the task instead of following traffic alone.

What ratings, comments, and favorites can tell you

Rollstack has no verified rating, 0 comments, 116 favorites, and 121 likes;Ultimaps has no verified rating, 0 comments, 102 favorites, and 118 likes。

Neither product has enough rating or comment samples for a credible reputation ranking.

Selection guidance by actual need

When to evaluate Rollstack first

Put Rollstack on the priority trial list when the task aligns with “Business Intelligence” and especially Automatisierung, Berichte, Automatisierte Berichte, Business Intelligence, Datenberichterstattung und Google Präsentationen. This follows recorded positioning and does not imply unlisted capabilities are absent.

Rollstack also currently records: pricing is paid, product type is website, 17.4K verified monthly visits, no verified user rating. Verify any hard requirement around price, platform, or reach before trial, and do not let sparse review data substitute for testing.

When to evaluate Ultimaps first

Put Ultimaps on the priority trial list when the task aligns with “Business Intelligence” and especially Analysen, KI-Karte, Diagramm-Ersteller, Choroplethenkarte, Datenmapping und Geografische Visualisierung. This follows recorded positioning and does not imply unlisted capabilities are absent.

Ultimaps also currently records: pricing is freemium, product type is website, 135.3K verified monthly visits, no verified user rating. Verify any hard requirement around price, platform, or reach before trial, and do not let sparse review data substitute for testing.

How to validate the recommendation before deciding

The available data describes positioning, public visibility, and community signals, but it cannot prove output quality, speed, integration effort, privacy, or long-term cost in your workflow. Before deciding, run the same representative tasks in Rollstack and Ultimaps, then record completion time, accuracy, manual corrections, and the real paid threshold. A like-for-like trial turns this comparison into a defensible adoption decision.

Vergleichs-FAQ

How should I choose between Rollstack and Ultimaps?
Compare positioning, pricing, taxonomy, and traffic maturity, then verify the latest details on each official website.
Where does this comparison data come from?
The factual baseline is derived from product, taxonomy, traffic, and community data. Reviewed editorial conclusions show their source and verification date.
What do unknown fields mean?
Unknown means there is not enough reliable evidence; the page does not fill gaps with assumptions.