BetterBugs
デバッグ · 835K 月間訪問数
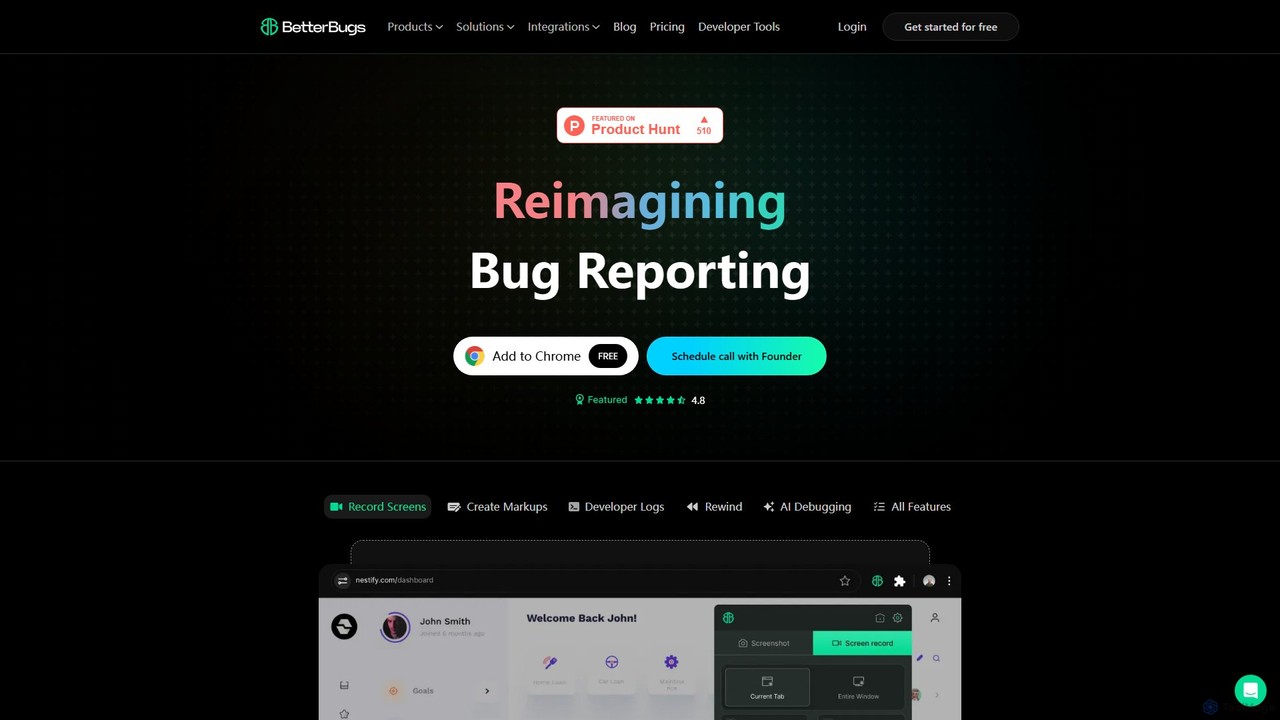
BetterBugsは、開発チームとQAチームがワンクリックで正確かつコンテキスト豊富なバグレポートをキャプチャするのに役立つAI搭載のバグ報告ツールです。画面録画、注釈、包括的な開発者ログ(コンソールログ、ネットワークリクエスト)を自動的に含めることで、デバッグプロセスを合理化し、バグ解決を加速します。
BetterBugsは、開発チームとQAチームがワンクリックで正確かつコンテキスト豊富なバグレポートをキャプチャするのに役立つAI搭載のバグ報告ツールです。画面録画、注釈、包括的な開発者ログ(コンソールログ、ネットワークリクエスト)を自動的に含めることで、デバッグプロセスを合理化し、バグ解決を加速します。
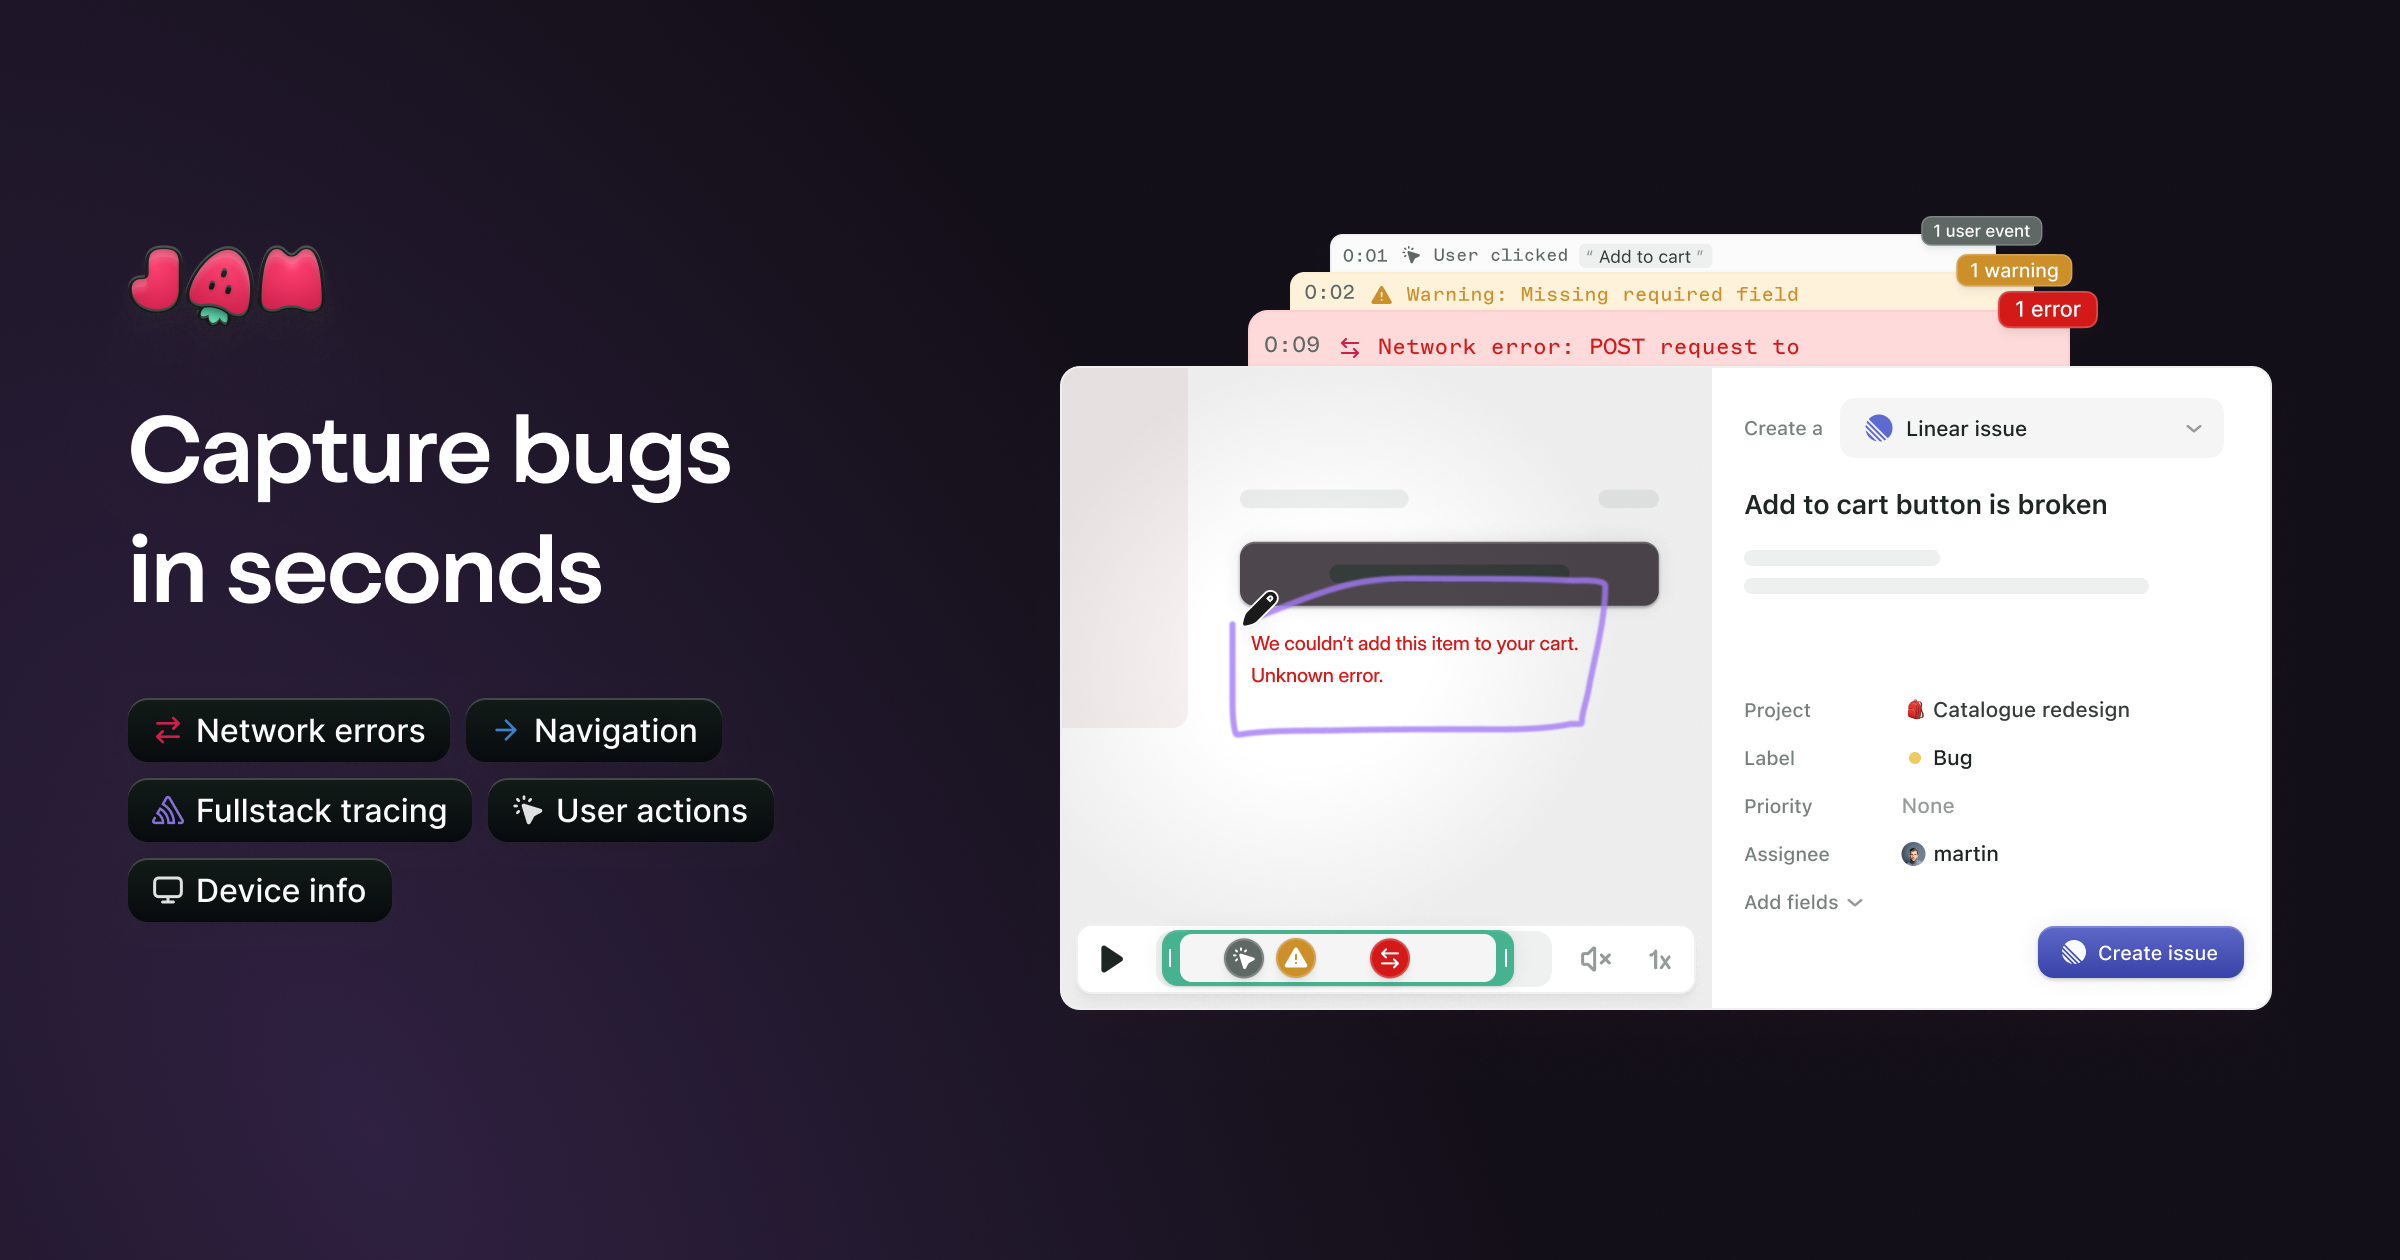
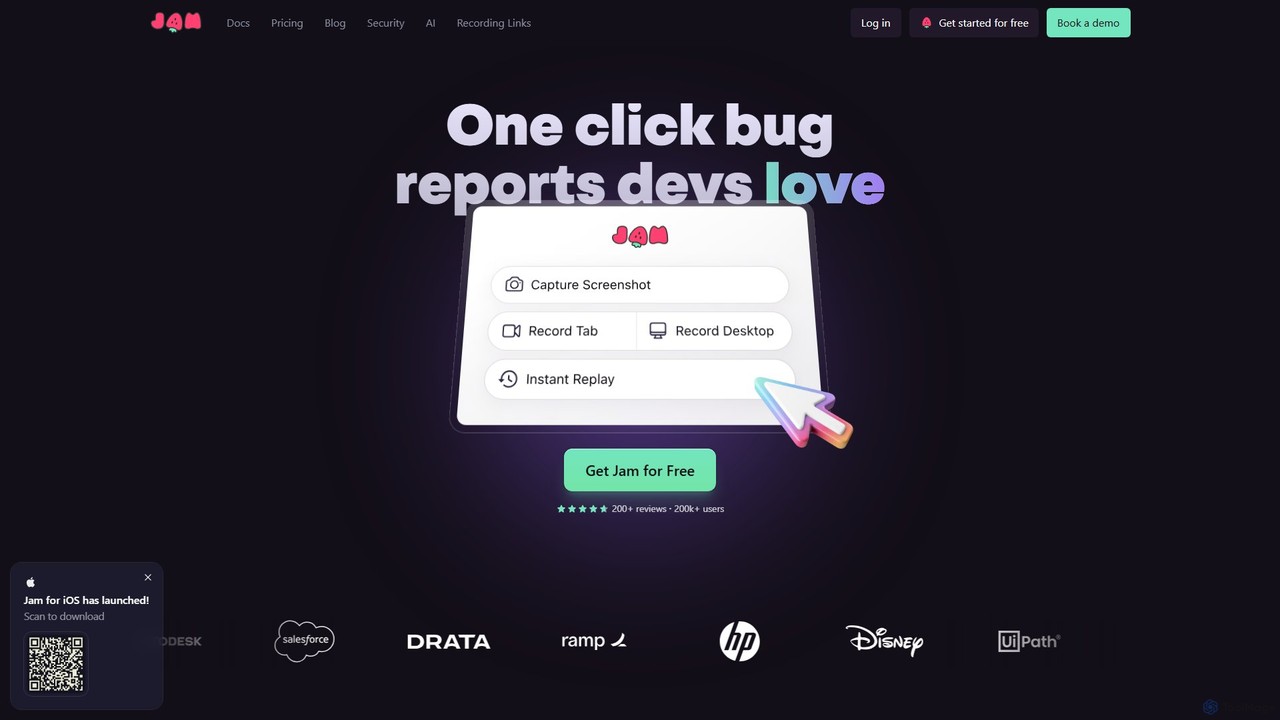
Jamは、開発チームがバグをより迅速に修正するのを支援するAI搭載のバグレポートツールです。コンソールログ、ネットワークリクエスト、ブラウザ情報、再現手順など、エンジニアが必要とするすべての技術データを単一のリンクに自動的にキャプチャします。インスタントリプレイ、AIによるデバッグ、シームレスな統合といった機能により、Jamは開発者、QA、プロダクトチームのためのバグレポートと解決プロセス全体を効率化します。
BetterBugsは、開発チームとQAチームがワンクリックで正確かつコンテキスト豊富なバグレポートをキャプチャするのに役立つAI搭載のバグ報告ツールです。画面録画、注釈、包括的な開発者ログ(コンソールログ、ネットワークリクエスト)を自動的に含めることで、デバッグプロセスを合理化し、バグ解決を加速します。
Jamは、開発チームがバグをより迅速に修正するのを支援するAI搭載のバグレポートツールです。コンソールログ、ネットワークリクエスト、ブラウザ情報、再現手順など、エンジニアが必要とするすべての技術データを単一のリンクに自動的にキャプチャします。インスタントリプレイ、AIによるデバッグ、シームレスな統合といった機能により、Jamは開発者、QA、プロダクトチームのためのバグレポートと解決プロセス全体を効率化します。
Compare BetterBugs and Jam by monthly reach, traffic trend, visit depth, top regions, and acquisition sources.
In the BetterBugs vs Jam monthly traffic comparison, BetterBugs currently shows 835K visits and Jam shows 729.7K; BetterBugs has about 1.1 times the visible traffic of Jam, an absolute difference of about 105.4K visits. This reflects visible reach, not feature quality or paid users.
Both tools provide verified traffic details, so monthly trends, visit depth, regions, and acquisition sources can be compared on the same basis.
| Country/region | Percentage | Traffic |
|---|---|---|
| 🇮🇳India | 37.62% | 314.1K |
| 🇺🇸United States | 22.78% | 190.2K |
| 🇵🇰Pakistan | 18.17% | 151.7K |
| 🇪🇬Egypt | 11.05% | 92.3K |
| 🇹🇷Turkey | 10.38% | 86.7K |
| Source type | Percentage | Traffic |
|---|---|---|
| ダイレクト | 85.46% | 713.6K |
| 参照元 | 12.92% | 107.9K |
| Eメール | 1.62% | 13.5K |
| Country/region | Percentage | Traffic |
|---|---|---|
| 🇺🇸United States | 34.32% | 250.4K |
| 🇮🇳India | 24.86% | 181.4K |
| 🇺🇿Uzbekistan | 16.57% | 120.9K |
| 🇮🇩Indonesia | 13.43% | 98K |
| 🇵🇭Philippines | 10.82% | 78.9K |
| Source type | Percentage | Traffic |
|---|---|---|
| ダイレクト | 88.57% | 646.3K |
| 参照元 | 9.61% | 70.1K |
| Eメール | 1.82% | 13.3K |
This in-depth BetterBugs vs Jam comparison uses only the product records, taxonomy, audience, traffic, and community signals available on this page. BetterBugs is primarily listed under “デバッグ”, while Jam is primarily listed under “デバッグ”, so the first decision is whether your actual task matches their recorded scope.
The structured fields currently show these decision-relevant differences: Primary category (BetterBugs: デバッグ; Jam: デバッグ); Product type (BetterBugs: Browser extension; Jam: Website); Pricing (BetterBugs: Free; Jam: Freemium); Monthly visits (BetterBugs: 835K; Jam: 729.7K); Monthly growth (BetterBugs: 34.3%; Jam: -10.7%). These facts are more useful for selection than brand visibility alone.
In the BetterBugs vs Jam monthly traffic comparison, BetterBugs currently shows 835K visits and Jam shows 729.7K; BetterBugs has about 1.1 times the visible traffic of Jam, an absolute difference of about 105.4K visits. This reflects visible reach, not feature quality or paid users.
Both tools provide verified traffic details, so monthly trends, visit depth, regions, and acquisition sources can be compared on the same basis.
The current traffic scope is not sufficient for a reliable product ranking. Treat monthly visits as a market-interest signal, then decide using taxonomy, use cases, pricing, and a like-for-like trial rather than reading exposure as product capability.
BetterBugs and Jam currently overlap in shared categories: バグ追跡、コラボレーション; shared tags: バグ報告、デバッグ、課題追跡、QAテスト、画面録画、ソフトウェア開発. This can place both on the same shortlist, but it does not prove equal implementation, depth, or cost.
BetterBugs's unique categories/tags are デバッグ、AIデバッグ、Chrome拡張機能、開発者ツール; Jam's are デバッグ、フィードバック収集、AIデバッガー、コラボレーション、開発者ツール、セッションリプレイ. These unique fields are the strongest differentiators: validate the product whose recorded scope matches the task instead of following traffic alone.
BetterBugs has no verified rating, 0 comments, 132 favorites, and 135 likes;Jam has no verified rating, 0 comments, 112 favorites, and 114 likes。
Neither product has enough rating or comment samples for a credible reputation ranking.
Put BetterBugs on the priority trial list when the task aligns with “デバッグ” and especially デバッグ、AIデバッグ、Chrome拡張機能、開発者ツール. This follows recorded positioning and does not imply unlisted capabilities are absent.
BetterBugs also currently records: pricing is free, product type is browser extension, 835K verified monthly visits, no verified user rating. Verify any hard requirement around price, platform, or reach before trial, and do not let sparse review data substitute for testing.
Put Jam on the priority trial list when the task aligns with “デバッグ” and especially デバッグ、フィードバック収集、AIデバッガー、コラボレーション、開発者ツール、セッションリプレイ. This follows recorded positioning and does not imply unlisted capabilities are absent.
Jam also currently records: pricing is freemium, product type is website, 729.7K verified monthly visits, no verified user rating. Verify any hard requirement around price, platform, or reach before trial, and do not let sparse review data substitute for testing.
The available data describes positioning, public visibility, and community signals, but it cannot prove output quality, speed, integration effort, privacy, or long-term cost in your workflow. Before deciding, run the same representative tasks in BetterBugs and Jam, then record completion time, accuracy, manual corrections, and the real paid threshold. A like-for-like trial turns this comparison into a defensible adoption decision.
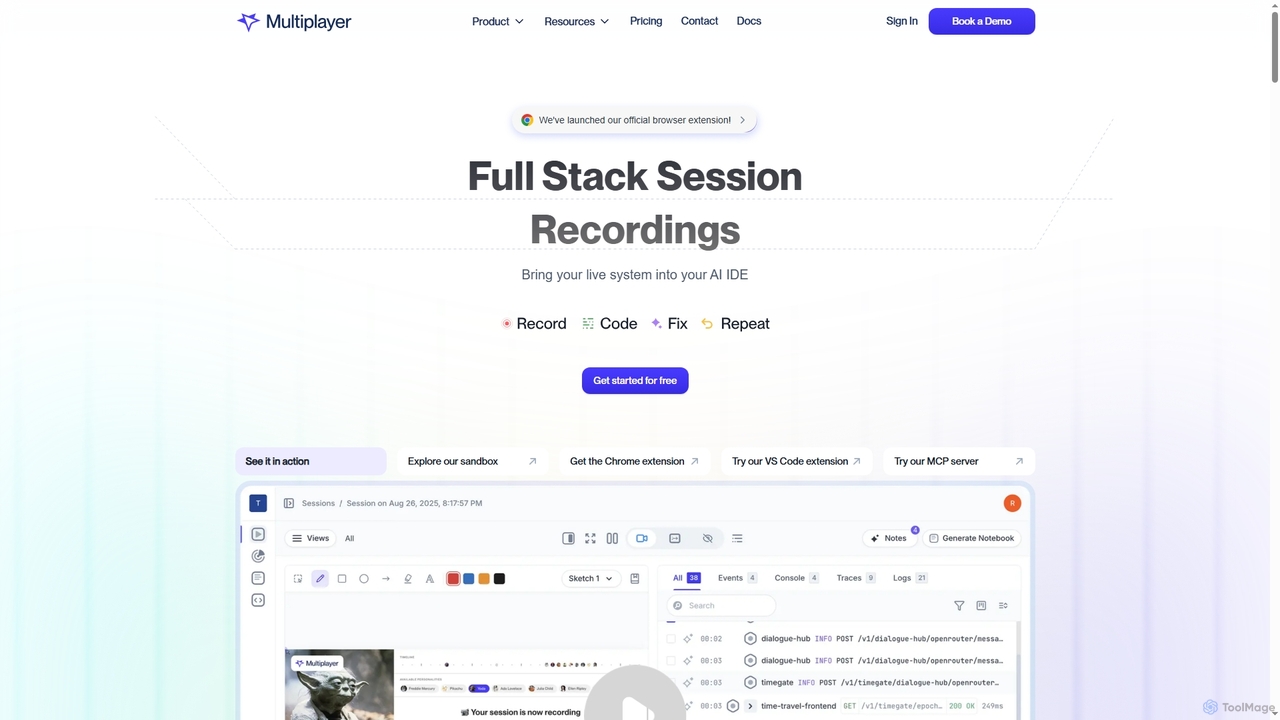
Multiplayerは、フロントエンドとバックエンドのデータをキャプチャし、デバッグ、テスト、AIを活用した機能開発のための完全なコンテキストを提供するフルスタックセッション記録プラットフォームです。AI IDEやエンジニアリングワークフローとシームレスに統合し、問題解決を加速し、自信を持って新機能を構築します。
AI統合

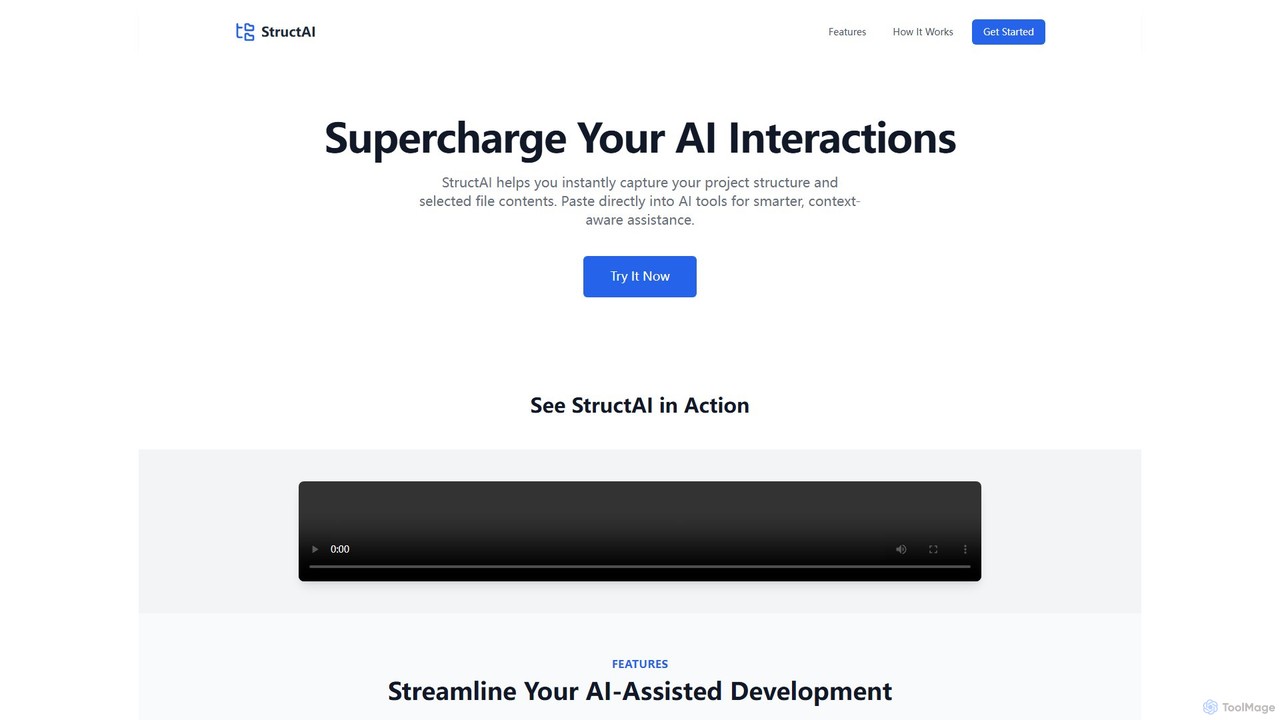
StructAIは、プロジェクトのフォルダ構造と選択したファイルの内容を即座にキャプチャする開発者向けツールです。コンテキストが豊富なAI対応の出力を生成し、ChatGPTやClaudeなどのAIアシスタントに貼り付けることで、よりスマートで正確なコード生成、デバッグ、分析が可能になります。
プロンプトエンジニアリング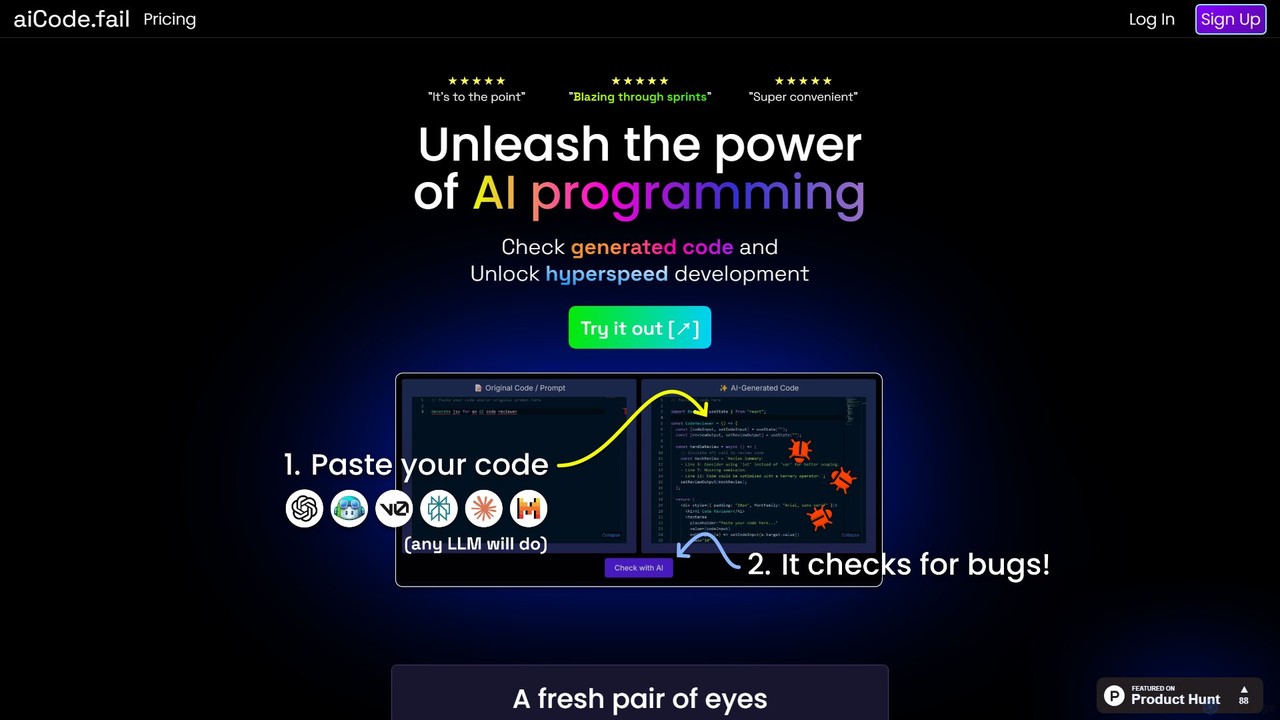
aiCode.failは、GPTなどのLLMによって生成されたコードを監査、デバッグ、保護するために設計された、専門的なAI搭載コードチェッカーです。コードの幻覚を検出し、セキュリティの脆弱性を明らかにし、あらゆるプログラミング言語の開発プロセスを加速させ、より高いコード品質と信頼性を確保するための重要な「第二の目」として機能します。
コードアシスタント

jetcode.appは、ソフトウェア開発を加速させるために設計されたAI搭載のコーディングアシスタントです。開発者のIDE内で直接、インテリジェントなコード生成、リアルタイム補完、強力なリファクタリングツールを提供し、より迅速なコード記述、デバッグ、最適化を支援します。
コードアシスタント