Breadcrumbs
予測分析 · 7.3K 月間訪問数
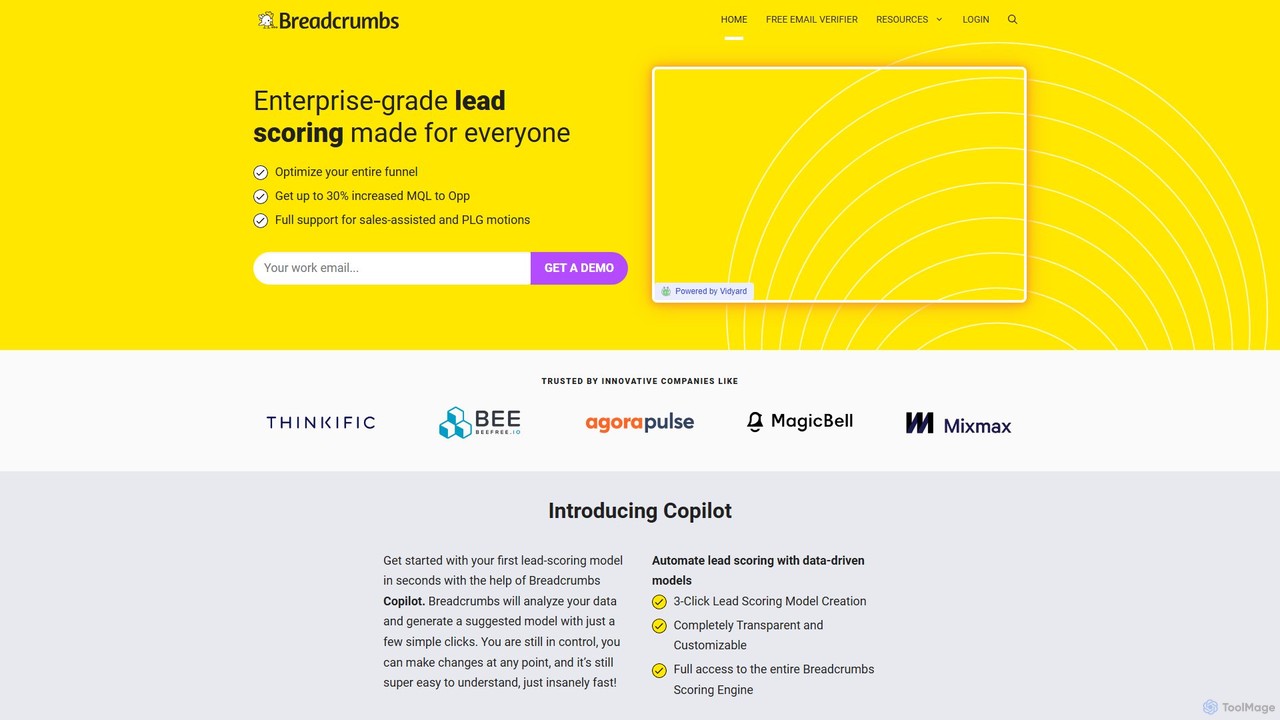
Breadcrumbsは、エンタープライズレベルのリードスコアリングを提供するAI搭載の収益加速プラットフォームです。技術スタック全体に接続して顧客データを分析し、高価値なリードの特定、顧客行動の予測、そして客観的なデータ駆動型のインサイトに基づいた営業とマーケティングチームの連携を支援し、あらゆるGTM戦略に対応します。
Breadcrumbsは、エンタープライズレベルのリードスコアリングを提供するAI搭載の収益加速プラットフォームです。技術スタック全体に接続して顧客データを分析し、高価値なリードの特定、顧客行動の予測、そして客観的なデータ駆動型のインサイトに基づいた営業とマーケティングチームの連携を支援し、あらゆるGTM戦略に対応します。
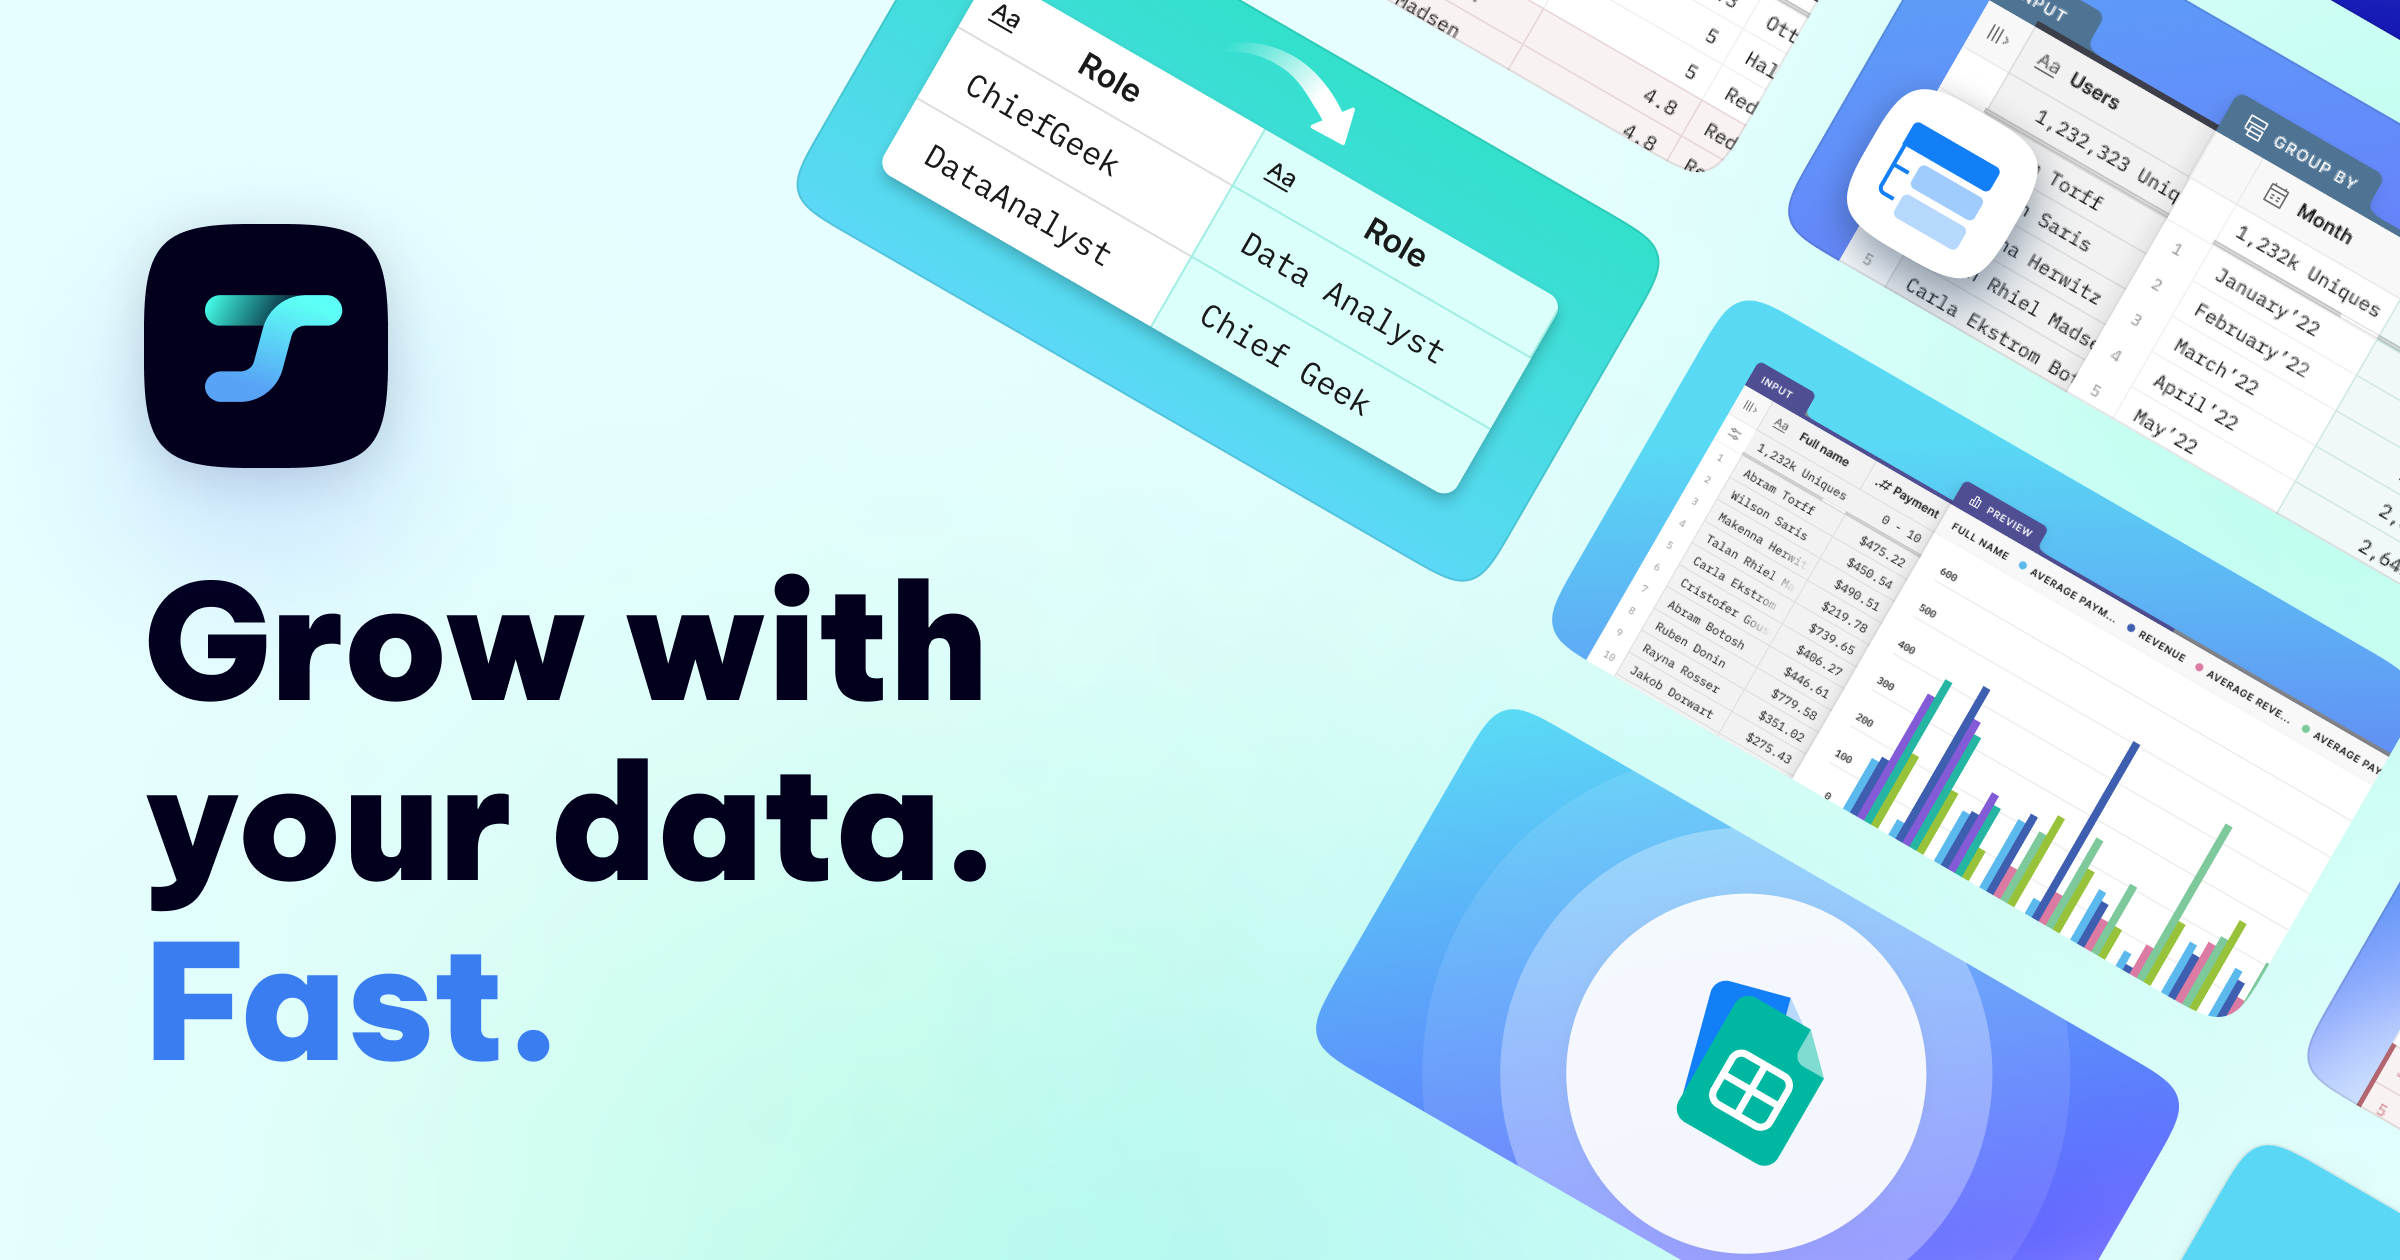
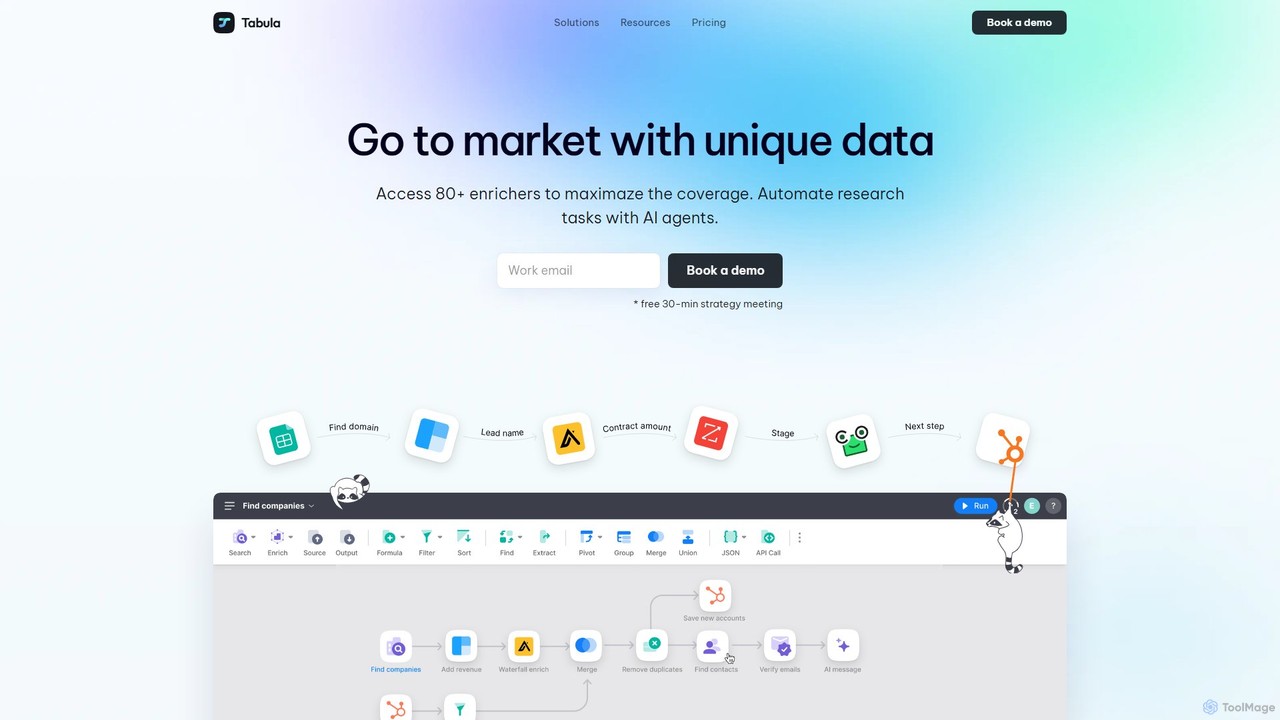
Tabulaは、ターゲットを絞ったリードリストの構築、80以上のプロバイダーからのデータエンリッチメント、複雑なワークフローの作成を行うための強力なGo-To-Market(GTM)自動化プラットフォームです。営業、マーケティング、RevOpsチームに比類のない柔軟性、制御、スケーラビリティを提供し、独自の「Bring Your Own API Key」モデルと堅牢な無料プランを特徴としています。
Breadcrumbsは、エンタープライズレベルのリードスコアリングを提供するAI搭載の収益加速プラットフォームです。技術スタック全体に接続して顧客データを分析し、高価値なリードの特定、顧客行動の予測、そして客観的なデータ駆動型のインサイトに基づいた営業とマーケティングチームの連携を支援し、あらゆるGTM戦略に対応します。
Tabulaは、ターゲットを絞ったリードリストの構築、80以上のプロバイダーからのデータエンリッチメント、複雑なワークフローの作成を行うための強力なGo-To-Market(GTM)自動化プラットフォームです。営業、マーケティング、RevOpsチームに比類のない柔軟性、制御、スケーラビリティを提供し、独自の「Bring Your Own API Key」モデルと堅牢な無料プランを特徴としています。
| Feature | Breadcrumbs | Tabula |
|---|---|---|
| 主要カテゴリー | 予測分析 | データエンリッチメント |
| 追加日 | 2025-08-14 | 2025-08-02 |
| 価格 | フリーミアム | フリーミアム |
| 公式サイト | breadcrumbs.io | www.tabula.io |
| 製品タイプ | ウェブサイト | アプリ |
| Performance data | ||
| ユーザー評価 | 未確認 | 未確認 |
| コメント | 0 | 0 |
| 月間訪問数 | 7.3K | 7.5K |
| 月間成長率 | 23.9% | -39.4% |
| お気に入り | 131 | 128 |
| Details | 詳細を見る | 詳細を見る |
Compare Breadcrumbs and Tabula by monthly reach, traffic trend, visit depth, top regions, and acquisition sources.
In the Breadcrumbs vs Tabula monthly traffic comparison, Breadcrumbs currently shows 7.3K visits and Tabula shows 7.5K; the two products have similar visible traffic, an absolute difference of about 264 visits. This reflects visible reach, not feature quality or paid users.
Both tools provide verified traffic details, so monthly trends, visit depth, regions, and acquisition sources can be compared on the same basis.
| Country/region | Percentage | Traffic |
|---|---|---|
| 🇳🇬Nigeria | 32.5% | 2.4K |
| 🇺🇸United States | 29.53% | 2.2K |
| 🇮🇳India | 13.98% | 1K |
| 🇨🇦Canada | 12.35% | 899 |
| 🇵🇭Philippines | 11.64% | 848 |
| Country/region | Percentage | Traffic |
|---|---|---|
| 🇺🇸United States | 39.25% | 3K |
| 🇮🇳India | 30.33% | 2.3K |
| 🇬🇧United Kingdom | 12.97% | 979 |
| 🇩🇪Germany | 12.37% | 933 |
| 🇪🇬Egypt | 5.08% | 383 |
This in-depth Breadcrumbs vs Tabula comparison uses only the product records, taxonomy, audience, traffic, and community signals available on this page. Breadcrumbs is primarily listed under “予測分析”, while Tabula is primarily listed under “データエンリッチメント”, so the first decision is whether your actual task matches their recorded scope.
The structured fields currently show these decision-relevant differences: Primary category (Breadcrumbs: 予測分析; Tabula: データエンリッチメント); Product type (Breadcrumbs: Website; Tabula: App); Monthly visits (Breadcrumbs: 7.3K; Tabula: 7.5K); Monthly growth (Breadcrumbs: 23.9%; Tabula: -39.4%); Favorites (Breadcrumbs: 131; Tabula: 128). These facts are more useful for selection than brand visibility alone.
In the Breadcrumbs vs Tabula monthly traffic comparison, Breadcrumbs currently shows 7.3K visits and Tabula shows 7.5K; the two products have similar visible traffic, an absolute difference of about 264 visits. This reflects visible reach, not feature quality or paid users.
Both tools provide verified traffic details, so monthly trends, visit depth, regions, and acquisition sources can be compared on the same basis.
The current traffic scope is not sufficient for a reliable product ranking. Treat monthly visits as a market-interest signal, then decide using taxonomy, use cases, pricing, and a like-for-like trial rather than reading exposure as product capability.
Breadcrumbs and Tabula currently overlap in shared categories: マーケティングオートメーション; shared tags: データ統合、マーケティングオートメーション、レブオプス、営業自動化. This can place both on the same shortlist, but it does not prove equal implementation, depth, or cost.
Breadcrumbs's unique categories/tags are 予測分析、データ分析、リードスコアリング、B2B、CRM、PLG、プロダクト主導型成長、収益加速; Tabula's are データエンリッチメント、ワークフロー自動化、リードジェネレーション、B2B営業、データクレンジング、GTM、リード生成、リード獲得. These unique fields are the strongest differentiators: validate the product whose recorded scope matches the task instead of following traffic alone.
Breadcrumbs has no verified rating, 0 comments, 131 favorites, and 119 likes;Tabula has no verified rating, 0 comments, 128 favorites, and 120 likes。
Neither product has enough rating or comment samples for a credible reputation ranking.
Put Breadcrumbs on the priority trial list when the task aligns with “予測分析” and especially 予測分析、データ分析、リードスコアリング、B2B、CRM、PLG. This follows recorded positioning and does not imply unlisted capabilities are absent.
Breadcrumbs also currently records: pricing is freemium, product type is website, 7.3K verified monthly visits, no verified user rating. Verify any hard requirement around price, platform, or reach before trial, and do not let sparse review data substitute for testing.
Put Tabula on the priority trial list when the task aligns with “データエンリッチメント” and especially データエンリッチメント、ワークフロー自動化、リードジェネレーション、B2B営業、データクレンジング、GTM. This follows recorded positioning and does not imply unlisted capabilities are absent.
Tabula also currently records: pricing is freemium, product type is app, 7.5K verified monthly visits, no verified user rating. Verify any hard requirement around price, platform, or reach before trial, and do not let sparse review data substitute for testing.
The available data describes positioning, public visibility, and community signals, but it cannot prove output quality, speed, integration effort, privacy, or long-term cost in your workflow. Before deciding, run the same representative tasks in Breadcrumbs and Tabula, then record completion time, accuracy, manual corrections, and the real paid threshold. A like-for-like trial turns this comparison into a defensible adoption decision.
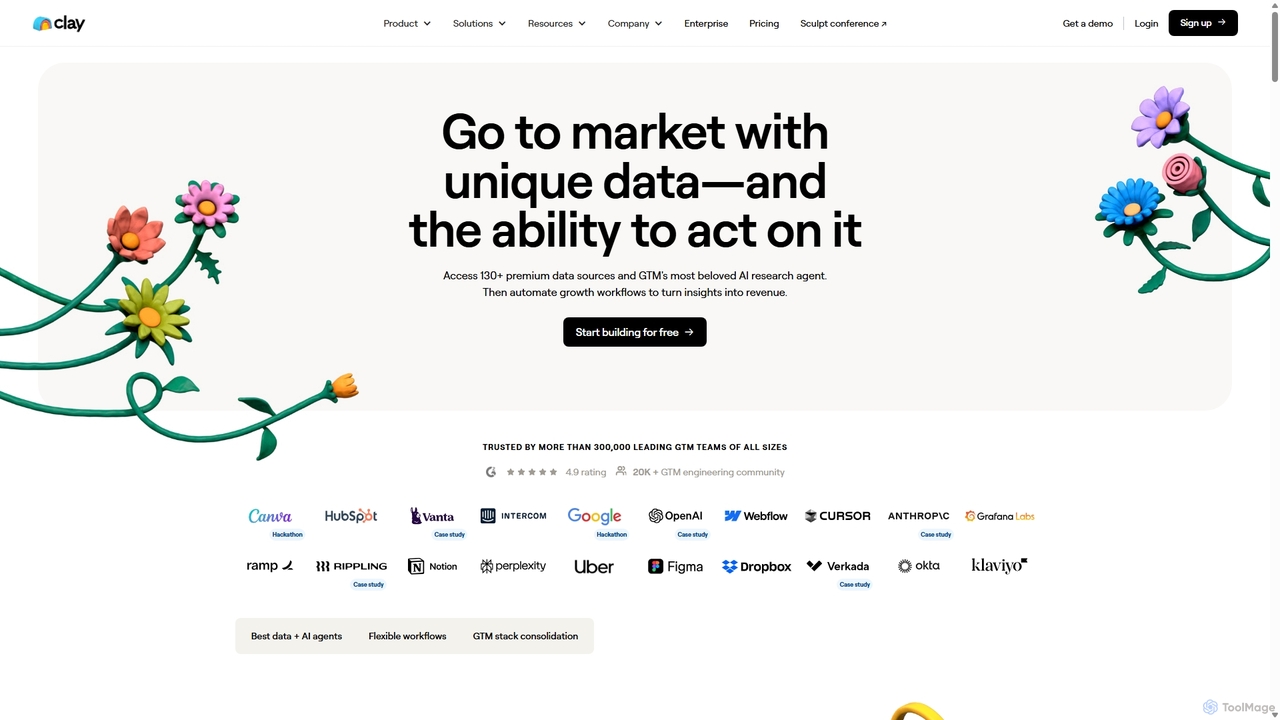
Clayは、130以上のデータソースと高度なAIリサーチエージェントを組み合わせた強力なGo-To-Market(GTM)自動化プラットフォームです。営業、マーケティング、オペレーションチームが独自のデータを発見し、手作業のリサーチを自動化し、洗練されたワークフローを構築してインサイトを収益に変え、アウトバウンドとデータエンリッチメントのプロセス全体を合理化することを可能にします。
データエンリッチメント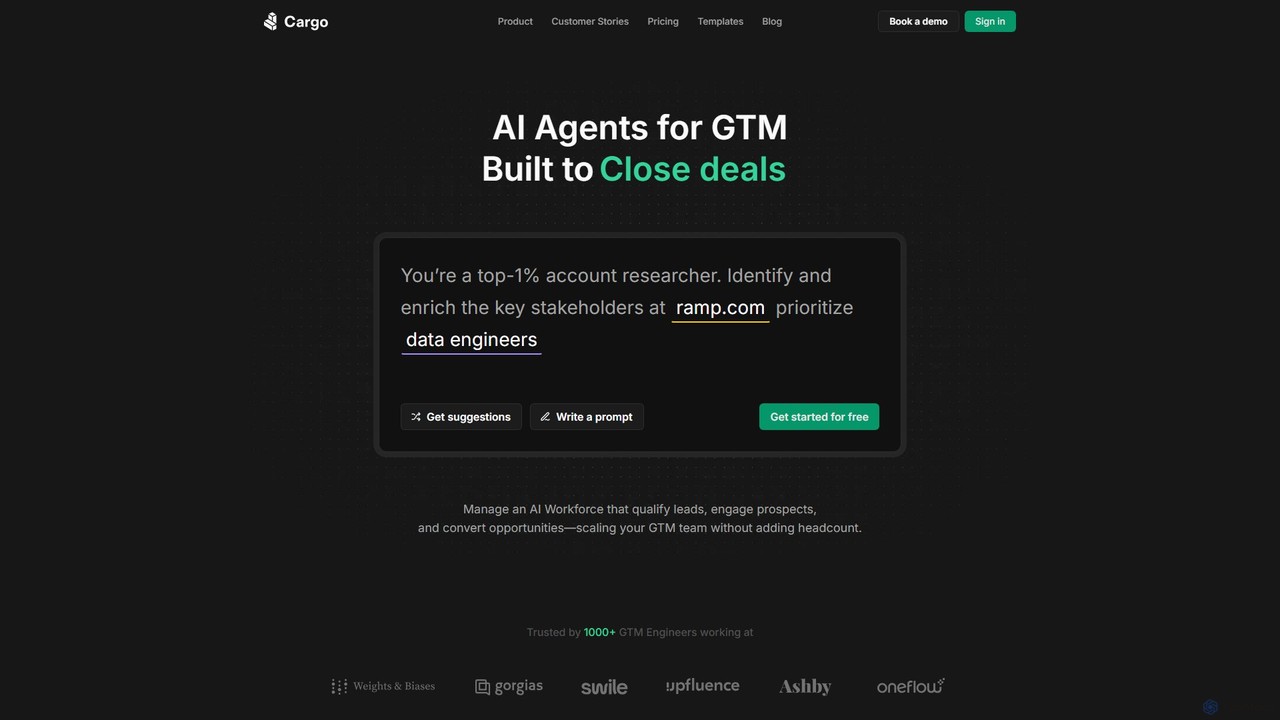
getcargoは、GTM(Go-to-Market)チームがカスタムAIエージェントを構築・展開できるようにするAI収益オーケストレーションプラットフォームです。リードの調査、認定、エンゲージメントを自動化し、人員を増やすことなくGTMオペレーションを拡大します。既存のスタックとシームレスに統合し、データを収益に変えます。
データエンリッチメント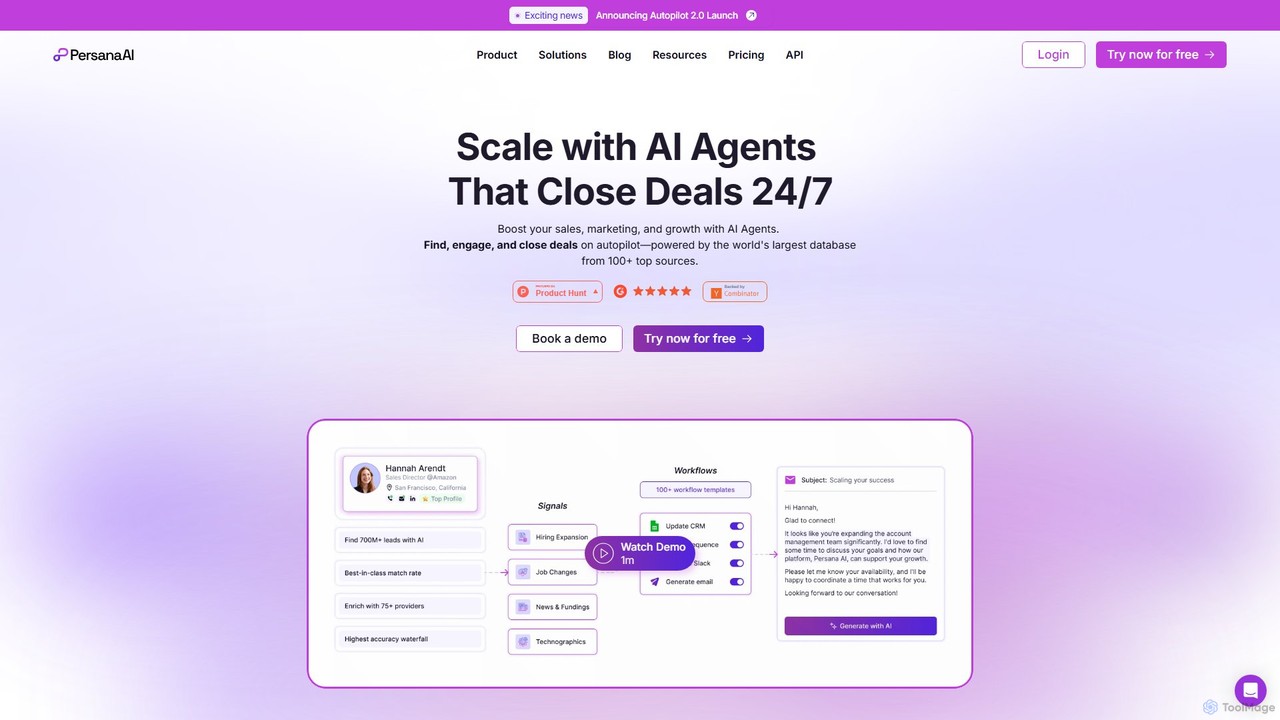
Persana AIは、AIを活用して営業プロスペクティング、データエンリッチメント、パーソナライズされたアウトリーチを自動化するオールインワンのGo-To-Market(GTM)プラットフォームです。75以上のソースからのデータを統合し、リアルタイムの購買シグナルを追跡し、AIエージェントを導入して24時間365日、見込み客を見つけ、エンゲージし、契約を成立させ、営業チームのパイプラインと収益の向上を支援します。
リードジェネレーション
ResonateHQは、AI搭載アプリケーションと専門サービスでCRMを強化するHubSpotダイヤモンドパートナーです。AI Studioや0CodeToolsなどのツールスイートにより、ユーザーはHubSpotワークフロー内で直接、強力なノーコード自動化を構築できます。主要なAIモデルと統合し、データの分類、レコードのエンリッチ、コンテンツの下書き、通話の文字起こしを行い、HubSpotをインテリジェントな自動化ハブに変えます。
データエンリッチメント
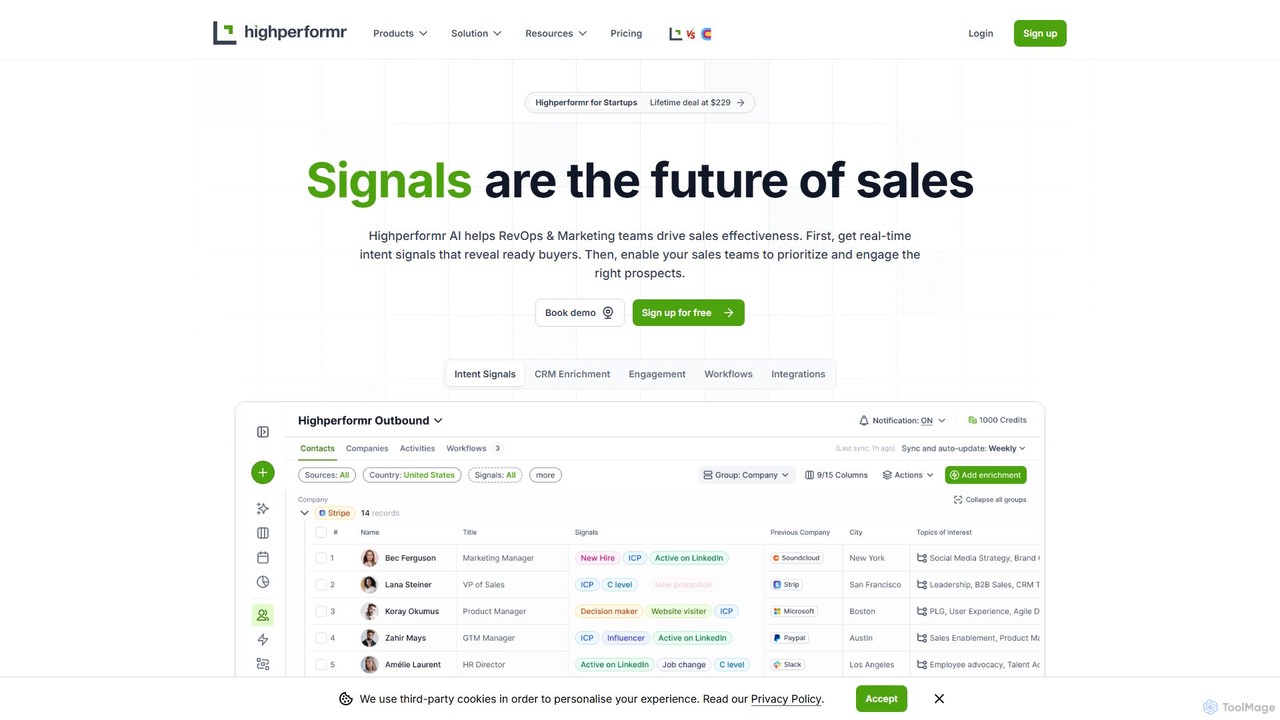
Highperformrは、AIを活用したGTMインテリジェンスプラットフォームで、B2Bの営業、マーケティング、RevOpsチームがリアルタイムのインテントシグナルを通じて購入意欲の高い見込み客を特定するのを支援します。CRMを強化し、ワークフローを自動化し、ターゲットを絞ったアプローチを可能にすることで、営業効果を高め、成長を加速させます。
CRMエンリッチメント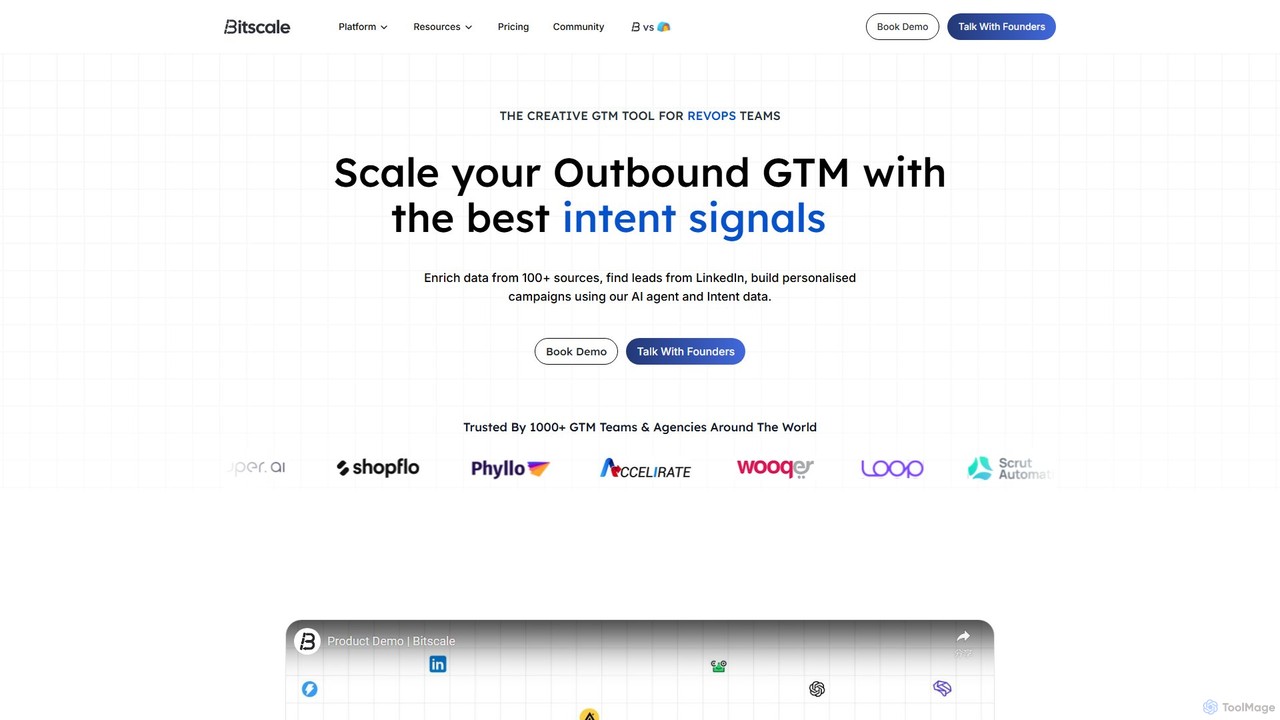
bitscaleは、RevOpsおよび営業チーム向けのAI搭載Go-To-Market(GTM)プラットフォームです。リード生成を自動化し、100以上のソースから連絡先データをエンリッチし、大規模なパーソナライズされたアウトバウンドキャンペーンを可能にします。購買意欲の高いリードを見つけ、検証済みの連絡先情報を取得し、CRMや営業ツールとシームレスに連携します。
パーソナライゼーション
Common Roomは、GTM(Go-to-Market)チーム向けに設計されたAI搭載の顧客インテリジェンスプラットフォームです。多様なソースから購入シグナルを自動的に捕捉し、Person360™エンジンで顧客データを統合し、RoomieAI™を使用してパーソナライズされたアウトリーチとパイプライン生成を自動化します。これにより、営業、マーケティング、コミュニティチームが意欲の高い見込み客や顧客を特定、理解し、エンゲージメントを深め、最終的に収益成長を加速させるのを支援します。
顧客インテリジェンス
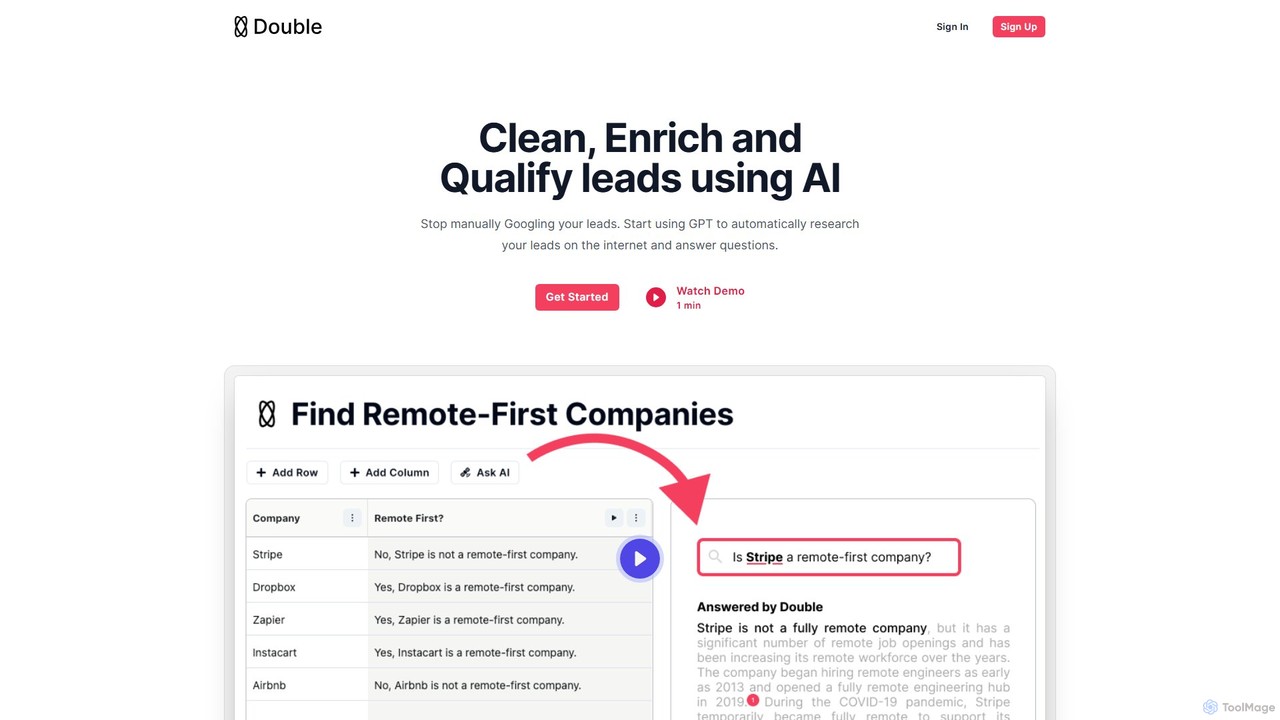
Doubleは、営業およびマーケティングチームがリードの調査、認定、エンリッチメントを自動化するためのAI搭載プラットフォームです。AIを使用してウェブを検索し、見込み客に関する特定の質問に答え、検証済みの連絡先情報を見つけ、超ターゲット化されたアウトリーチキャンペーンを可能にします。
リードエンリッチメント
getlead.aiは、営業およびマーケティングチーム向けに設計されたAI搭載プラットフォームで、リードジェネレーションを自動化します。高品質なB2Bリードの発見、認定、エンゲージメントを支援し、連絡先検索からパーソナライズされたアウトリーチキャンペーンの開始まで、見込み客開拓プロセス全体を効率化します。
メールマーケティング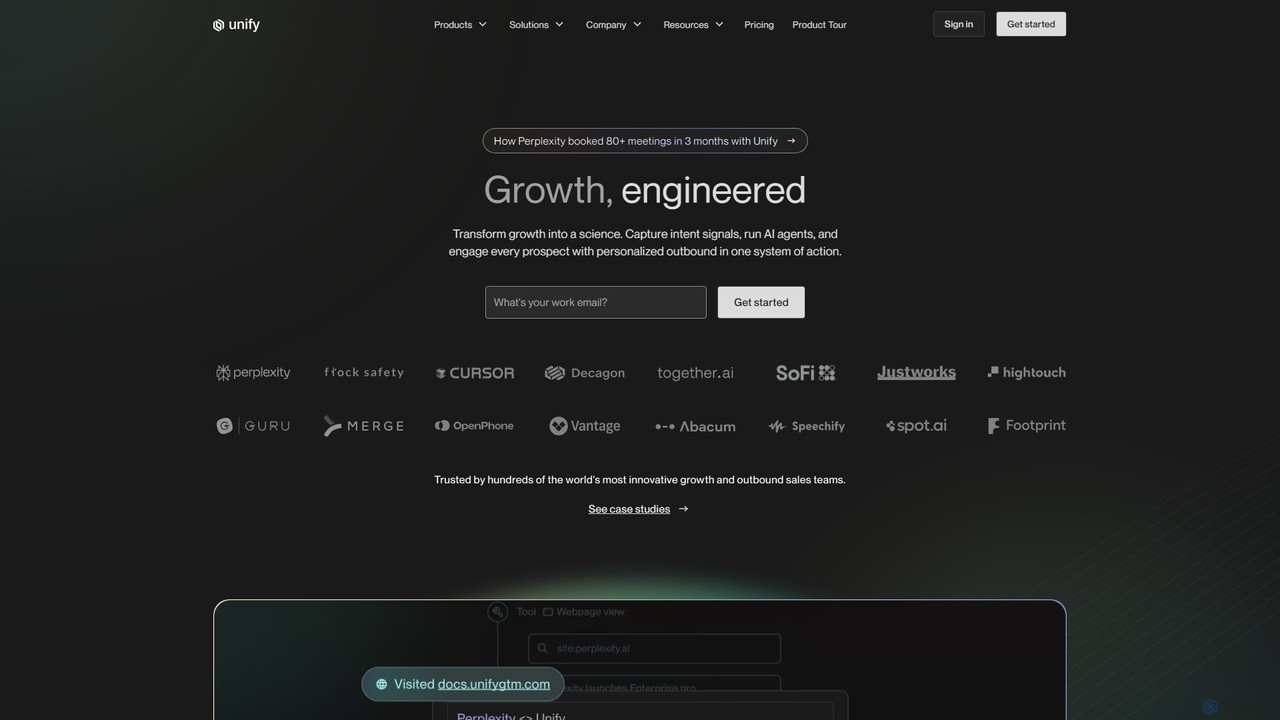
unifygtmは、成長を科学へと変えるAI搭載のGo-To-Market(GTM)プラットフォームです。インテリジェントなシグナル、自動化されたワークフロー(Plays)、AIエージェントを通じて、営業、マーケティング、RevOpsチームが購入意欲の高いバイヤーを特定し、パーソナライズされたアウトリーチを自動化し、スケーラブルな収益パイプラインを構築するのを支援します。
マーケティングオートメーション