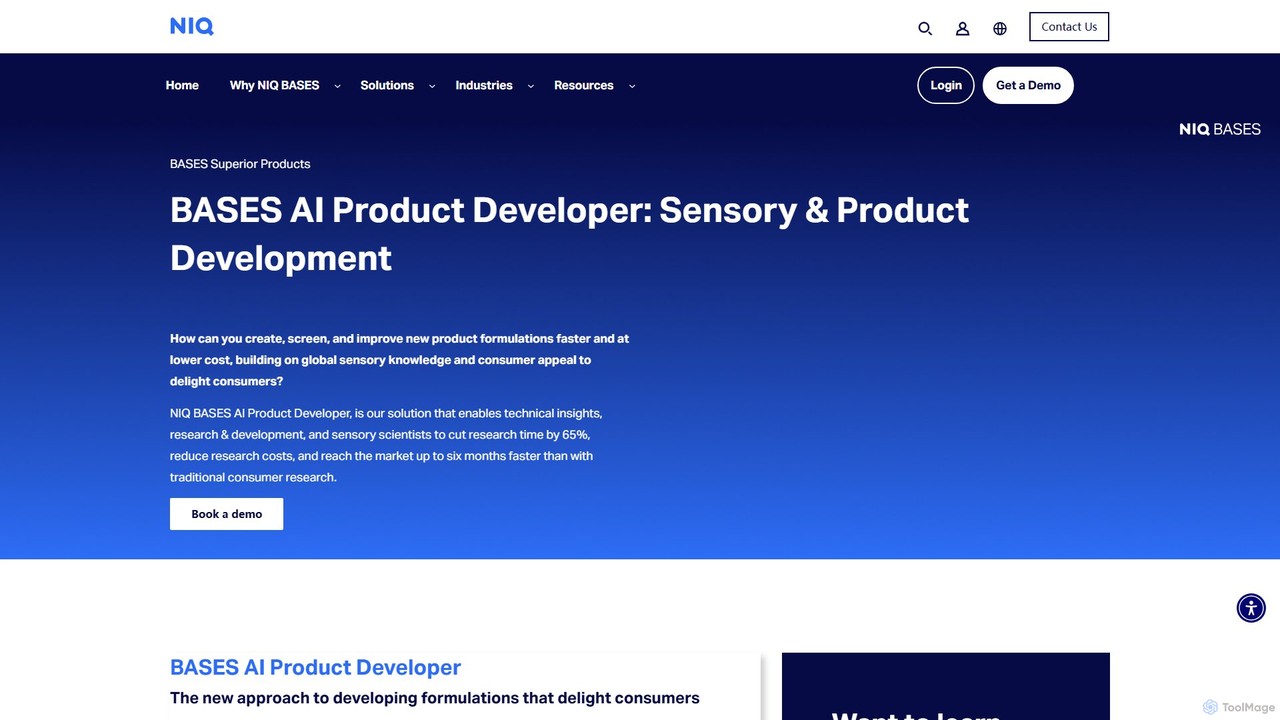
Gastrograph
市場調査 · 1M 月間訪問数
Gastrographは、食品・飲料業界向けに設計されたAI搭載プラットフォームで、現在はNIQ BASESスイートの一部です。風味、香り、食感に対する人間の感覚的知覚をモデル化し、消費者の嗜好を予測します。膨大なデータセットを分析することで、CPG企業が製品の処方を最適化し、開発時間を短縮し、ターゲット層に響く製品を発売して市場での成功を確実にするのを支援します。
Gastrographは、食品・飲料業界向けに設計されたAI搭載プラットフォームで、現在はNIQ BASESスイートの一部です。風味、香り、食感に対する人間の感覚的知覚をモデル化し、消費者の嗜好を予測します。膨大なデータセットを分析することで、CPG企業が製品の処方を最適化し、開発時間を短縮し、ターゲット層に響く製品を発売して市場での成功を確実にするのを支援します。
Glimpseは、ウェブ全体の数十億の消費者シグナルを分析し、トレンドが主流になる前に発見するのを支援するトレンドインテリジェンスプラットフォームです。絶対検索ボリューム、成長指標、予測分析を提供し、マーケター、研究者、投資家にとって強力なGoogleトレンドの代替ツールとなります。
Gastrographは、食品・飲料業界向けに設計されたAI搭載プラットフォームで、現在はNIQ BASESスイートの一部です。風味、香り、食感に対する人間の感覚的知覚をモデル化し、消費者の嗜好を予測します。膨大なデータセットを分析することで、CPG企業が製品の処方を最適化し、開発時間を短縮し、ターゲット層に響く製品を発売して市場での成功を確実にするのを支援します。
Glimpseは、ウェブ全体の数十億の消費者シグナルを分析し、トレンドが主流になる前に発見するのを支援するトレンドインテリジェンスプラットフォームです。絶対検索ボリューム、成長指標、予測分析を提供し、マーケター、研究者、投資家にとって強力なGoogleトレンドの代替ツールとなります。
| Feature | Gastrograph | Glimpse |
|---|---|---|
| 主要カテゴリー | 市場調査 | 市場調査 |
| 追加日 | 2025-08-11 | 2025-08-10 |
| 価格 | 有料 | フリーミアム |
| 公式サイト | nielseniq.com | meetglimpse.com |
| 製品タイプ | ウェブサイト | ウェブサイト |
| Performance data | ||
| ユーザー評価 | 未確認 | 未確認 |
| コメント | 0 | 0 |
| 月間訪問数 | 1M | 213.7K |
| 月間成長率 | -22.6% | 1.3% |
| お気に入り | 112 | 118 |
| Details | 詳細を見る | 詳細を見る |
Compare Gastrograph and Glimpse by monthly reach, traffic trend, visit depth, top regions, and acquisition sources.
In the Gastrograph vs Glimpse monthly traffic comparison, Gastrograph currently shows 1M visits and Glimpse shows 213.7K; Gastrograph has about 4.8 times the visible traffic of Glimpse, an absolute difference of about 817.1K visits. This reflects visible reach, not feature quality or paid users.
Both tools provide verified traffic details, so monthly trends, visit depth, regions, and acquisition sources can be compared on the same basis.
Gastrograph is registered at the nielseniq.com/global/en/solutions/bases-ai-product-developer subpage. Because the current data does not state whether other host pages are excluded, treat this as domain-level context rather than independent traffic for one product or project.
| Country/region | Percentage | Traffic |
|---|---|---|
| 🇺🇸United States | 49.48% | 510K |
| 🇬🇧United Kingdom | 15.24% | 157.1K |
| 🇩🇪Germany | 15.05% | 155.1K |
| 🇮🇳India | 12.88% | 132.8K |
| 🇨🇴Colombia | 7.35% | 75.8K |
| Source type | Percentage | Traffic |
|---|---|---|
| ダイレクト | 63.72% | 656.8K |
| 参照元 | 32.19% | 331.8K |
| Eメール | 4.09% | 42.2K |
| Country/region | Percentage | Traffic |
|---|---|---|
| 🇺🇸United States | 44.02% | 94K |
| 🇬🇧United Kingdom | 22.34% | 47.7K |
| 🇮🇳India | 12.95% | 27.7K |
| 🇳🇬Nigeria | 11.3% | 24.1K |
| 🇧🇷Brazil | 9.39% | 20.1K |
| Source type | Percentage | Traffic |
|---|---|---|
| ダイレクト | 88.62% | 189.3K |
| 参照元 | 10.3% | 22K |
| Eメール | 1.08% | 2.3K |
This in-depth Gastrograph vs Glimpse comparison uses only the product records, taxonomy, audience, traffic, and community signals available on this page. Gastrograph is primarily listed under “市場調査”, while Glimpse is primarily listed under “市場調査”, so the first decision is whether your actual task matches their recorded scope.
The structured fields currently show these decision-relevant differences: Pricing (Gastrograph: Paid; Glimpse: Freemium); Monthly visits (Gastrograph: 1M; Glimpse: 213.7K); Monthly growth (Gastrograph: -22.6%; Glimpse: 1.3%); Favorites (Gastrograph: 112; Glimpse: 118); Website (Gastrograph: nielseniq.com; Glimpse: meetglimpse.com). These facts are more useful for selection than brand visibility alone.
In the Gastrograph vs Glimpse monthly traffic comparison, Gastrograph currently shows 1M visits and Glimpse shows 213.7K; Gastrograph has about 4.8 times the visible traffic of Glimpse, an absolute difference of about 817.1K visits. This reflects visible reach, not feature quality or paid users.
Both tools provide verified traffic details, so monthly trends, visit depth, regions, and acquisition sources can be compared on the same basis.
Gastrograph is registered at the nielseniq.com/global/en/solutions/bases-ai-product-developer subpage. Because the current data does not state whether other host pages are excluded, treat this as domain-level context rather than independent traffic for one product or project.
Gastrograph is registered under a nielseniq.com subpath, so its large visible total may include the host platform. The current data does not justify choosing Gastrograph for traffic alone; shortlist by unique taxonomy and use case, then validate with the same tasks.
Gastrograph and Glimpse currently overlap in shared categories: 市場調査; shared tags: 消費者インサイト、市場調査. This can place both on the same shortlist, but it does not prove equal implementation, depth, or cost.
Gastrograph's unique categories/tags are 製品開発、消費財、フレーバープロファイリング、飲食、NIQ、予測分析、感覚分析; Glimpse's are トレンド分析、研究、キーワード調査、競合分析、Googleトレンドの代替、キーワードリサーチ、製品調査、SEOツール. These unique fields are the strongest differentiators: validate the product whose recorded scope matches the task instead of following traffic alone.
Gastrograph has no verified rating, 0 comments, 112 favorites, and 109 likes;Glimpse has no verified rating, 0 comments, 118 favorites, and 128 likes。
Neither product has enough rating or comment samples for a credible reputation ranking.
Put Gastrograph on the priority trial list when the task aligns with “市場調査” and especially 製品開発、消費財、フレーバープロファイリング、飲食、NIQ、予測分析. This follows recorded positioning and does not imply unlisted capabilities are absent.
Gastrograph also currently records: pricing is paid, product type is website, 1M monthly visits shown for the registered host (subpage scope unknown), no verified user rating. Verify any hard requirement around price, platform, or reach before trial, and do not let sparse review data substitute for testing.
Put Glimpse on the priority trial list when the task aligns with “市場調査” and especially トレンド分析、研究、キーワード調査、競合分析、Googleトレンドの代替、キーワードリサーチ. This follows recorded positioning and does not imply unlisted capabilities are absent.
Glimpse also currently records: pricing is freemium, product type is website, 213.7K verified monthly visits, no verified user rating. Verify any hard requirement around price, platform, or reach before trial, and do not let sparse review data substitute for testing.
The available data describes positioning, public visibility, and community signals, but it cannot prove output quality, speed, integration effort, privacy, or long-term cost in your workflow. Before deciding, run the same representative tasks in Gastrograph and Glimpse, then record completion time, accuracy, manual corrections, and the real paid threshold. A like-for-like trial turns this comparison into a defensible adoption decision.
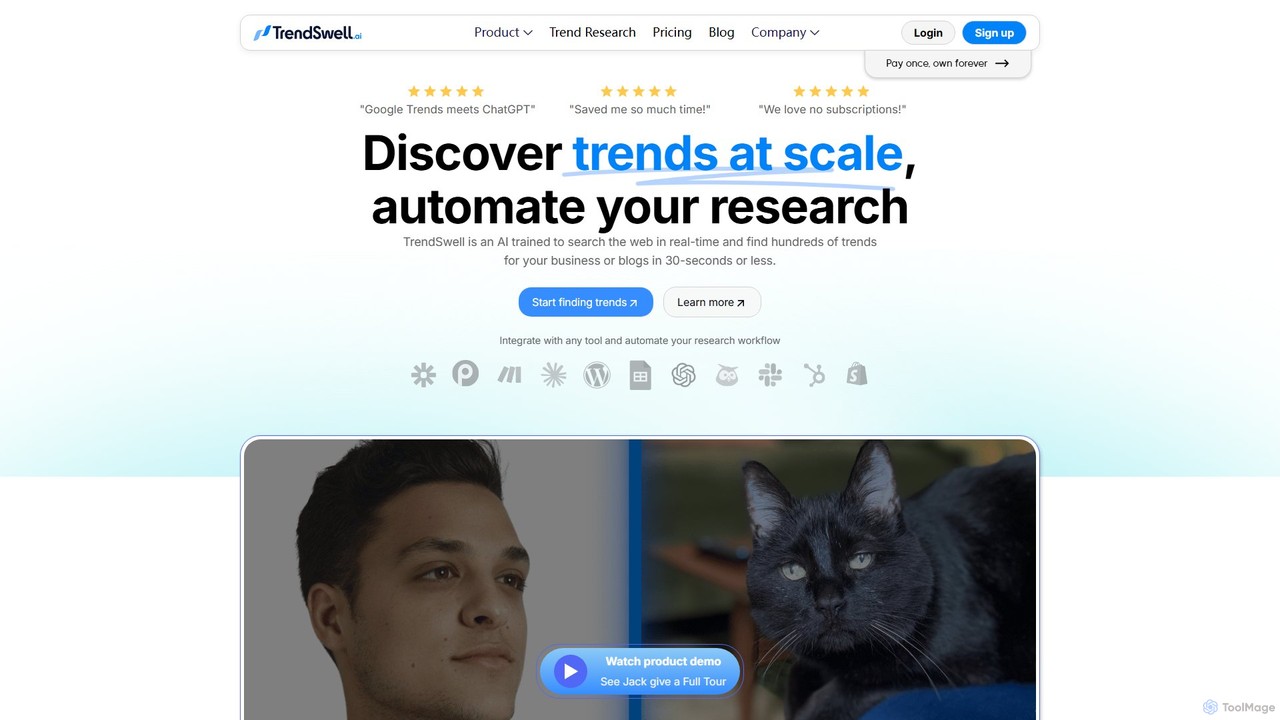
TrendSwellは、新たなトレンドの発見と分析を自動化するAI搭載の研究プラットフォームです。リアルタイムでウェブを検索し、ビジネス、ブログ、製品リサーチに関連する何百ものトレンドを数秒で発見します。86カ国以上、40言語以上をグローバルにサポートし、検索ボリューム、CPC、競合データなどの詳細なインサイトを提供。マーケター、起業家、コンテンツ制作者にとってGoogleトレンドより優れた代替手段となります。
市場調査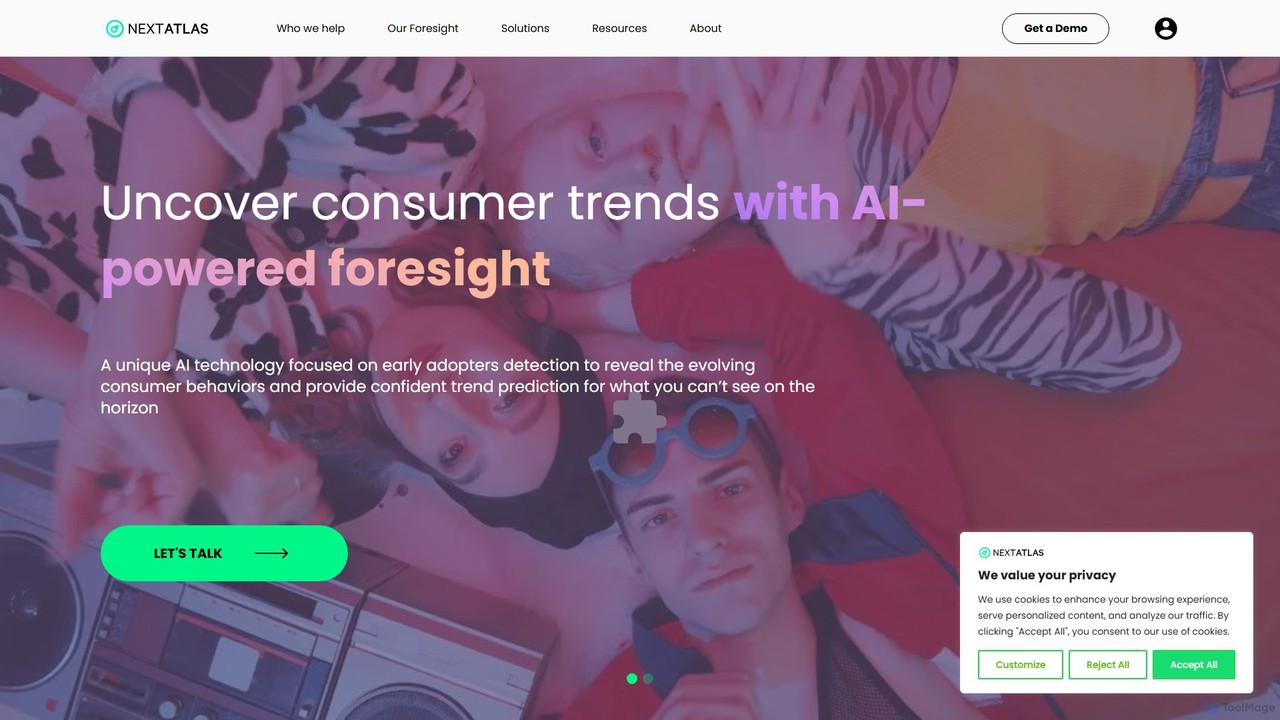

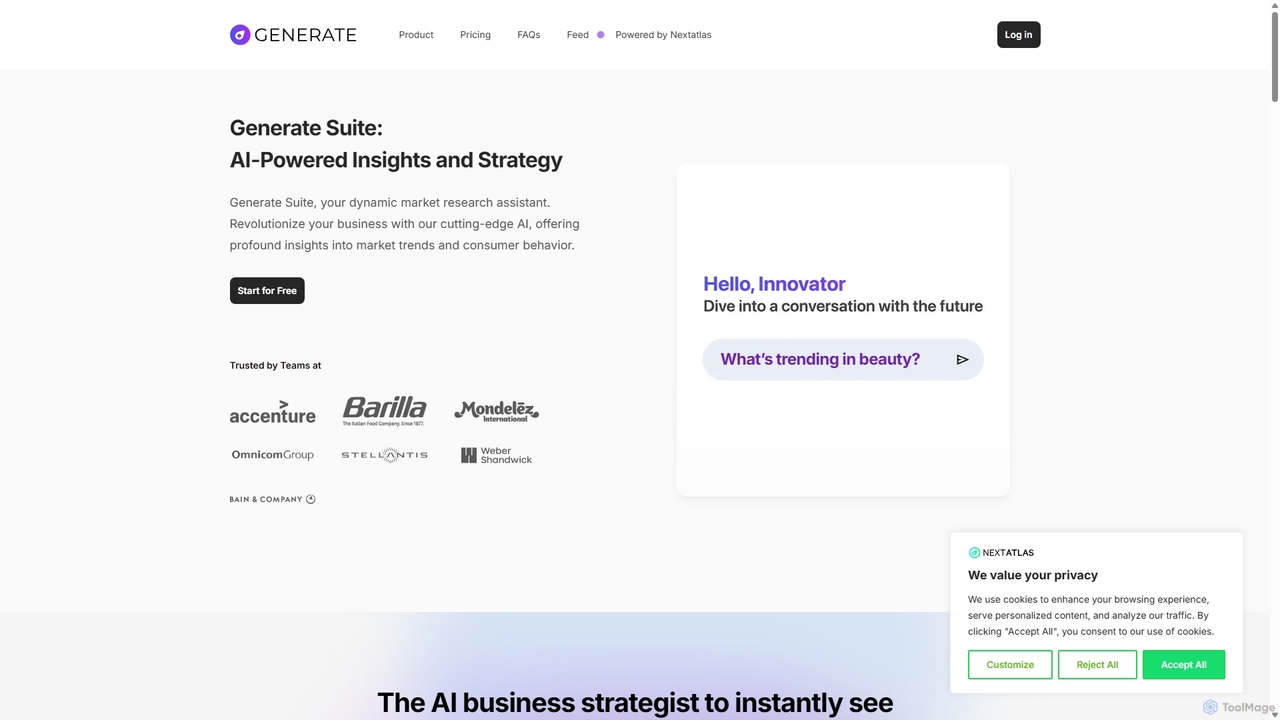
Nextatlas Generateは、世界初の生成型トレンド予測サービスです。強力で業界から信頼されているデータエンジンと生成AIを組み合わせ、市場トレンド、消費者行動、未来の市場機会に関する深い洞察を提供します。AIビジネスストラテジストとして機能し、専門家が前例のないスピードと精度でリサーチを効率化し、イノベーションを追跡し、データ駆動型の戦略を構築するのを支援します。
市場調査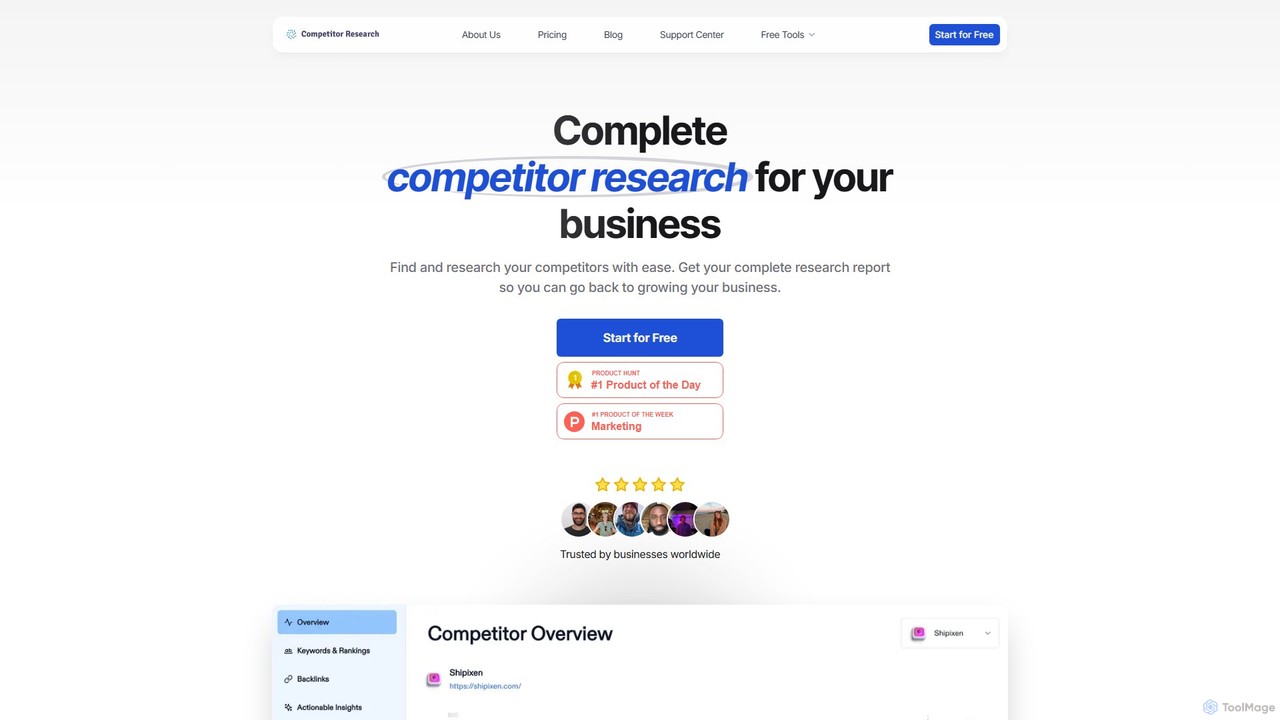
AIを活用した競合分析ツールで、マーケティング戦略、SEO、製品、価格設定に関する包括的なレポートを自動生成します。直接的、間接的、潜在的な競合他社を特定し、ビジネス成長のための実用的なインサイトを提供し、数百時間の手作業を削減します。
市場調査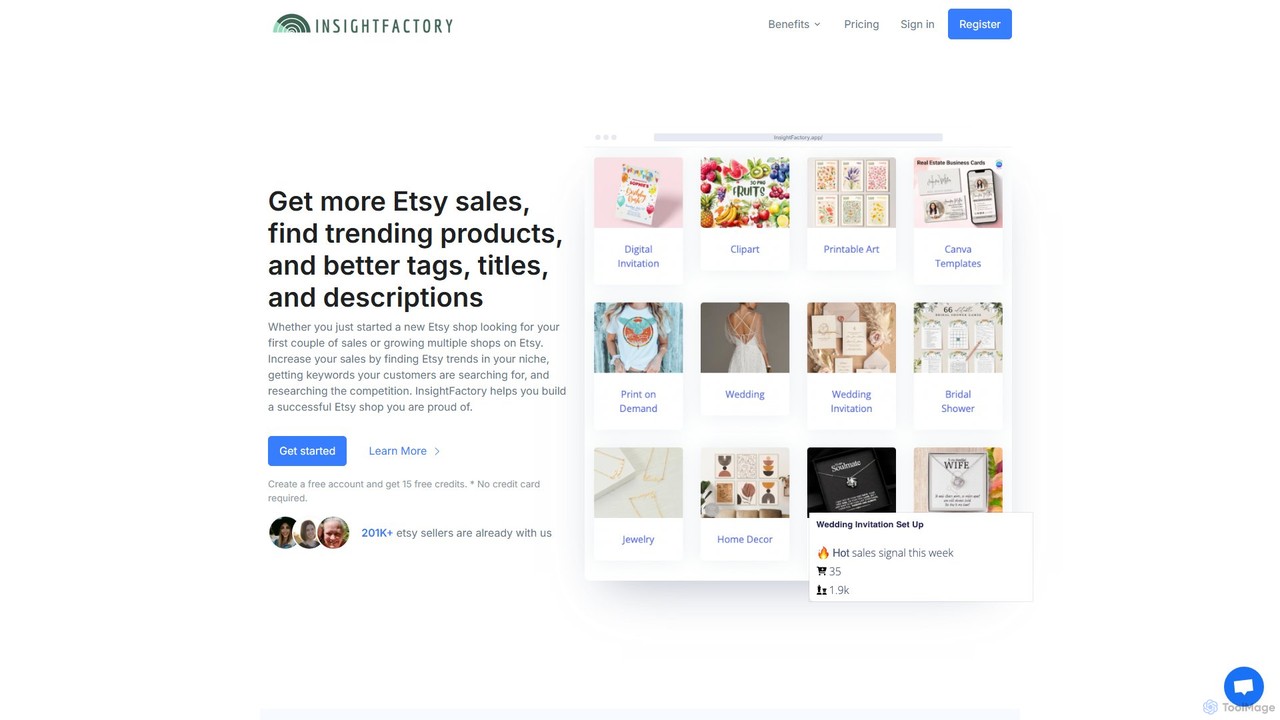
Etsyセラー向けのAI搭載ツール。トレンド商品や低競争ニッチを発見し、SEOを最適化して売上を向上させます。ワンクリックで高性能なタグ、タイトル、説明を生成し、新規および経験豊富なセラーのデータに基づいた意思決定に最適です。
エッツィ
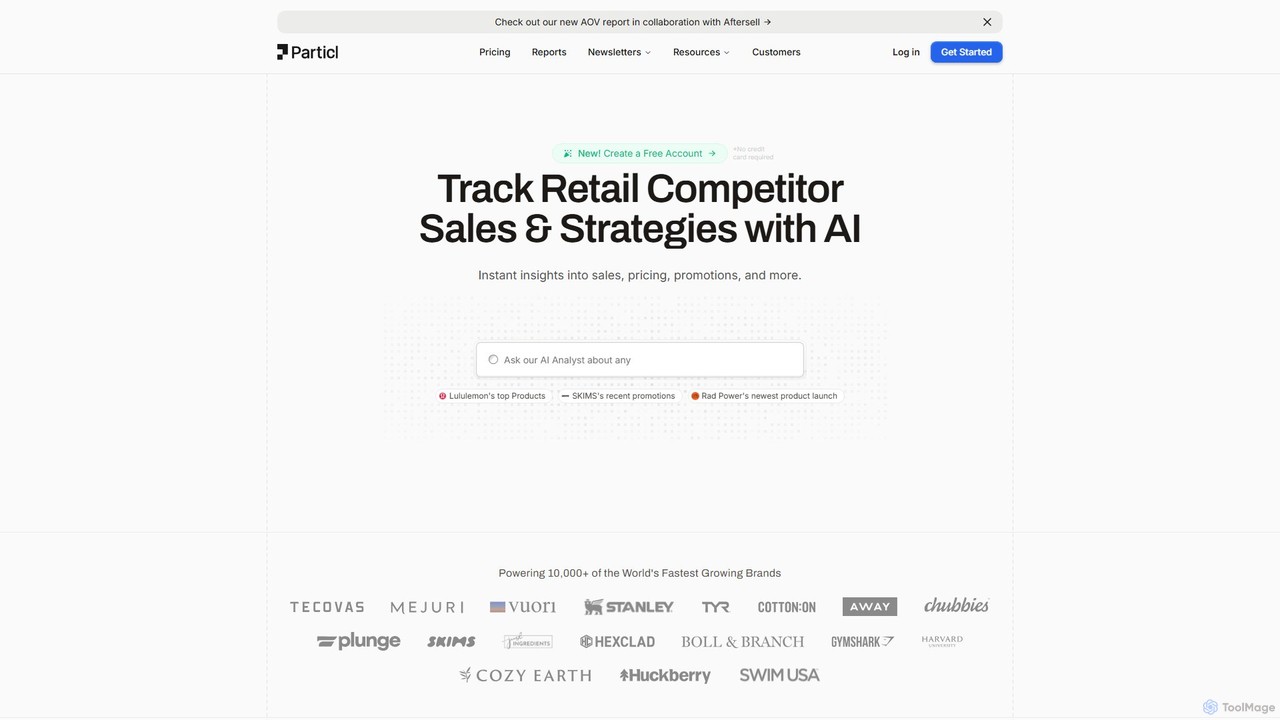
Particlは、Eコマースおよび小売ブランド向けのAI搭載競合追跡プラットフォームです。競合他社の売上、価格設定、プロモーション、商品構成、市場トレンドに関するリアルタイムの洞察を提供し、企業がデータに基づいた意思決定を行い、競争優位性を獲得できるよう支援します。
ビジネスインテリジェンス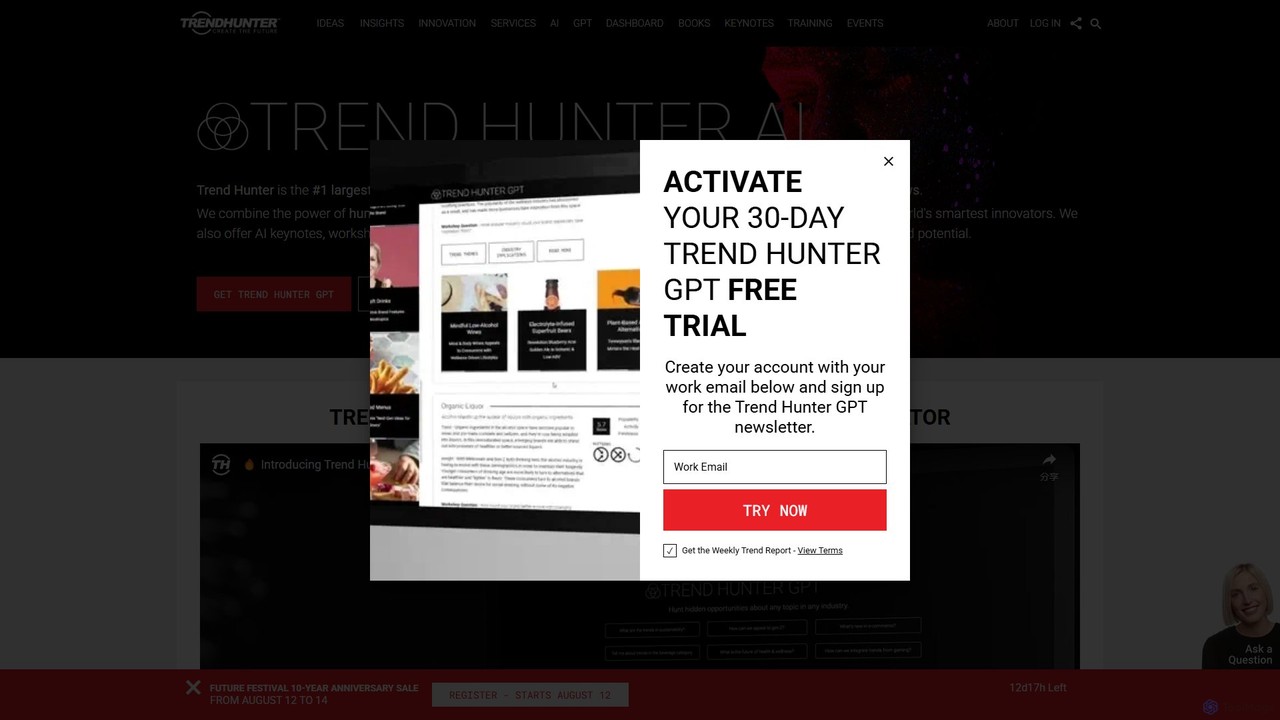
Trend Hunter AIは、世界最大のトレンドデータベースと生成AIを活用し、企業が市場機会を発見し、製品アイデアを創出し、詳細なトレンドレポートを作成するのを支援する先進的なイノベーションプラットフォームです。AIの効率性と人間が検証したインサイトを組み合わせ、リサーチと戦略計画を加速させます。
イノベーションマネジメント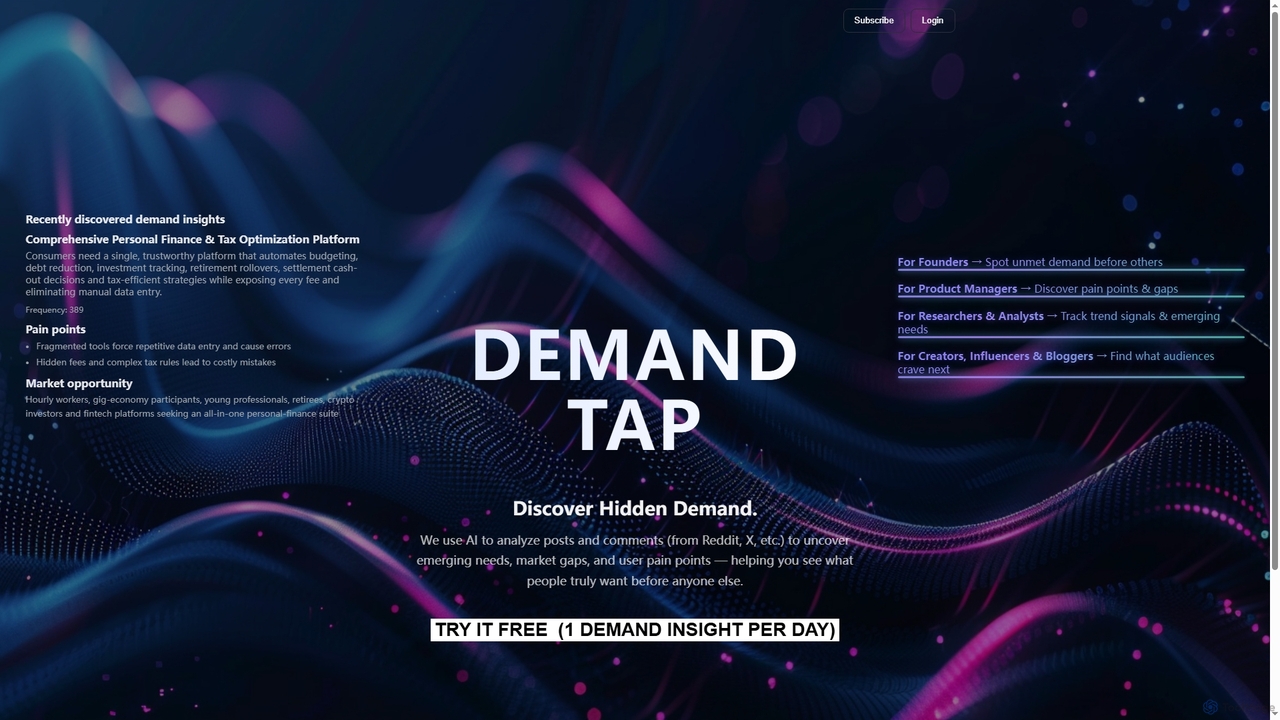
Demand Tapは、RedditやXなどのソーシャルメディアプラットフォームでの会話を分析し、新たな消費者のニーズ、市場のギャップ、ユーザーのペインポイントを明らかにし、人々が本当に何を求めているかを発見するのを助けるAI搭載の市場調査ツールです。
スタートアップのアイデア
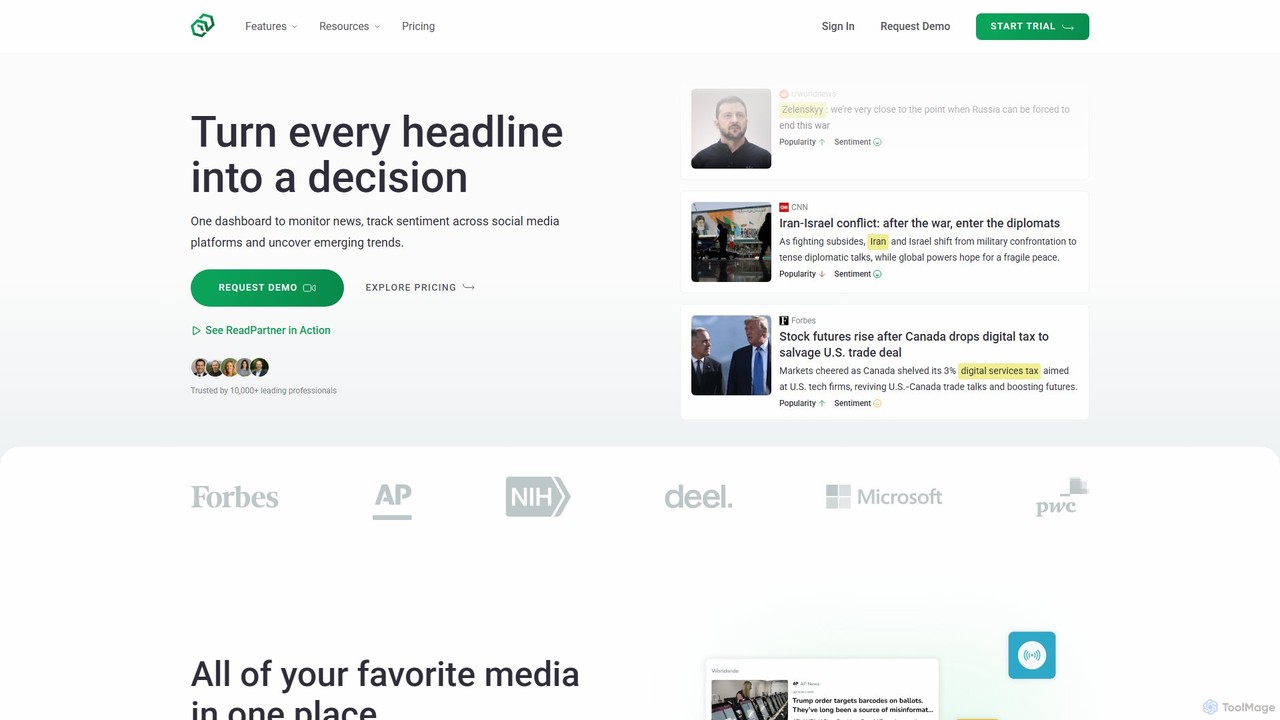
ReadPartnerは、企業向けのAI搭載メディアインテリジェンスプラットフォームです。グローバルニュースの監視、ソーシャルメディアのセンチメント追跡、新興市場トレンドのリアルタイム分析を単一のダッシュボードで提供し、データに基づいた予測的な意思決定を可能にします。
市場調査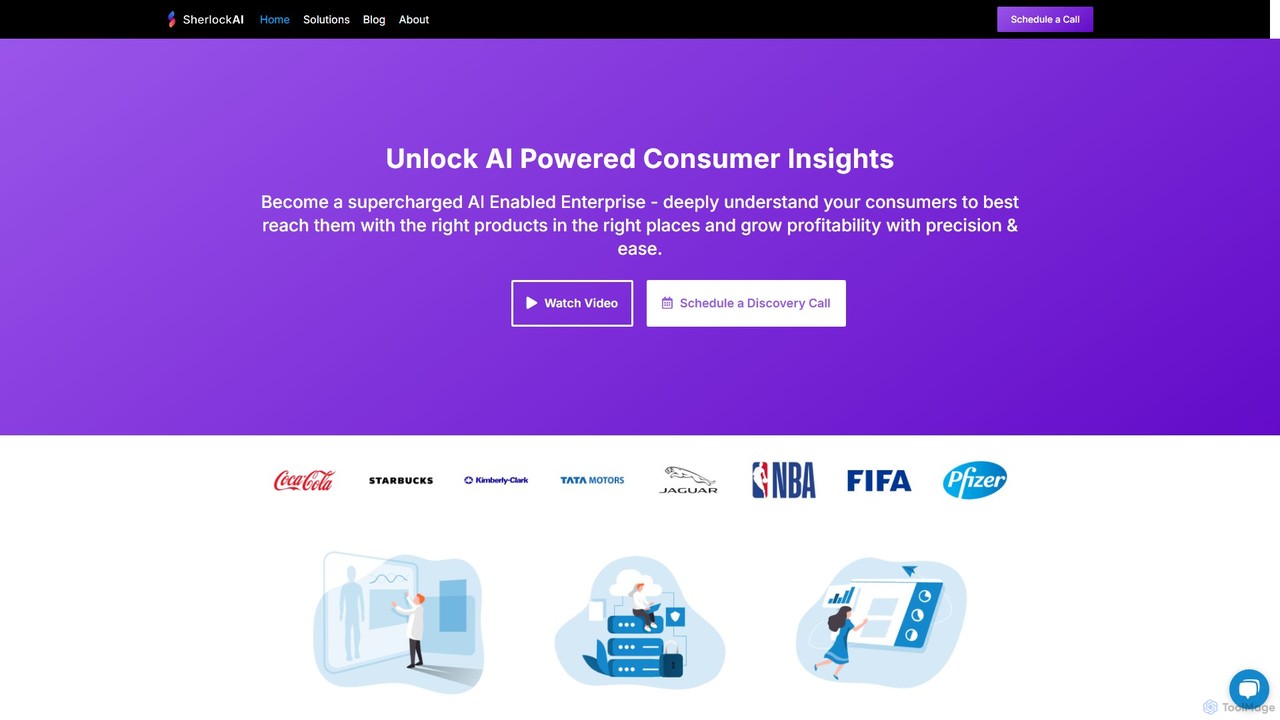
Infinite Analyticsは、詳細な消費者インサイト、マーケティングインテリジェンス、ロケーション分析を提供するエンタープライズ向けプラットフォーム「Sherlock AI」を提供しています。3億5000万人以上の消費者データを分析し、企業がオーディエンスを理解し、MetaやGoogleなどのチャネルでマーケティングキャンペーンを最適化し、立地選定や小売戦略に関する戦略的意思決定を行うのを支援します。データ主導の成長と収益性向上を目指して設計されています。
ロケーションインテリジェンス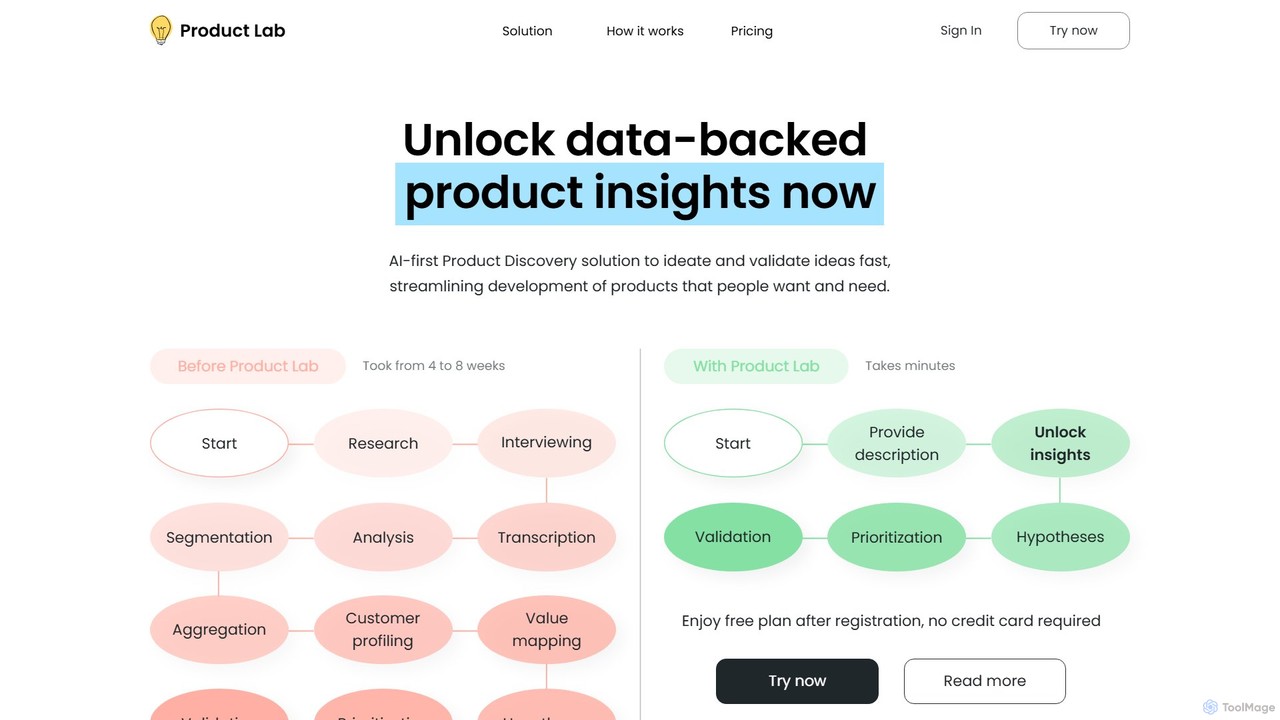
Product Lab AIは、プロダクトマネージャー、起業家、チーム向けに設計されたオールインワンのAI搭載プラットフォームです。アイデア創出や市場調査から、仕様書作成、ロードマップ作成、ユーザーフィードバック分析まで、プロダクトライフサイクル全体を効率化します。データ駆動型のインサイトと自動化されたワークフローで、製品開発プロセスを変革しましょう。
市場調査