DataLine
분석 · 3.5K 월 방문
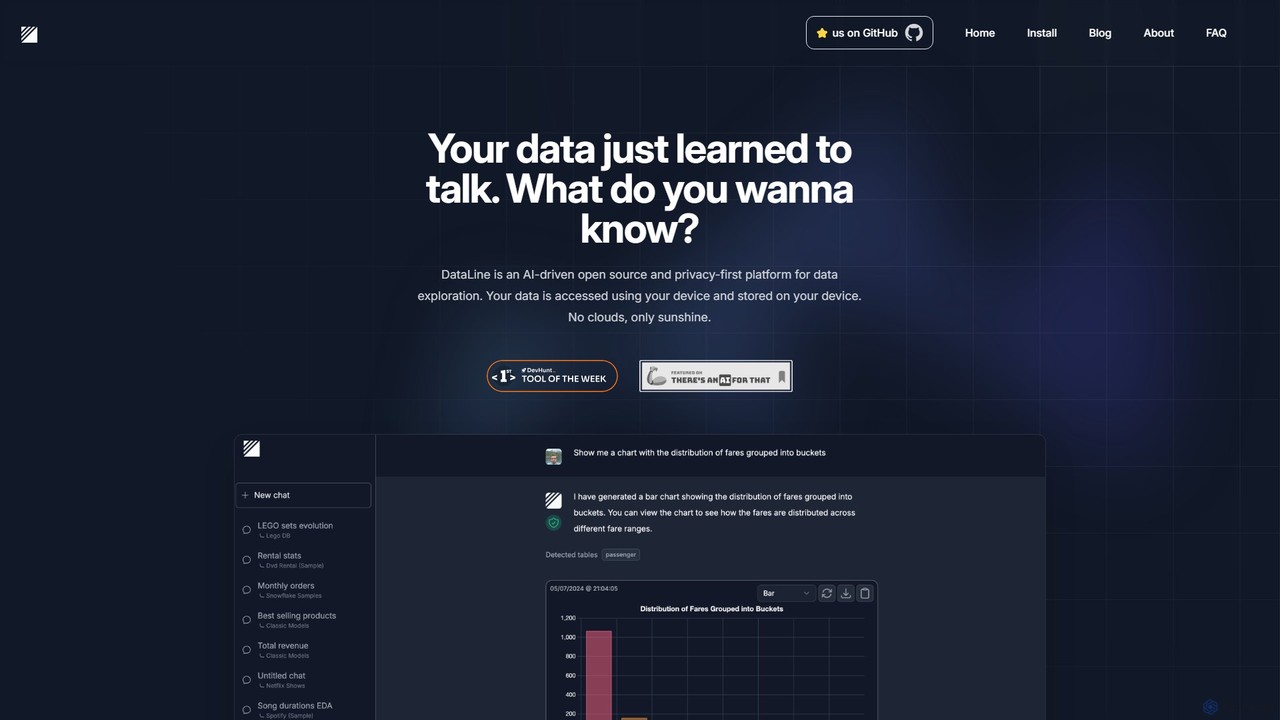
DataLine은 자연어를 통해 데이터를 탐색할 수 있게 해주는 오픈 소스, 개인 정보 보호 우선 AI 플랫폼입니다. 데이터베이스와 파일에 안전하게 연결하고, 질문을 하고, 데이터가 기기를 떠나지 않고도 즉각적인 인사이트와 시각화를 얻을 수 있습니다.
DataLine은 자연어를 통해 데이터를 탐색할 수 있게 해주는 오픈 소스, 개인 정보 보호 우선 AI 플랫폼입니다. 데이터베이스와 파일에 안전하게 연결하고, 질문을 하고, 데이터가 기기를 떠나지 않고도 즉각적인 인사이트와 시각화를 얻을 수 있습니다.
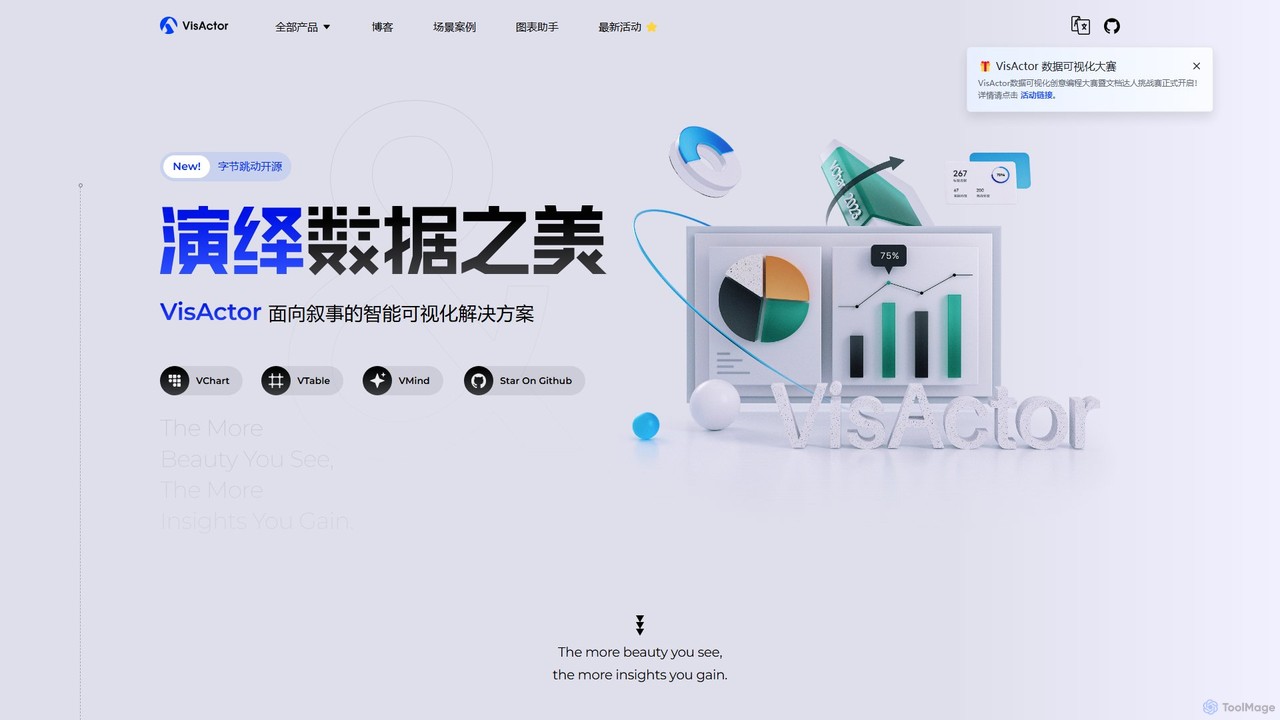
VisActor는 ByteDance에서 개발한 오픈 소스, 내러티브 중심의 지능형 시각화 솔루션입니다. VChart 및 VTable을 포함한 포괄적인 도구 모음을 제공하여 데이터를 매력적인 시각적 스토리로 변환합니다. AI 기반 구성 요소인 VMind를 통해 차트 생성을 단순화하고 동적이며 크로스 플랫폼 데이터 프레젠테이션을 가능하게 합니다.
DataLine은 자연어를 통해 데이터를 탐색할 수 있게 해주는 오픈 소스, 개인 정보 보호 우선 AI 플랫폼입니다. 데이터베이스와 파일에 안전하게 연결하고, 질문을 하고, 데이터가 기기를 떠나지 않고도 즉각적인 인사이트와 시각화를 얻을 수 있습니다.
VisActor는 ByteDance에서 개발한 오픈 소스, 내러티브 중심의 지능형 시각화 솔루션입니다. VChart 및 VTable을 포함한 포괄적인 도구 모음을 제공하여 데이터를 매력적인 시각적 스토리로 변환합니다. AI 기반 구성 요소인 VMind를 통해 차트 생성을 단순화하고 동적이며 크로스 플랫폼 데이터 프레젠테이션을 가능하게 합니다.
| Feature | DataLine | VisActor |
|---|---|---|
| 주요 카테고리 | 분석 | 라이브러리 및 프레임워크 |
| 등록일 | 2025-08-07 | 2025-08-12 |
| 가격 | 무료 | 무료 |
| 공식 사이트 | dataline.app | visactor.io |
| 제품 유형 | 앱 | 웹사이트 |
| Performance data | ||
| 사용자 평점 | 확인되지 않음 | 확인되지 않음 |
| 댓글 | 0 | 0 |
| 월 방문 | 3.5K | 22.3K |
| 월 성장률 | 43.8% | -27.7% |
| 즐겨찾기 | 112 | 126 |
| Details | 상세 보기 | 상세 보기 |
Compare DataLine and VisActor by monthly reach, traffic trend, visit depth, top regions, and acquisition sources.
In the DataLine vs VisActor monthly traffic comparison, DataLine currently shows 3.5K visits and VisActor shows 22.3K; VisActor has about 6.3 times the visible traffic of DataLine, an absolute difference of about 18.7K visits. This reflects visible reach, not feature quality or paid users.
Both tools provide verified traffic details, so monthly trends, visit depth, regions, and acquisition sources can be compared on the same basis.
| Country/region | Percentage | Traffic |
|---|---|---|
| 🇺🇸United States | 56.06% | 2K |
| 🇹🇷Turkey | 25.8% | 913 |
| 🇮🇳India | 18.14% | 642 |
| Country/region | Percentage | Traffic |
|---|---|---|
| 🇨🇳China | 84.12% | 18.7K |
| 🇺🇸United States | 6.91% | 1.5K |
| 🇰🇷Korea, Republic of | 3.07% | 684 |
| 🇧🇷Brazil | 2.99% | 666 |
| 🇭🇰Hong Kong | 2.91% | 648 |
| Source type | Percentage | Traffic |
|---|---|---|
| 직접 | 79.43% | 17.7K |
| 리퍼럴 | 20.57% | 4.6K |
This in-depth DataLine vs VisActor comparison uses only the product records, taxonomy, audience, traffic, and community signals available on this page. DataLine is primarily listed under “분석”, while VisActor is primarily listed under “라이브러리 및 프레임워크”, so the first decision is whether your actual task matches their recorded scope.
The structured fields currently show these decision-relevant differences: Primary category (DataLine: 분석; VisActor: 라이브러리 및 프레임워크); Product type (DataLine: App; VisActor: Website); Monthly visits (DataLine: 3.5K; VisActor: 22.3K); Monthly growth (DataLine: 43.8%; VisActor: -27.7%); Favorites (DataLine: 112; VisActor: 126). These facts are more useful for selection than brand visibility alone.
In the DataLine vs VisActor monthly traffic comparison, DataLine currently shows 3.5K visits and VisActor shows 22.3K; VisActor has about 6.3 times the visible traffic of DataLine, an absolute difference of about 18.7K visits. This reflects visible reach, not feature quality or paid users.
Both tools provide verified traffic details, so monthly trends, visit depth, regions, and acquisition sources can be compared on the same basis.
If public market visibility is an important first-pass criterion, investigate VisActor first. The final choice should still follow taxonomy, use case, and a real trial because higher traffic does not prove broader capabilities or better workflow fit.
DataLine and VisActor currently overlap in shared categories: 비즈니스 인텔리전스; shared tags: 비즈니스 인텔리전스, 데이터 시각화 및 오픈 소스. This can place both on the same shortlist, but it does not prove equal implementation, depth, or cost.
DataLine's unique categories/tags are 분석, 데이터베이스, 데이터와 채팅, 데이터 분석, 로컬 AI, 자연어 쿼리, PostgreSQL 및 프라이버시; VisActor's are 라이브러리 및 프레임워크, AI 차트 생성기, 차트, 데이터 스토리텔링, 개발자 도구, 그래프, JavaScript 라이브러리 및 내러티브 시각화. These unique fields are the strongest differentiators: validate the product whose recorded scope matches the task instead of following traffic alone.
DataLine has no verified rating, 0 comments, 112 favorites, and 127 likes;VisActor has no verified rating, 0 comments, 126 favorites, and 120 likes。
Neither product has enough rating or comment samples for a credible reputation ranking.
Put DataLine on the priority trial list when the task aligns with “분석” and especially 분석, 데이터베이스, 데이터와 채팅, 데이터 분석, 로컬 AI 및 자연어 쿼리. This follows recorded positioning and does not imply unlisted capabilities are absent.
DataLine also currently records: pricing is free, product type is app, 3.5K verified monthly visits, no verified user rating. Verify any hard requirement around price, platform, or reach before trial, and do not let sparse review data substitute for testing.
Put VisActor on the priority trial list when the task aligns with “라이브러리 및 프레임워크” and especially 라이브러리 및 프레임워크, AI 차트 생성기, 차트, 데이터 스토리텔링, 개발자 도구 및 그래프. This follows recorded positioning and does not imply unlisted capabilities are absent.
VisActor also currently records: pricing is free, product type is website, 22.3K verified monthly visits, no verified user rating. Verify any hard requirement around price, platform, or reach before trial, and do not let sparse review data substitute for testing.
The available data describes positioning, public visibility, and community signals, but it cannot prove output quality, speed, integration effort, privacy, or long-term cost in your workflow. Before deciding, run the same representative tasks in DataLine and VisActor, then record completion time, accuracy, manual corrections, and the real paid threshold. A like-for-like trial turns this comparison into a defensible adoption decision.
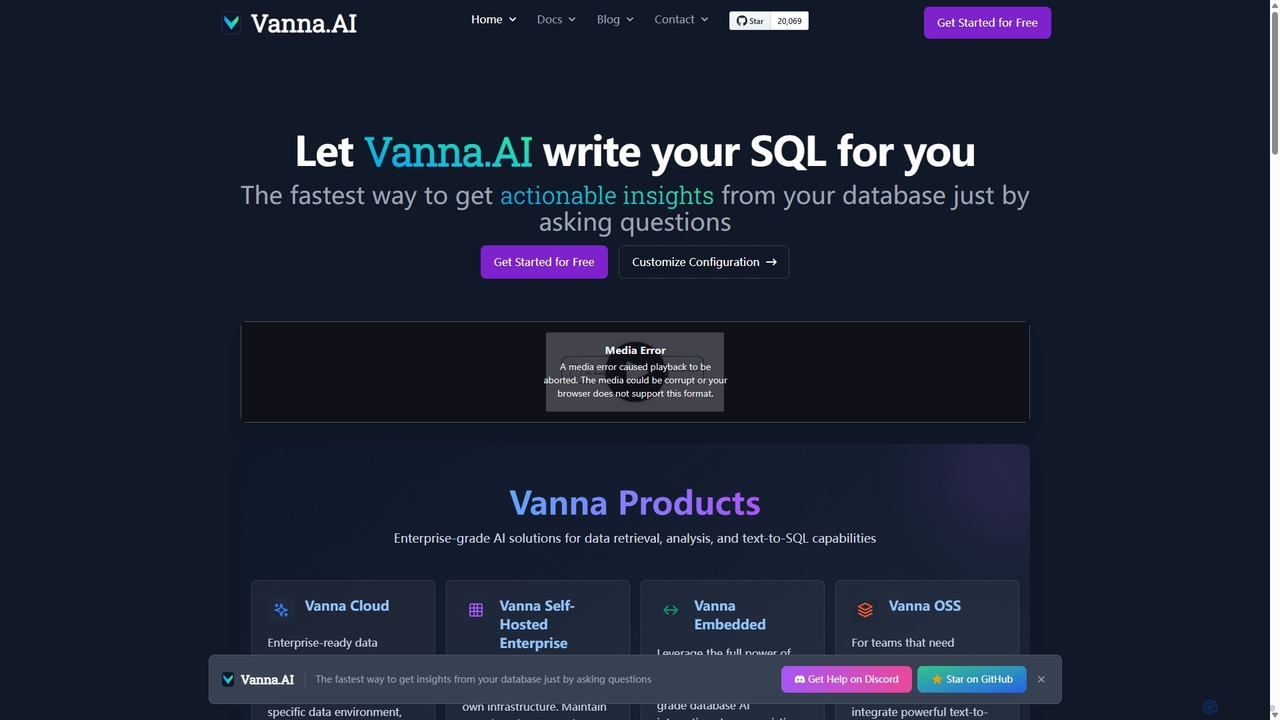
Vanna.AI는 자연어 질문을 정확한 SQL 쿼리로 변환하는 오픈 소스 개인화 AI SQL 에이전트입니다. 특정 데이터베이스 스키마, 문서 및 과거 쿼리로 훈련된 검색 증강 생성(RAG) 모델을 사용하여 복잡한 데이터 세트에서 높은 정확도를 달성합니다. 보안, 유연성 및 모든 애플리케이션에 쉽게 통합할 수 있도록 설계되어 기술 및 비기술 사용자 모두가 데이터에서 손쉽게 통찰력을 얻을 수 있도록 지원합니다.
비즈니스 인텔리전스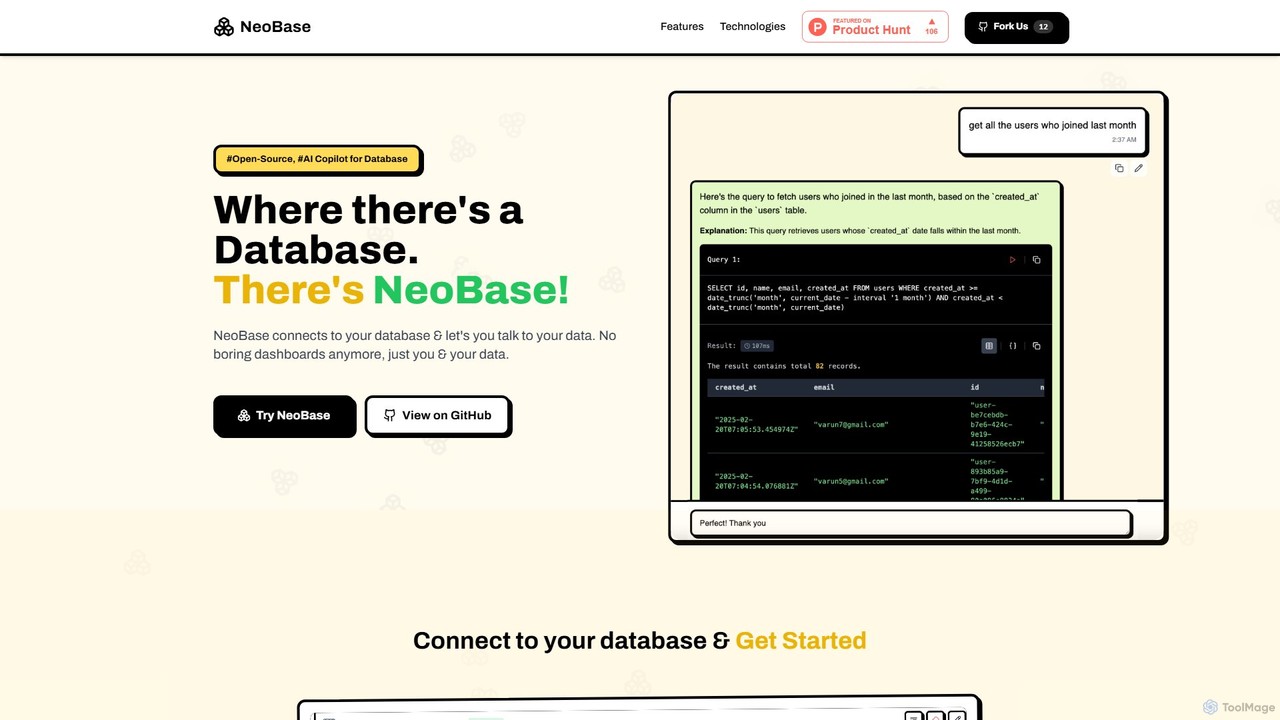
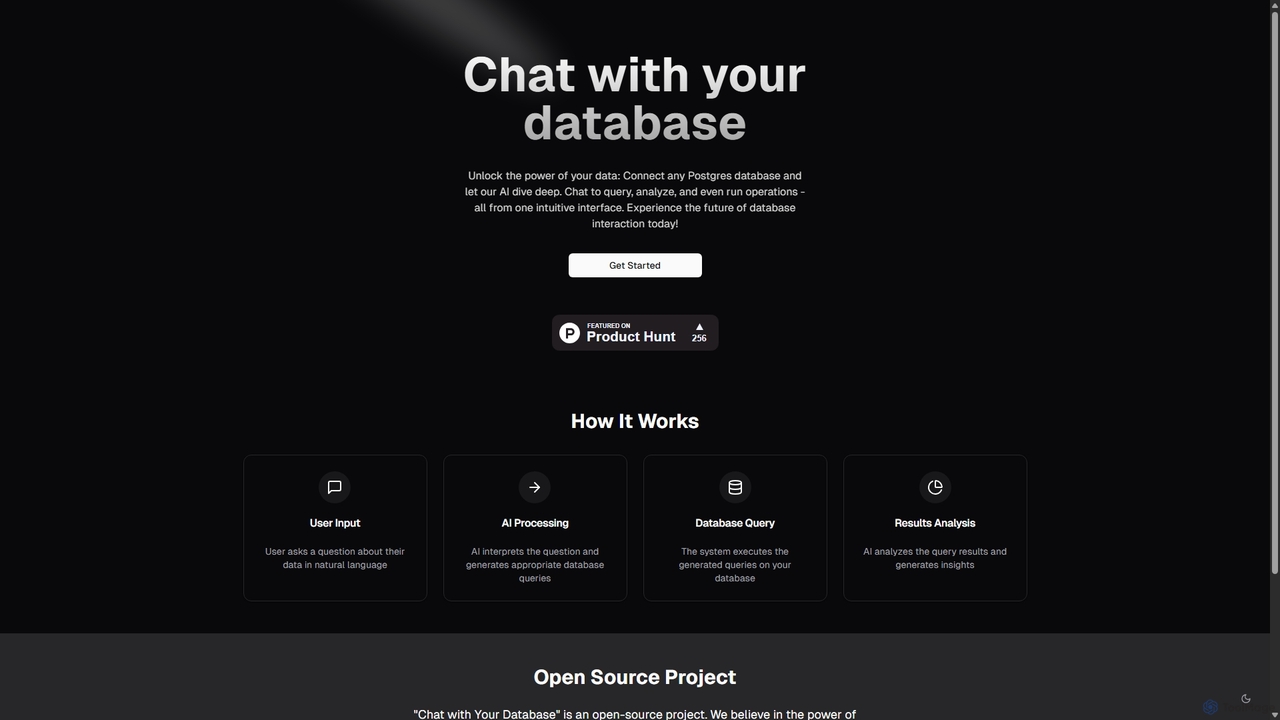
자연어를 사용하여 PostgreSQL 데이터베이스와 상호 작용할 수 있는 오픈 소스 AI 도구입니다. 복잡한 SQL 쿼리 없이 간단한 채팅 인터페이스를 통해 질문하고, 통찰력을 얻고, 작업을 수행하세요.
비즈니스 인텔리전스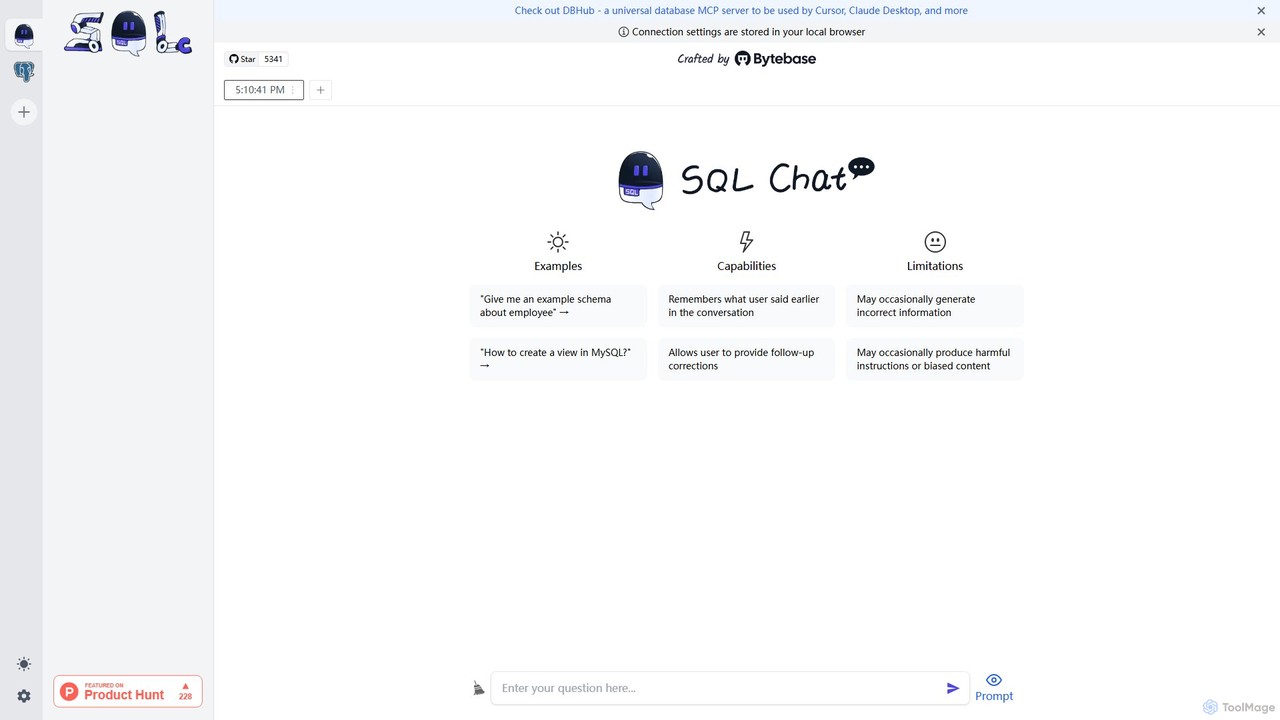
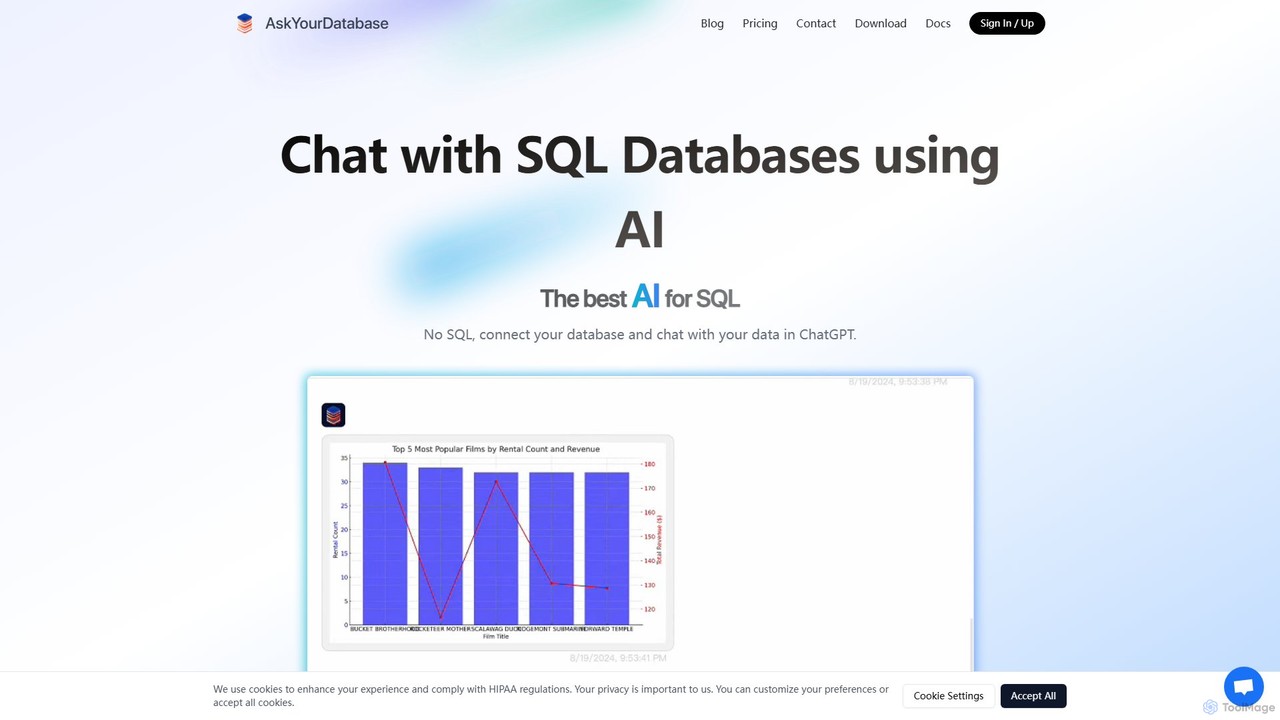
AskYourDatabase는 자연어를 사용하여 데이터베이스와 상호 작용할 수 있는 강력한 AI SQL 어시스턴트입니다. SQL 코드를 한 줄도 작성하지 않고 데이터를 쿼리하고, 시각화를 생성하며, 대화형 대시보드를 구축할 수 있습니다. 다양한 데이터베이스를 지원하며, 데스크톱 및 임베디드 챗봇 버전을 제공하고, 온프레미스 배포 옵션으로 데이터 보안을 우선시합니다.
데이터 분석
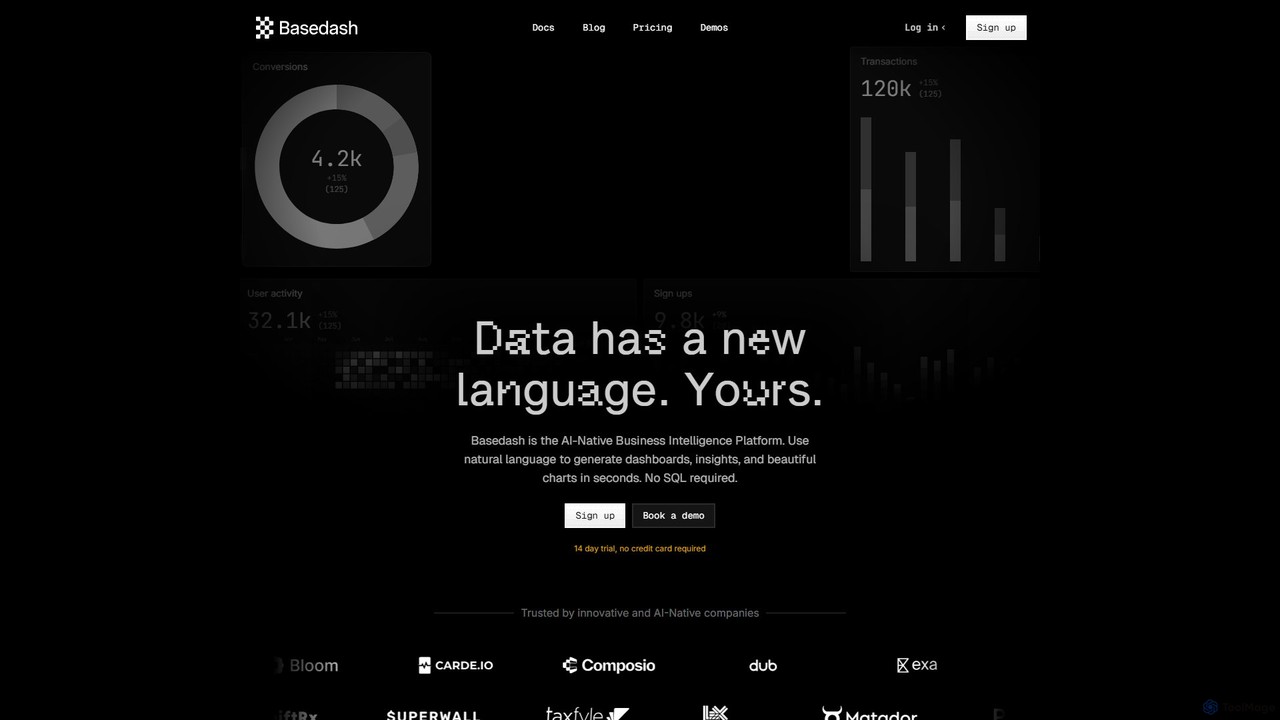
Basedash는 AI 네이티브 비즈니스 인텔리전스 플랫폼으로, 팀이 자연어를 사용하여 데이터와 상호 작용할 수 있도록 합니다. SQL 코드를 작성하지 않고도 몇 초 만에 아름다운 대시보드, 차트 및 인사이트를 생성할 수 있습니다. 데이터 소스를 연결하고 질문만 하면 답변을 얻을 수 있습니다.
비즈니스 인텔리전스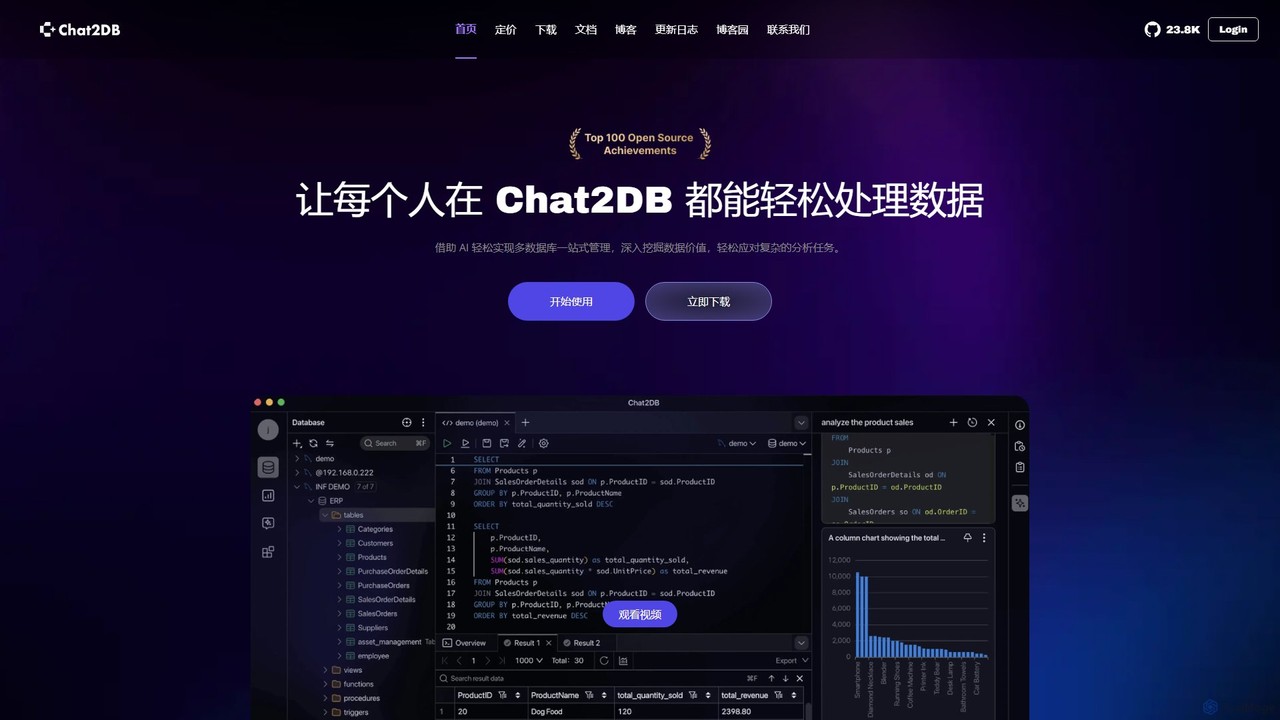
Chat2DB는 AI 기반의 지능형 올인원 데이터베이스 관리 도구입니다. MySQL, PostgreSQL, MongoDB를 포함한 30개 이상의 데이터베이스를 지원하며, 사용자가 자연어를 사용하여 데이터를 관리, 쿼리 및 분석할 수 있도록 합니다. AI SQL 생성, 데이터 시각화, 코드 없는 대시보드 생성 및 강력한 보안 프로토콜과 같은 기능을 갖추고 있어 개발자, 분석가 및 비즈니스 사용자에게 이상적입니다.
비즈니스 인텔리전스
Seek AI는 데이터 분석을 위한 생성형 AI 플랫폼으로, 사용자가 자연어를 사용하여 데이터베이스를 쿼리하고, 보고서를 생성하며, 시각화를 만들 수 있도록 지원합니다. 텍스트-SQL 변환 프로세스를 자동화하여 비기술적인 사용자도 데이터에 쉽게 접근할 수 있게 하고 데이터 팀의 인사이트 도출을 가속화합니다.
비즈니스 인텔리전스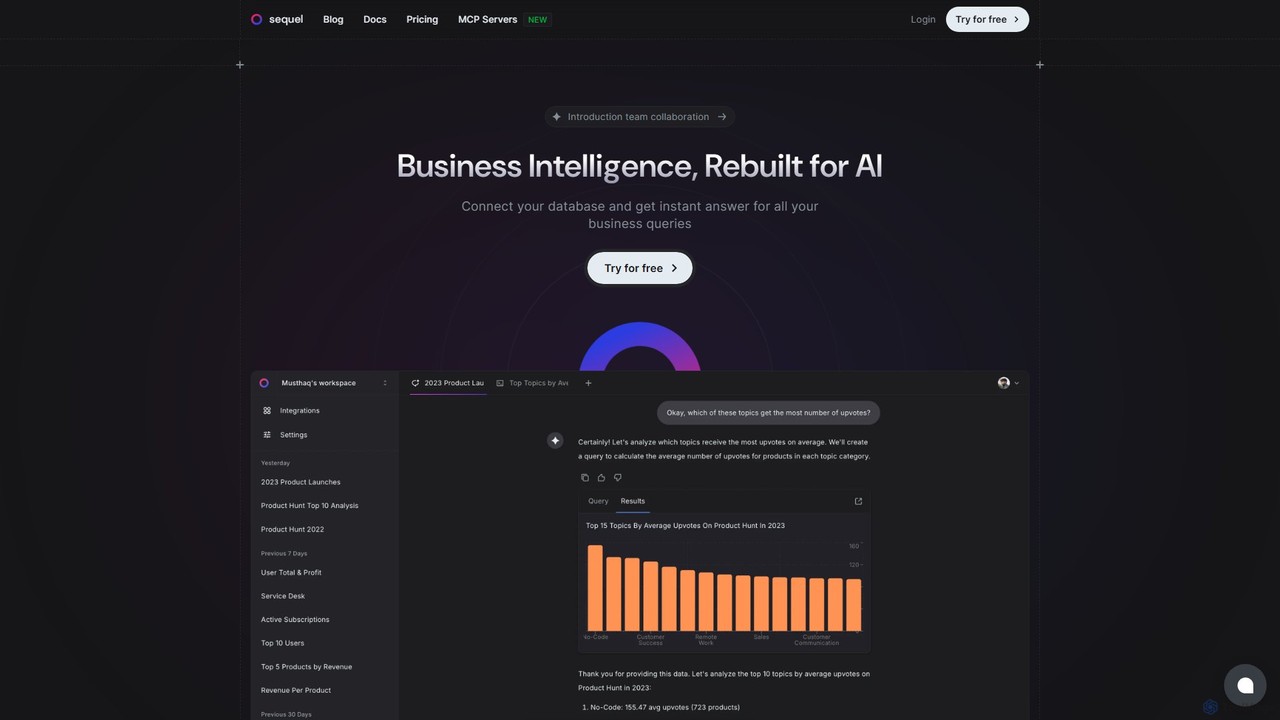
Sequel은 자연어를 사용하여 데이터베이스와 상호 작용할 수 있게 해주는 AI 기반 비즈니스 인텔리전스 플랫폼입니다. 데이터를 연결하고, 평이한 언어로 질문하면 SQL 코드 한 줄 없이 즉시 보고서, 시각화 자료, 인사이트를 얻을 수 있습니다.
비즈니스 인텔리전스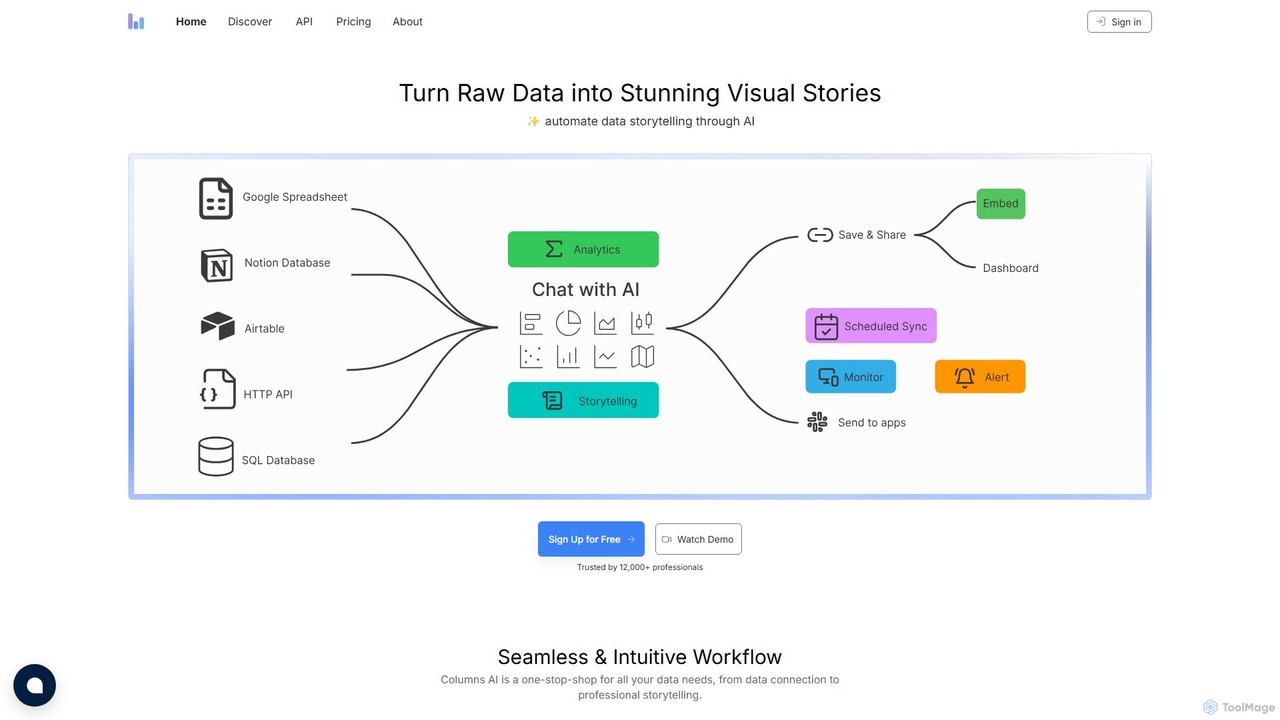
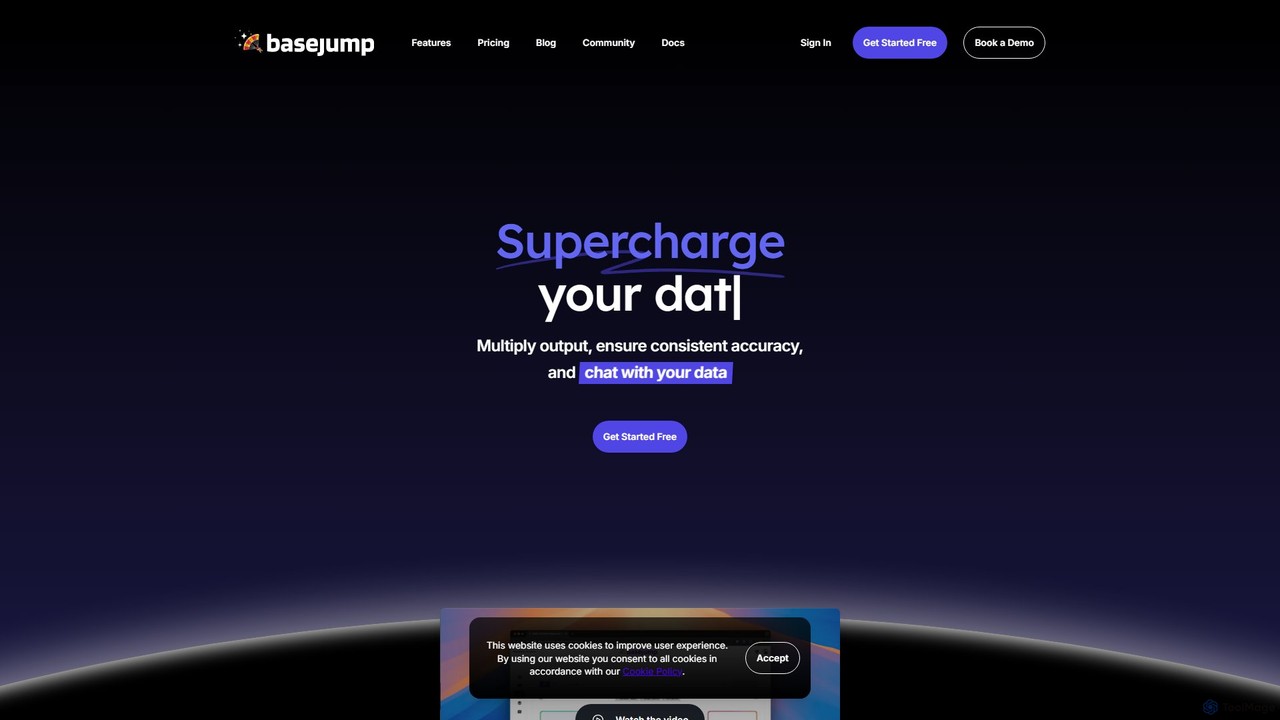
Basejump AI는 팀이 자연어를 사용하여 데이터베이스를 쿼리하고 인사이트를 얻을 수 있도록 하는 대화형 AI 데이터 분석 플랫폼입니다. 일상적인 질문을 SQL 쿼리로 변환하여 복잡한 대시보드나 코딩 기술 없이도 빠르고 정확하며 감사 가능한 데이터를 제공합니다.
비즈니스 인텔리전스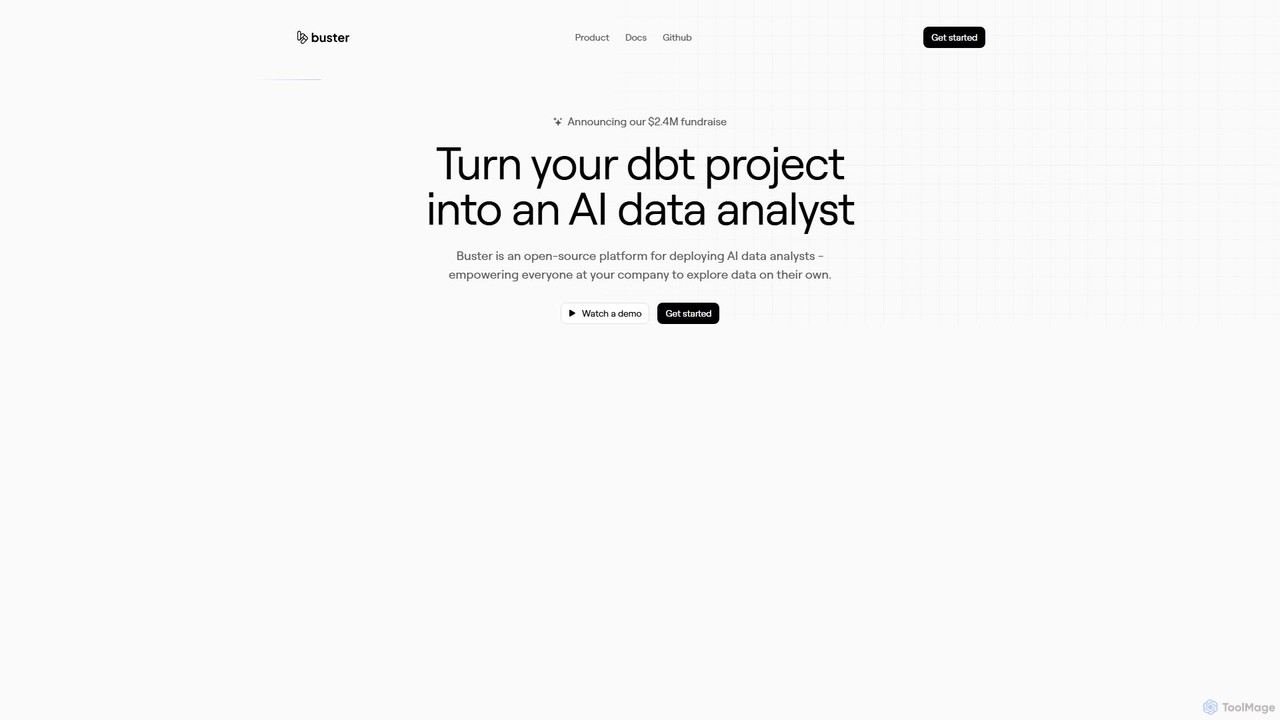
Buster는 모든 회사 구성원이 평이한 영어로 데이터를 탐색할 수 있도록 지원하는 오픈 소스 AI 데이터 분석가 플랫폼입니다. dbt 프로젝트와 통합되어 비즈니스 사용자가 코드를 작성하지 않고도 질문하고, 시각화를 생성하며, 대시보드를 구축할 수 있게 하여 데이터 팀을 임시 요청으로부터 해방시킵니다.
비즈니스 인텔리전스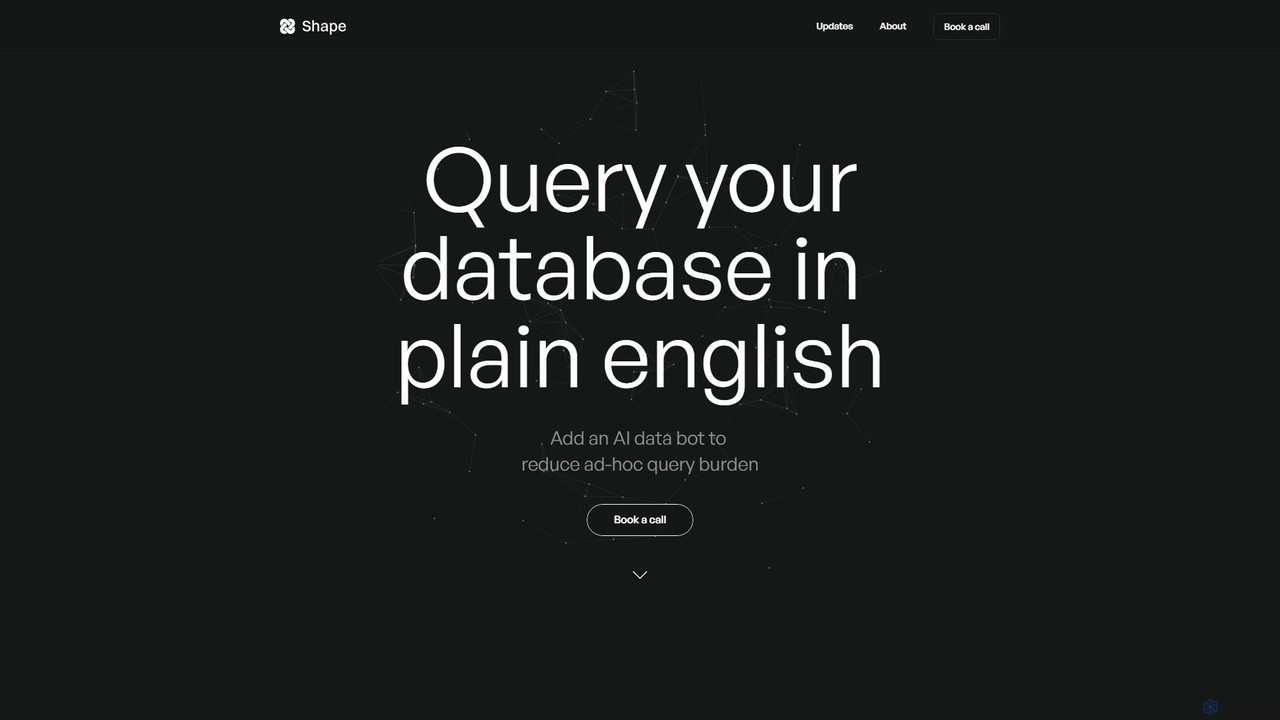
Shape는 AI 기반 데이터 분석가로, 팀이 평이한 영어로 데이터베이스를 쿼리할 수 있게 해줍니다. 기존 데이터 스택에 연결하여 비기술적인 사용자도 Slack 및 Microsoft Teams와 같은 통합을 통해 복잡한 데이터 질문에 대한 즉각적인 답변을 얻을 수 있습니다. 자연어를 고급 SQL로 변환함으로써 Shape는 미묘한 답변과 자동화된 시각화를 제공하고, 데이터 분석가를 임시 쿼리 부담에서 해방시켜 조직의 모든 사람이 데이터에 접근할 수 있도록 합니다.
API