Flypix
3D · 130.9K 月間訪問数
Flypixは、衛星、航空、ドローンの画像から物体を自動的に検出し、位置を特定し、セグメント化することを可能にする、エンドツーエンドのAI地理空間分析プラットフォームです。コーディング不要でカスタムAIモデルをトレーニングし、複雑なシーンを分析することで、農業、建設、環境モニタリングなどの業界で時間とリソースを大幅に節約します。
Flypixは、衛星、航空、ドローンの画像から物体を自動的に検出し、位置を特定し、セグメント化することを可能にする、エンドツーエンドのAI地理空間分析プラットフォームです。コーディング不要でカスタムAIモデルをトレーニングし、複雑なシーンを分析することで、農業、建設、環境モニタリングなどの業界で時間とリソースを大幅に節約します。
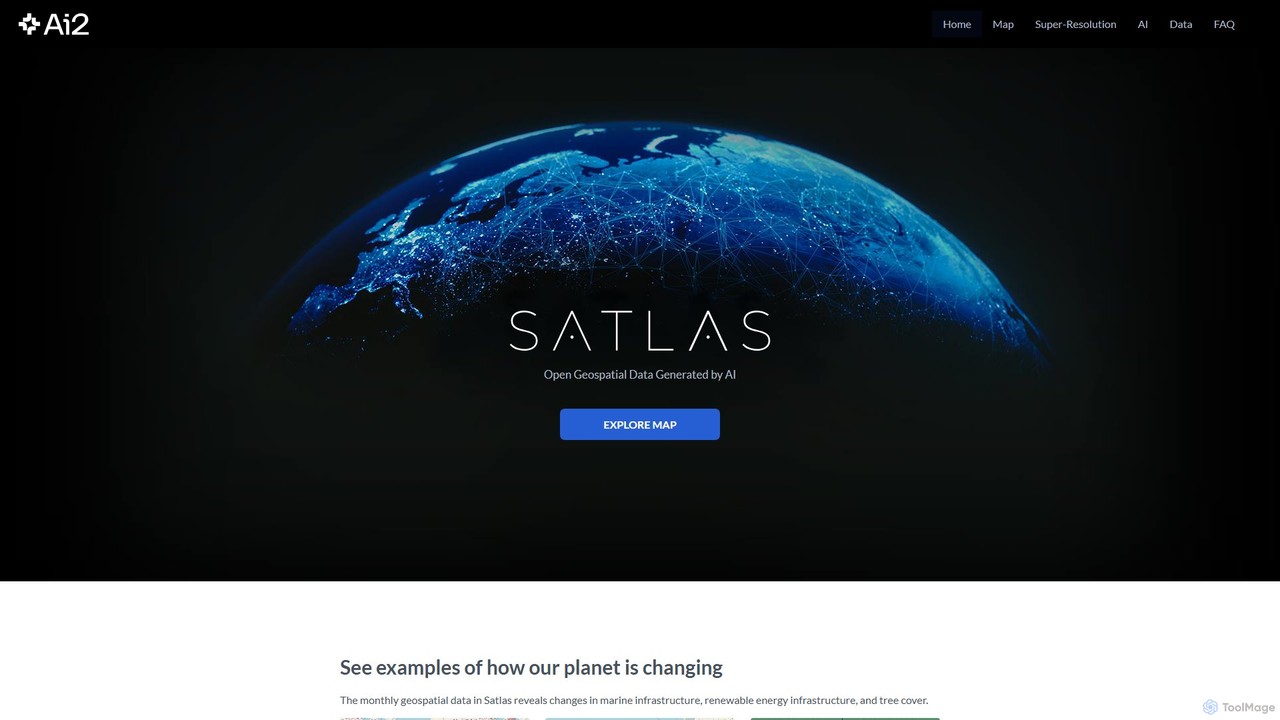
Satlasは、アレン人工知能研究所が開発したAI搭載プラットフォームで、オープンな高解像度地理空間データを提供します。高度なコンピュータビジョンモデルを用いて全球の衛星画像を分析し、樹木被覆、再生可能エネルギー、海洋インフラの変化を追跡します。その主要機能である「超解像」は、低解像度画像を強化し、詳細な分析を可能にします。
Flypixは、衛星、航空、ドローンの画像から物体を自動的に検出し、位置を特定し、セグメント化することを可能にする、エンドツーエンドのAI地理空間分析プラットフォームです。コーディング不要でカスタムAIモデルをトレーニングし、複雑なシーンを分析することで、農業、建設、環境モニタリングなどの業界で時間とリソースを大幅に節約します。
Satlasは、アレン人工知能研究所が開発したAI搭載プラットフォームで、オープンな高解像度地理空間データを提供します。高度なコンピュータビジョンモデルを用いて全球の衛星画像を分析し、樹木被覆、再生可能エネルギー、海洋インフラの変化を追跡します。その主要機能である「超解像」は、低解像度画像を強化し、詳細な分析を可能にします。
Compare Flypix and Satlas by monthly reach, traffic trend, visit depth, top regions, and acquisition sources.
In the Flypix vs Satlas monthly traffic comparison, Flypix currently shows 130.9K visits and Satlas shows 2.1K; Flypix has about 61.4 times the visible traffic of Satlas, an absolute difference of about 128.7K visits. This reflects visible reach, not feature quality or paid users.
Both tools provide verified traffic details, so monthly trends, visit depth, regions, and acquisition sources can be compared on the same basis.
| Country/region | Percentage | Traffic |
|---|---|---|
| 🇺🇸United States | 25.61% | 33.5K |
| 🇩🇪Germany | 21.2% | 27.7K |
| 🇰🇷Korea, Republic of | 19.87% | 26K |
| 🇧🇷Brazil | 18.13% | 23.7K |
| 🇯🇵Japan | 15.19% | 19.9K |
| Source type | Percentage | Traffic |
|---|---|---|
| ダイレクト | 91.81% | 120.2K |
| 参照元 | 8.19% | 10.7K |
| Country/region | Percentage | Traffic |
|---|---|---|
| 🇺🇸United States | 59.08% | 1.3K |
| 🇮🇳India | 12.25% | 261 |
| 🇩🇪Germany | 11.22% | 239 |
| 🇮🇹Italy | 9.24% | 197 |
| 🇦🇪United Arab Emirates | 8.21% | 175 |
| Source type | Percentage | Traffic |
|---|---|---|
| ダイレクト | 66.72% | 1.4K |
| 参照元 | 33.28% | 710 |
This in-depth Flypix vs Satlas comparison uses only the product records, taxonomy, audience, traffic, and community signals available on this page. Flypix is primarily listed under “3D”, while Satlas is primarily listed under “地理空間”, so the first decision is whether your actual task matches their recorded scope.
The structured fields currently show these decision-relevant differences: Primary category (Flypix: 3D; Satlas: 地理空間); Pricing (Flypix: Freemium; Satlas: Free); Monthly visits (Flypix: 130.9K; Satlas: 2.1K); Monthly growth (Flypix: 19.7%; Satlas: 20.1%); Favorites (Flypix: 124; Satlas: 99). These facts are more useful for selection than brand visibility alone.
In the Flypix vs Satlas monthly traffic comparison, Flypix currently shows 130.9K visits and Satlas shows 2.1K; Flypix has about 61.4 times the visible traffic of Satlas, an absolute difference of about 128.7K visits. This reflects visible reach, not feature quality or paid users.
Both tools provide verified traffic details, so monthly trends, visit depth, regions, and acquisition sources can be compared on the same basis.
If public market visibility is an important first-pass criterion, investigate Flypix first. The final choice should still follow taxonomy, use case, and a real trial because higher traffic does not prove broader capabilities or better workflow fit.
Flypix and Satlas currently overlap in shared categories: マッピング; shared tags: 環境モニタリング、マッピング、衛星画像. This can place both on the same shortlist, but it does not prove equal implementation, depth, or cost.
Flypix's unique categories/tags are 3D、API、地理空間、農業技術、AIモデル学習、建設テック、データ分析、ドローン画像; Satlas's are 地理空間、科学、AI、アレンAI研究所、気候変動、コンピュータビジョン、データ視覚化、地理空間データ. These unique fields are the strongest differentiators: validate the product whose recorded scope matches the task instead of following traffic alone.
Flypix has no verified rating, 0 comments, 124 favorites, and 118 likes;Satlas has no verified rating, 0 comments, 99 favorites, and 102 likes。
Neither product has enough rating or comment samples for a credible reputation ranking.
Put Flypix on the priority trial list when the task aligns with “3D” and especially 3D、API、地理空間、農業技術、AIモデル学習、建設テック. This follows recorded positioning and does not imply unlisted capabilities are absent.
Flypix also currently records: pricing is freemium, product type is website, 130.9K verified monthly visits, no verified user rating. Verify any hard requirement around price, platform, or reach before trial, and do not let sparse review data substitute for testing.
Put Satlas on the priority trial list when the task aligns with “地理空間” and especially 地理空間、科学、AI、アレンAI研究所、気候変動、コンピュータビジョン. This follows recorded positioning and does not imply unlisted capabilities are absent.
Satlas also currently records: pricing is free, product type is website, 2.1K verified monthly visits, no verified user rating. Verify any hard requirement around price, platform, or reach before trial, and do not let sparse review data substitute for testing.
The available data describes positioning, public visibility, and community signals, but it cannot prove output quality, speed, integration effort, privacy, or long-term cost in your workflow. Before deciding, run the same representative tasks in Flypix and Satlas, then record completion time, accuracy, manual corrections, and the real paid threshold. A like-for-like trial turns this comparison into a defensible adoption decision.

Picterraは、ユーザーが衛星やドローンの画像を分析して洞察を抽出できるようにするGeoAIプラットフォームです。オブジェクト検出モデルを構築・展開するためのノーコード環境を提供し、農業、ESG、インフラなどの業界にスケーラブルな環境インテリジェンスを提供します。
環境・社会・ガバナンス
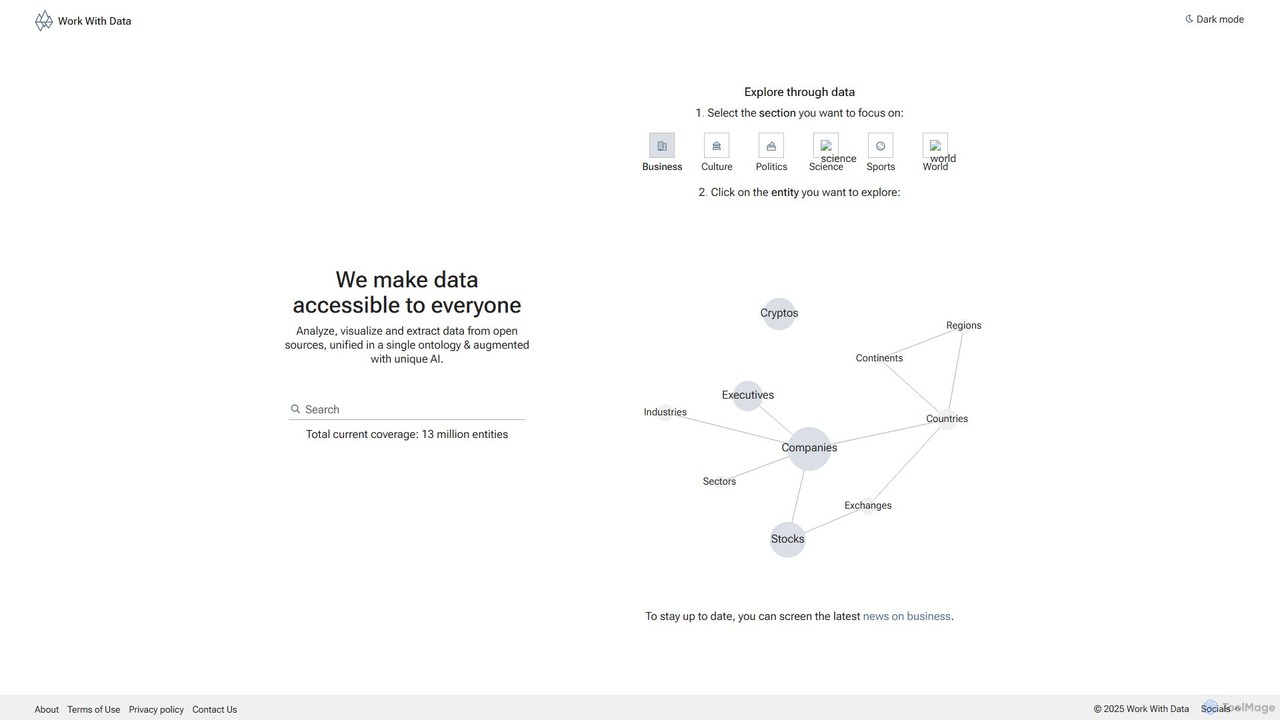
Work With Dataは、誰もがオープンデータにアクセスできるようにするためのAI強化プラットフォームです。ユーザーは多様なオープンソースからデータを分析、視覚化、抽出し、すべてが単一で操作しやすいオントロジーに統合され、独自のAIによって強化されて、より深い洞察と予測を提供します。
3D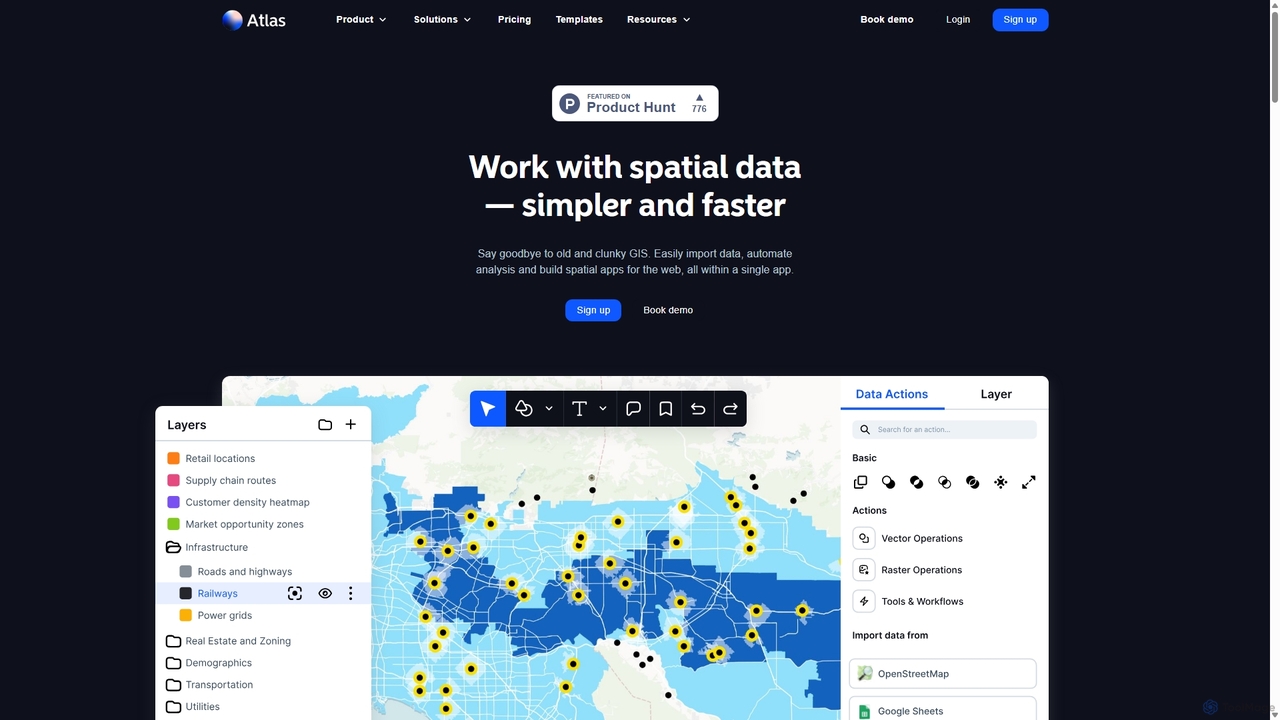
Atlasは、空間データ分析と地図作成を簡素化する、オールインワンのブラウザベースGISプラットフォームです。専門的なGIS知識がなくても、簡単にデータをインポートし、50種類以上の高度な空間分析を実行し、インタラクティブなウェブマップを構築できます。コラボレーション用に設計されており、営業、マーケティング、不動産、環境分析チームがデータを可視化し、トレンドを特定し、位置情報に基づいた意思決定を行うのに最適です。
ビジネスインテリジェンス

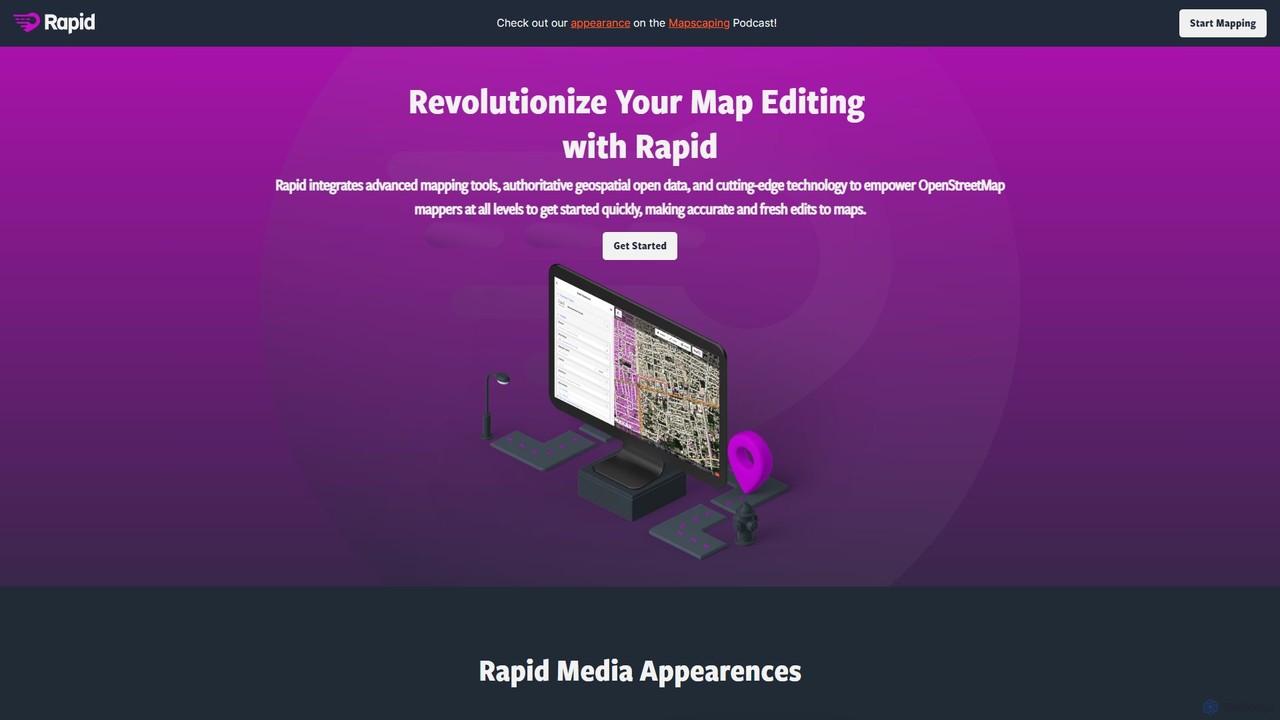
Rapid Editorは、マッピングプロセスを加速し簡素化するために設計された、AI強化型のOpenStreetMap(OSM)エディタです。衛星画像からAIが検出した地物を活用し、オープンデータを統合することで、ユーザーは道路、建物、その他の地理的要素を迅速に追加できます。直感的なインターフェースは、初心者から経験豊富なマッパーまで、特に人道的支援やコミュニティ主導のマッピングプロジェクトに最適です。
地理空間分析
簡単な自然言語の対話を通じて、データを洞察に満ちた視覚化や要約に変換するAI搭載チャットボットです。データセットをアップロードして質問するだけで、即座にチャートやグラフ、主要な指標を受け取ることができ、複雑なソフトウェアやコーディングスキルがなくても誰もがデータ分析を行えます。
ビジネスインテリジェンス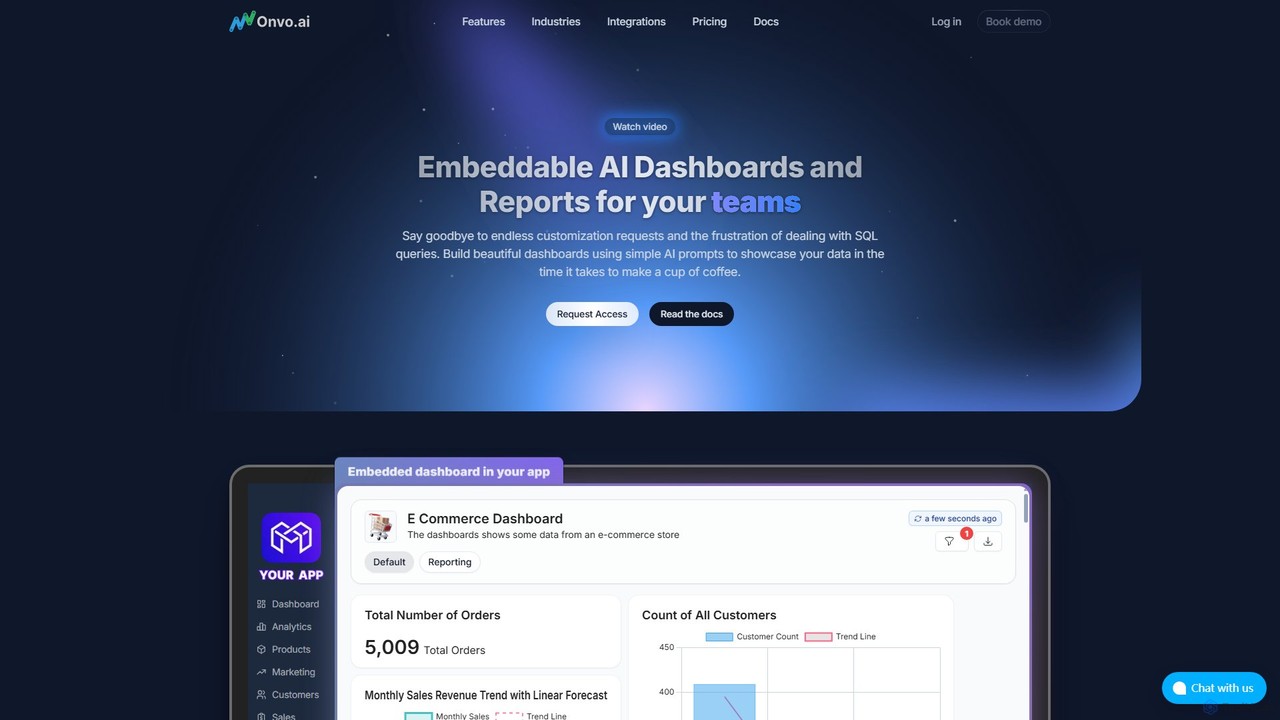
Onvo AIは、AI駆動のダッシュボードとレポートをアプリケーションに直接構築・埋め込みできる強力なプラットフォームです。複雑なSQLクエリを簡単な自然言語プロンプトに置き換え、技術者・非技術者を問わず誰でも簡単に美しいデータ可視化を作成できます。このソリューションは、エンジニアリングリソースを大幅に節約し、チームや顧客に安全なセルフサービス分析機能を提供します。
ビジネスインテリジェンス


Flarelightは、データ分析と可視化のためのAI搭載ノーコード・ビジネスインテリジェンスプラットフォームです。あらゆるソースからデータをインポートし、視覚的に準備し、詳細な分析を行い、インタラクティブなレポートを作成できます。このオールインワンツールはクラウドとオンプレミスの両方のデプロイをサポートし、ワークフローの自動化と自然言語設定により、複雑なデータを実用的な意思決定に変えます。
ノーコード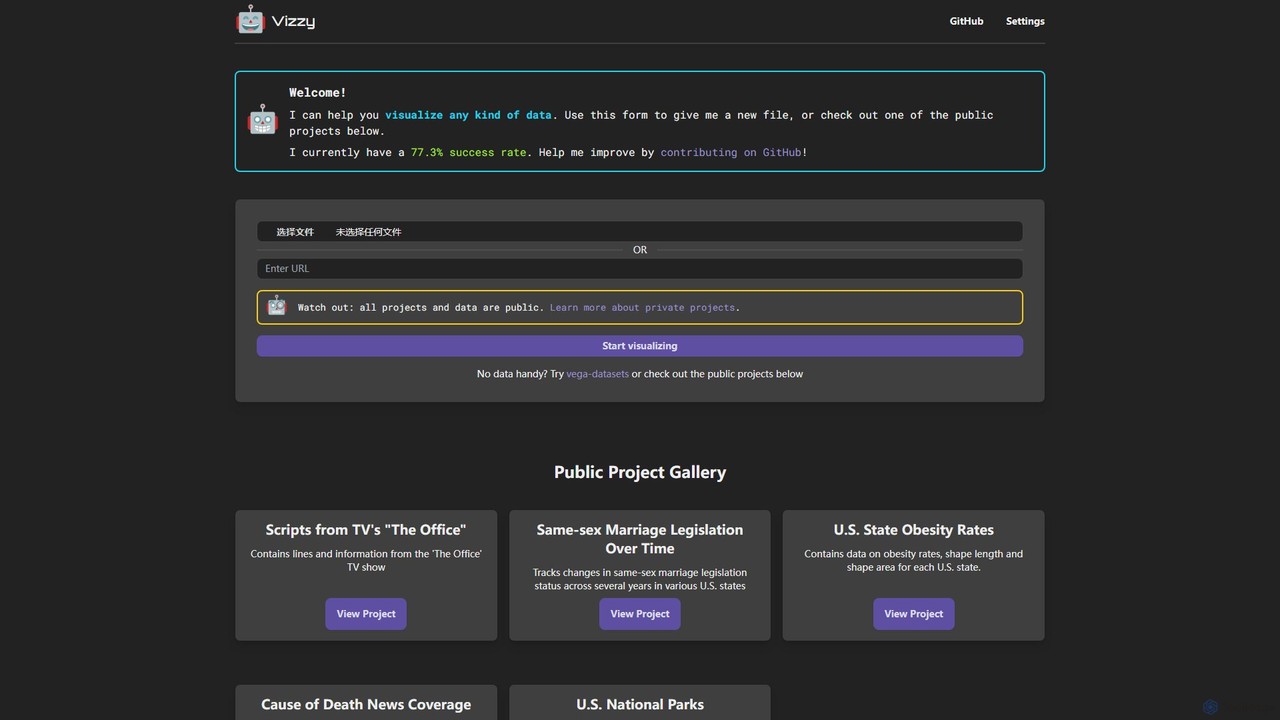
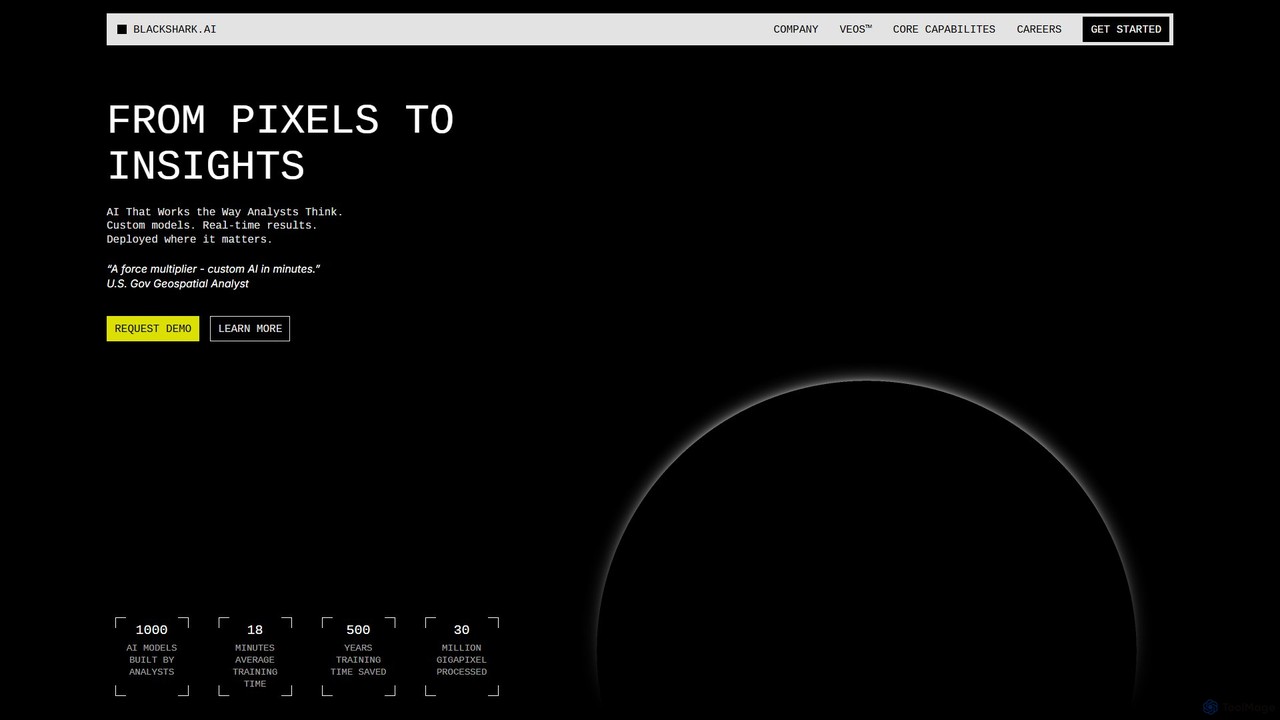
blackshark.aiは、衛星、航空、ドローンの画像を実用的な2D/3D地理空間情報とリアルなシミュレーションに変換する、AI搭載のビジュアルアースオペレーティングシステム(VEOS)です。分析官が検出、分類、監視のためのカスタムAIモデルを迅速にトレーニングできるようにし、防衛、インフラ、自律性の分野に前例のない速度と柔軟性を提供します。
シミュレーション