
ToolMage
Sign in

Best 1 Automated Reporting AI tools for Reporting

Popular Automated Reporting AI tools in Reporting include NexDatawork, helping you work more efficiently.

NexDatawork
Freemium

NexDatawork

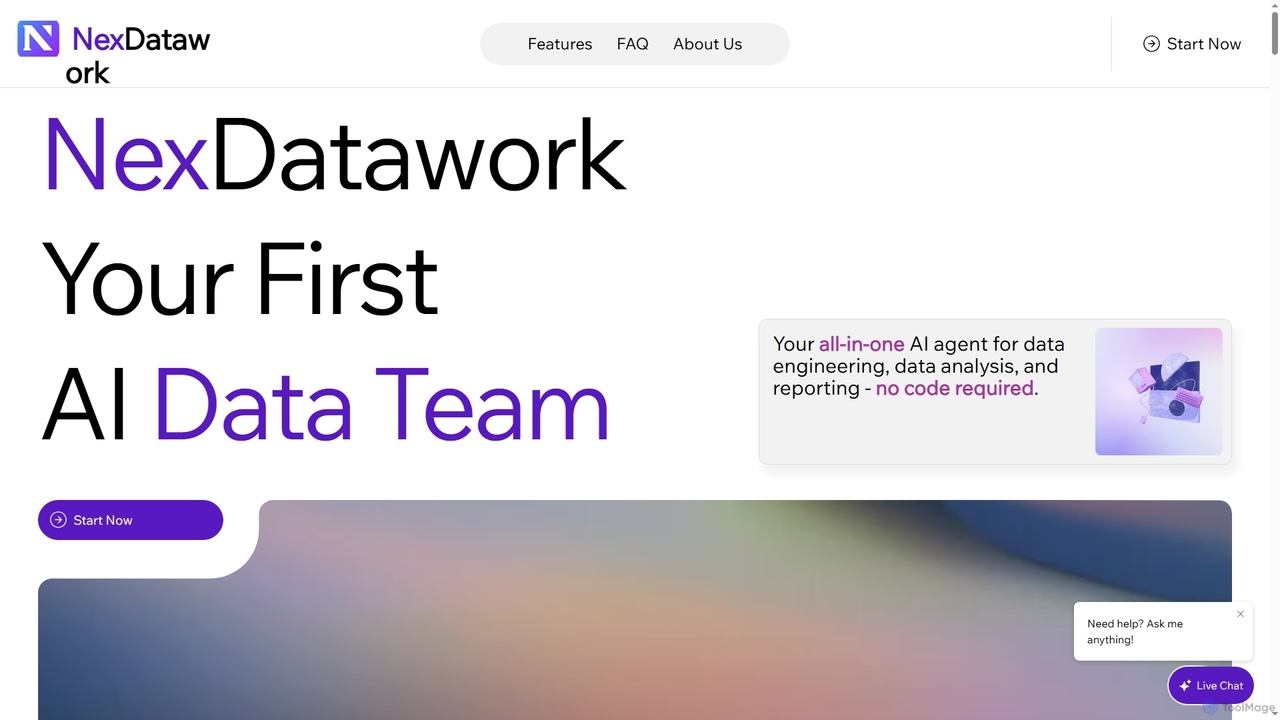
NexDatawork is an all-in-one AI data agent designed for data engineering, analysis, and reporting, requiring no code. It transforms raw data into actionable insights, automates workflows, and generates comprehensive reports, empowering individuals and teams to make data-driven decisions faster and more efficiently.

Business Intelligence
Visits 4.5KFavorites 148Likes 148

About Automated Reporting

Automated Reporting tools are a class of AI-powered software designed to automatically collect data, generate reports, and distribute them on a predefined schedule. These tools leverage APIs to connect with various data sources, compiling information into visual dashboards and structured documents without manual intervention. Their primary value lies in saving significant time, reducing human error, and ensuring stakeholders receive consistent, timely insights for decision-making. Many advanced tools also use AI to detect anomalies and generate natural language summaries of key findings.

Core Features

  • Scheduled Distribution: Automatically send reports via email, Slack, or other channels on a daily, weekly, or monthly basis.
  • Multi-Source Data Integration: Connect and pull data from diverse platforms like CRMs, analytics tools, databases, and spreadsheets.
  • Customizable Templates: Design and save report templates that are automatically populated with the latest data for each cycle.
  • AI-Powered Insights: Utilize machine learning to identify trends, detect anomalies, and generate plain-language summaries of report data.
  • Interactive Dashboards: Provide live, auto-updating dashboards that allow users to filter and explore data in real-time.

Use Cases

These tools are essential for roles that require regular monitoring and reporting, such as marketing managers tracking campaign performance, sales directors monitoring team KPIs, and financial analysts preparing monthly statements. Industries like e-commerce, SaaS, and digital marketing agencies rely heavily on automated reporting to maintain operational efficiency and provide consistent client updates.

How to Choose

When selecting an Automated Reporting tool, first evaluate its data source integration capabilities to ensure it connects to your existing tech stack. Consider the level of customization available for reports and dashboards. Assess its distribution options and scheduling flexibility. Finally, determine the sophistication of its analytical features—whether you need simple data aggregation or advanced AI-driven insights and anomaly detection.

Featured tool rankings

Automated Reporting use cases

1

Automate Weekly Marketing Campaign Reports

A marketing manager needs to track the performance of multiple campaigns across Google Ads, Facebook, and LinkedIn. Instead of manually exporting CSVs and building spreadsheets each week, they use an automated reporting tool. The tool connects to all ad platforms, pulls key metrics (like CPC, CTR, conversions), and generates a consolidated performance report. This report is automatically emailed to the entire marketing team and CMO every Monday morning, saving hours of manual work and enabling faster strategic adjustments.

2

Automate Weekly Marketing Performance Reviews

A marketing manager needs to report on campaign performance across Google Ads, Facebook, and SEO channels every Monday. Instead of spending hours manually exporting and compiling data, they use an automated reporting tool. They set up a single dashboard that connects to all three platforms, defines key metrics like CPC, CTR, and conversions, and schedules an email delivery of the PDF report to all stakeholders every Monday at 9 AM. This frees up the team to focus on analyzing insights and planning strategy rather than on data collection.

3

Monitor Daily Sales KPIs for Leadership

A sales director needs to provide the executive team with a daily snapshot of key sales metrics from Salesforce, including new leads, conversion rates, and revenue by region. They configure an automated report to pull this data at 7 AM each day. The tool generates a concise, one-page summary with visualizations and AI-generated highlights, such as 'North America region saw a 15% increase in conversions yesterday.' This report is automatically delivered to the leadership team's inboxes, ensuring they start their day with consistent and timely data for strategic decisions.

4

Generate Daily E-commerce Sales Summaries

An e-commerce store owner wants a daily snapshot of sales performance without logging into multiple systems like Shopify and Google Analytics. They set up an automated report that pulls data from both sources. Every morning at 8 AM, a report is delivered to their inbox showing total revenue, top-selling products, conversion rates, and traffic sources from the previous day. This allows for quick identification of trends and proactive inventory management.

5

Generate Client Reports for Digital Agencies

An account manager at a digital marketing agency handles ten clients, each requiring a monthly performance report. Creating these manually is time-consuming and prone to errors. By using an automated reporting tool, the manager creates a single white-labeled template. The tool then automatically pulls data for each specific client from their respective ad accounts and analytics, populates the template, and schedules the reports to be sent to each client on the first day of the month. This ensures professional, consistent, and timely communication, enhancing client trust and retention.

6

Streamline Monthly Financial Reporting

A finance department spends the first week of every month manually compiling financial data from accounting software, CRM, and expense platforms to create P&L statements. By implementing an automated reporting tool, they connect these sources once. Now, on the first day of the month, the tool automatically generates the P&L, balance sheet, and cash flow statements using a predefined template. This reduces the closing process by days and minimizes the risk of data entry errors.

7

Monitor Sales Team Performance in Real-Time

A sales director needs a constant view of their team's pipeline and performance against quotas. Instead of asking for manual updates, they use an automated reporting tool connected to their CRM (e.g., Salesforce). The tool powers a live dashboard displaying deals won, pipeline value, and individual rep performance, which updates automatically. Additionally, a weekly summary report is automatically sent to each sales rep, highlighting their progress and key activities, fostering transparency and motivation.

8

Automate Monthly Financial Statements

A financial analyst in a mid-sized company is responsible for creating monthly Profit & Loss (P&L) statements and cash flow reports for management. This process involves consolidating data from accounting software like QuickBooks and various spreadsheets. They implement an automated reporting tool that connects directly to these sources. The tool is configured to run on the third day of each month, generating the P&L and cash flow statements in a standardized format. This reduces the manual workload by over 80% and minimizes the risk of data entry errors, allowing the analyst to focus on variance analysis and strategic financial planning.

9

Track SaaS Product Usage Metrics

A product manager for a SaaS company needs to monitor key metrics like Daily Active Users (DAU), feature adoption, and churn rate. They use an automated reporting tool integrated with their product analytics platform (e.g., Mixpanel). The tool is configured to generate a weekly report that visualizes user engagement trends and highlights significant changes. It also sends an immediate alert to the product team's Slack channel if a critical metric, like user sign-ups, drops below a certain threshold, enabling rapid investigation.

10

Track E-commerce Sales and Inventory in Real-Time

An e-commerce manager for an online fashion store needs to monitor daily sales performance and inventory levels for top-selling items. They use an automated reporting tool connected to their Shopify store and inventory management system. They set up a live dashboard showing real-time sales data. Additionally, they configure automated alerts: an email is sent if a best-seller's stock drops below 50 units, and a Slack notification is triggered if daily sales exceed the previous day's total by 20%. This proactive system helps prevent stockouts and allows for quick reactions to sales trends.

11

Monitor SaaS Product Engagement Metrics

A product manager at a SaaS company needs to track key engagement metrics like Daily Active Users (DAU), feature adoption rates, and user churn indicators from platforms like Mixpanel. They set up an automated report that pulls this data into a weekly 'Product Health' dashboard. The report is scheduled to refresh every Monday morning. The AI feature of the tool automatically highlights significant changes, such as 'Adoption of the new calendar feature dropped by 30% this week,' allowing the product team to investigate issues proactively without having to manually sift through raw data.

12

Automate IT System Health and Performance Checks

An IT operations team is responsible for maintaining server uptime and application performance. They use an automated reporting tool to aggregate data from various monitoring systems (like Datadog or New Relic). The tool generates an hourly health check report summarizing CPU usage, memory, and response times, which is displayed on a central dashboard. If any metric exceeds a critical threshold, an automated alert with detailed logs is sent directly to the on-call engineer's PagerDuty, ensuring immediate response to potential issues.

Automated Reporting FAQ

What are Automated Reporting tools?

Automated Reporting tools are software applications that automatically collect data from various sources, compile it into reports or dashboards, and distribute them on a schedule. Instead of manually exporting data and building reports, you set up the tool once to connect to your data sources (like Google Analytics, Salesforce, or a database), define your metrics, and choose a schedule. The tool then handles the entire process, ensuring timely and consistent reporting without ongoing manual effort.

What is Automated Reporting?

Automated Reporting is the process of using software to automatically collect, analyze, and distribute data reports on a predefined schedule. Instead of manually gathering data from different sources, these tools connect directly to them, run analyses, and send the finished reports to stakeholders via email or other channels. The primary benefits are significant time savings, increased accuracy by reducing human error, and consistent delivery of timely insights for better decision-making.

How do Automated Reporting tools differ from Business Intelligence (BI) tools?

While there is overlap, they serve different primary purposes. Automated Reporting tools excel at the scheduled generation and distribution of standardized, recurring reports (e.g., weekly sales summaries). Their focus is on efficiency and consistency for routine tasks. Business Intelligence (BI) tools are broader platforms designed for deep, ad-hoc data exploration, complex analysis, and interactive visualizations. BI is for answering complex, evolving business questions, while automated reporting is for reliably delivering predefined KPIs.

How do Automated Reporting tools differ from standard BI tools?

While there is overlap, the primary difference is focus. Automated Reporting tools excel at the scheduled generation and distribution of static or predefined reports. Their goal is to deliver consistent information efficiently. Standard Business Intelligence (BI) tools (like Tableau or Power BI) are more focused on deep, interactive data exploration and ad-hoc analysis. While BI tools can automate reports, their core strength is allowing users to dynamically slice, dice, and visualize data to uncover new insights, whereas automated reporting tools are built for the 'set it and forget it' workflow.

What data sources can be connected to Automated Reporting tools?

Most automated reporting tools offer a wide range of connectors. Common data sources include:

  • Databases: SQL databases like MySQL, PostgreSQL, and Microsoft SQL Server, as well as NoSQL databases.
  • Cloud Services: Google Analytics, Google Ads, Facebook Ads, and other marketing platforms.
  • CRMs and Sales Tools: Salesforce, HubSpot, and other customer relationship management systems.
  • Spreadsheets: Google Sheets and Microsoft Excel files stored in the cloud.
  • APIs: Custom connections to proprietary software or other web services.
What are the main benefits of using Automated Reporting?

The primary benefits of automating your reporting process are:

  • Time Savings: It eliminates countless hours of manual data collection, consolidation, and formatting, freeing up your team for more strategic tasks.
  • Increased Accuracy: Automation removes the risk of human error from copying and pasting data or manual calculations, leading to more reliable reports.
  • Consistency: Reports are generated in the same format and delivered on the same schedule every time, ensuring stakeholders receive predictable and easy-to-compare information.
  • Timeliness: Data is delivered to decision-makers without delay, enabling faster and more informed responses to business trends.
Who should use Automated Reporting tools?

These tools are valuable for any role or department that relies on regular data reporting. Key users include:

  • Marketing Teams: To track campaign performance, website traffic, and lead generation.
  • Sales Managers: To monitor sales pipelines, team performance, and quota attainment.
  • Financial Analysts: To generate monthly P&L statements, budget reports, and expense summaries.
  • Operations Managers: To track key performance indicators (KPIs) related to production, logistics, or service delivery.
  • Business Owners: To get a consistent, high-level overview of business health without manual effort.
What data sources can these tools connect to?

Automated Reporting tools can connect to a wide range of data sources via APIs or direct integrations. Common categories include:

  • Marketing & Analytics: Google Analytics, Google Ads, Facebook Ads, LinkedIn Ads.
  • CRM & Sales: Salesforce, HubSpot, Pipedrive.
  • Databases: MySQL, PostgreSQL, Google BigQuery.
  • Spreadsheets & Files: Google Sheets, Microsoft Excel, CSV files.
  • E-commerce Platforms: Shopify, WooCommerce.
  • Before choosing a tool, it's crucial to verify that it supports the specific platforms that are critical to your business operations.

How to choose the right Automated Reporting tool?

To select the best tool for your needs, consider these factors:

  • Data Connectors: Does it integrate seamlessly with all your critical data sources? This is the most important factor.
  • Customization & Flexibility: Can you build reports and dashboards that match your specific KPI and branding requirements?
  • Ease of Use: Is the interface intuitive for non-technical users, or does it require specialized skills to set up and manage reports?
  • Distribution Options: Does it support your preferred delivery channels, such as email, Slack, or embedding into other platforms?
  • Scalability & Price: Does the pricing model fit your budget and can it scale with your company's growth in terms of data volume and number of users?
What are the key factors when choosing an Automated Reporting tool?

When selecting a tool, consider these four critical factors:

  1. Data Connectivity: Ensure the tool has reliable, pre-built connectors for all your essential data sources (e.g., your specific CRM, ad platforms, databases).
  2. Scheduling and Distribution Flexibility: Check if you can customize the report frequency, timing, and delivery channels (e.g., email, Slack, PDF, embedded dashboards) to match your team's workflow.
  3. Customization and Ease of Use: Evaluate how easy it is to build and modify reports. A good tool should offer a balance between powerful customization options and an intuitive user interface.
  4. Security and Scalability: Verify that the tool meets your organization's data security standards and can handle increasing data volumes and user numbers as your business grows.