adaapt
Business Intelligence
AI TOOL COMPARISON
What is the difference, and which fits your workflow? Compare features, usage, pricing models and traffic side by side.
Business Intelligence
Business Intelligence
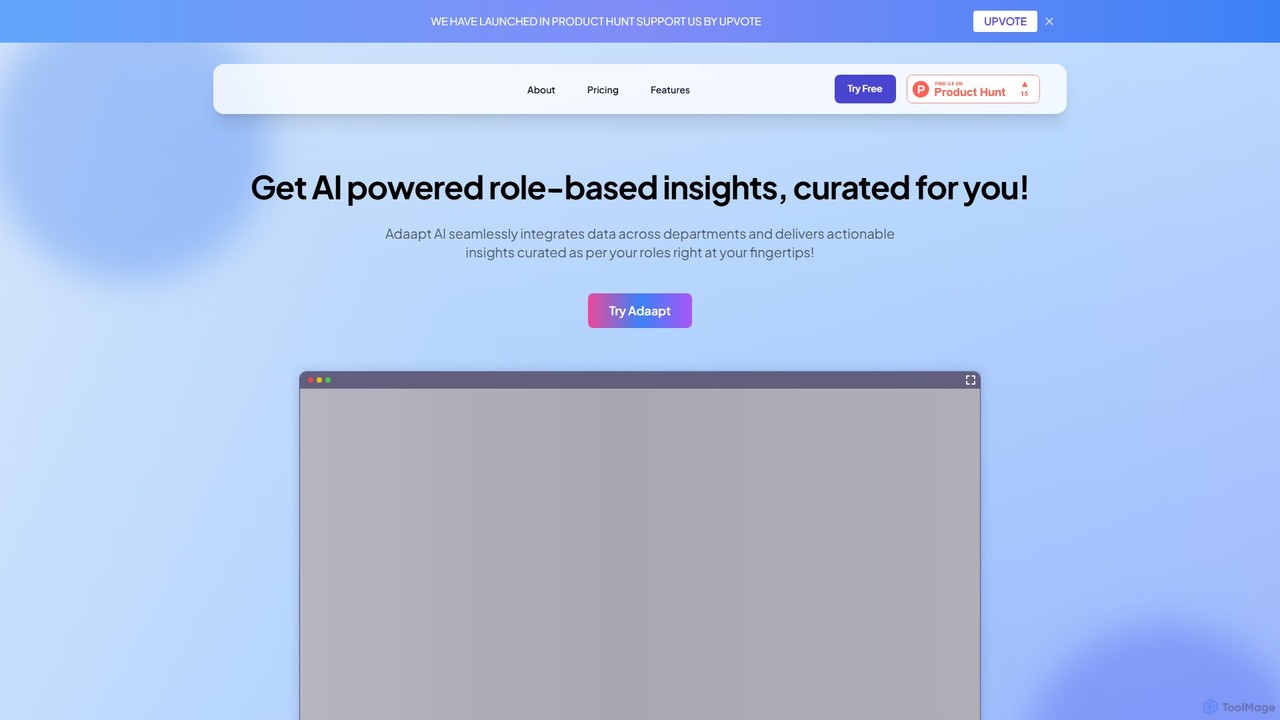
Adaapt is an AI-powered enterprise platform that integrates data from multiple sources to deliver actionable, role-based insights. It offers no-code data integration, generative AI for querying, machine learning for predictive analytics, and workflow automation to enhance productivity, streamline decision-making, and drive business growth across various departments.
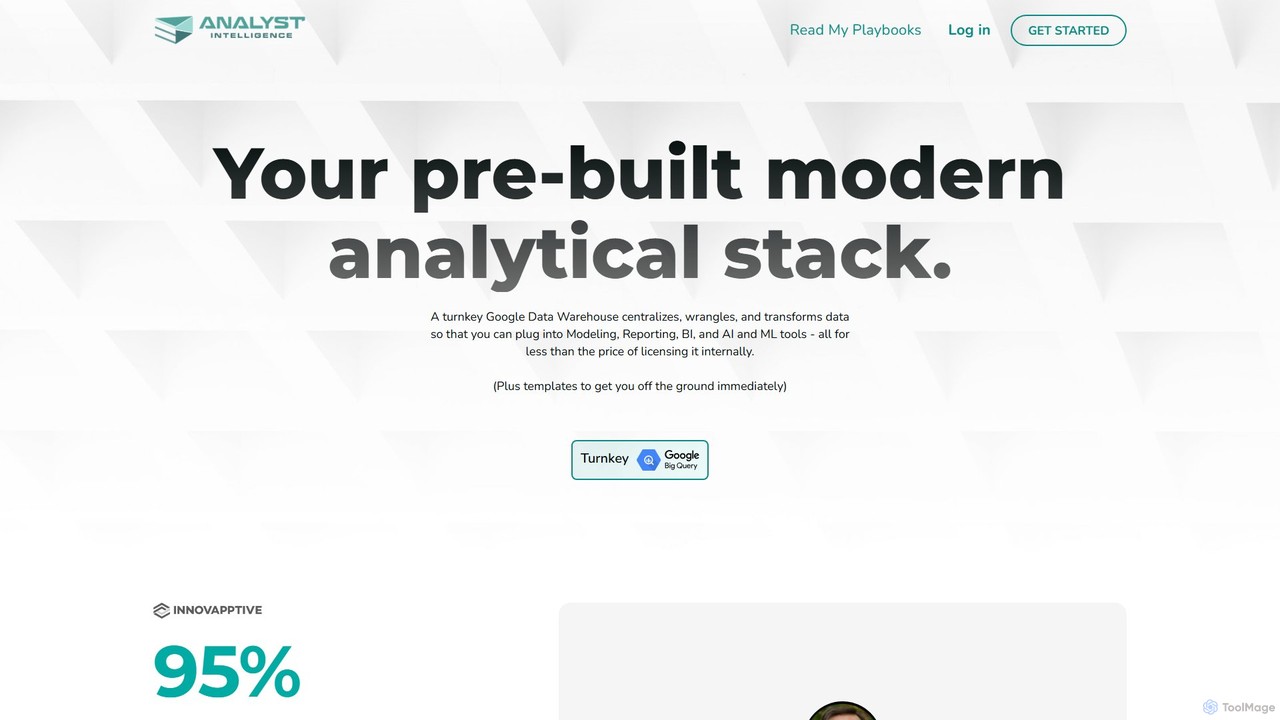
Analyst Intelligence is an AI-powered data analytics platform built on Google Cloud, designed for FP&A, Rev Ops, and BI teams. It simplifies data consolidation, cleaning, and analysis through a no-code interface and AI-assisted SQL. The platform centralizes data in a secure Google BigQuery warehouse, enabling advanced forecasting, automated reporting, and seamless integration with tools like Google Sheets, without requiring engineering resources.
Compare product focus, pricing models and audiences. Highlighted rows indicate different listed information; unknown pricing does not mean free.
| Quick facts | adaapt | Analyst Intelligence |
|---|---|---|
| Pricing model | Freemium | Freemium |
| Product type | Web | Web |
| Primary focus | Business Intelligence | Business Intelligence |
| Audience and roles | No data available | No data available |
| Categories | Business Intelligence · Analytics · No Code · Automation | Business Intelligence · No Code · Data Analysis · Automation |
| Added | Aug 10, 2025 | Aug 12, 2025 |
| Updated | Nov 19, 2026 | Nov 19, 2026 |
Explore the listed product descriptions, features and workflows. Taxonomy labels alone are not feature evaluations.
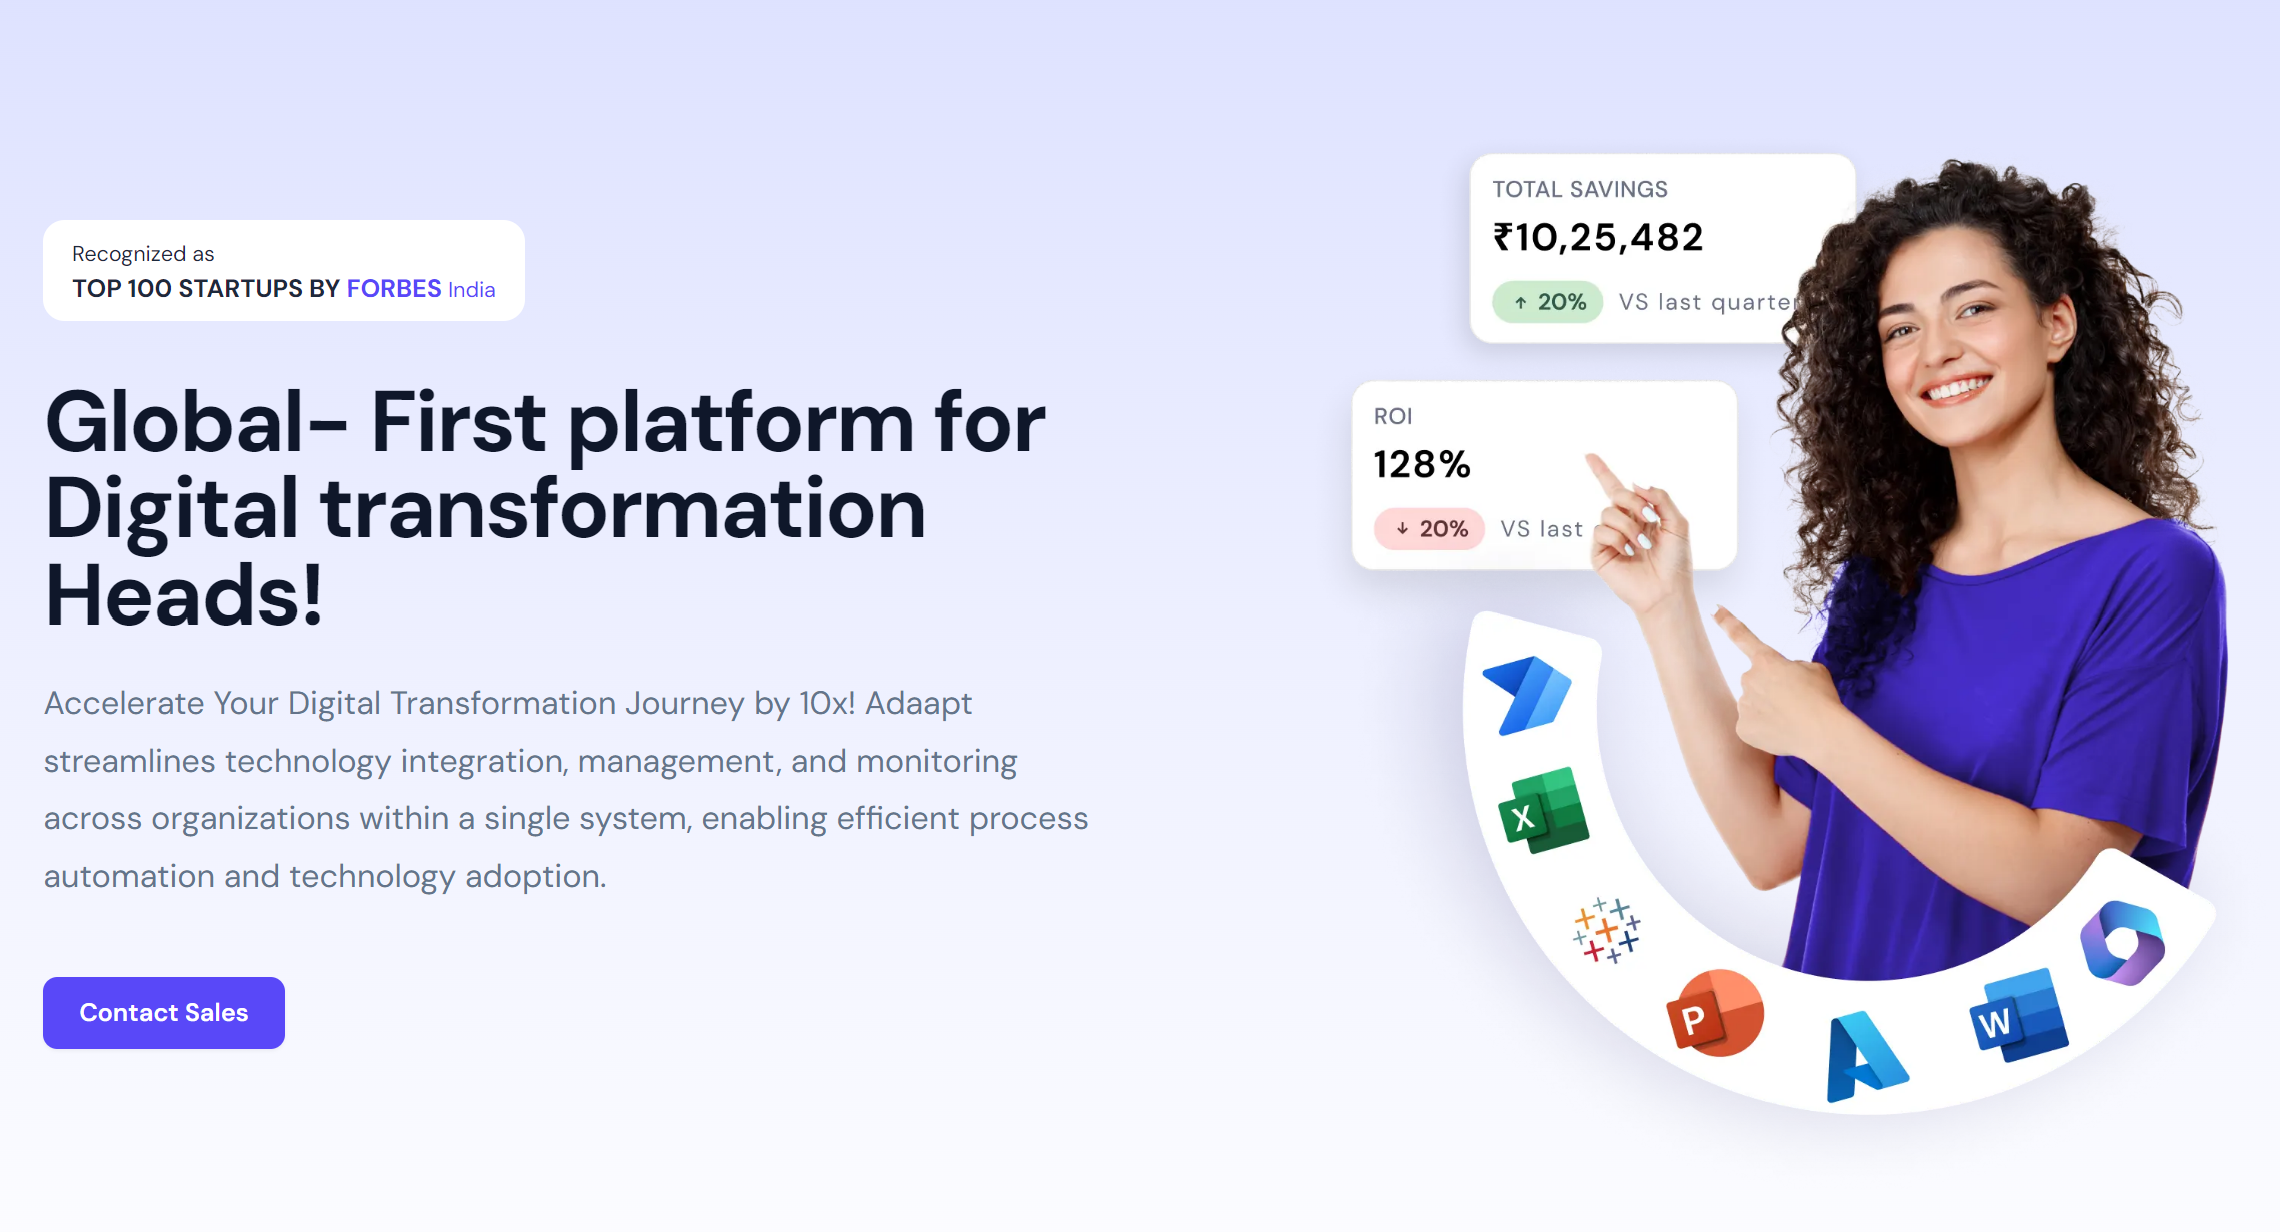
Adaapt is a comprehensive, AI-first enterprise data platform designed to transform how organizations access, interpret, and act on their data. Founded in 2020, Adaapt's mission is to provide a seamless, no-code solution that connects disparate databases and systems, empowering every team member with instant, role-specific insights. The platform leverages a powerful combination of data integration, machine learning, and generative AI to turn raw data into a strategic asset. It enables businesses to automate complex workflows, monitor key performance indicators in real-time, and make informed decisions with confidence and agility. By unifying data and providing a collaborative, self-service analytics environment, Adaapt helps enterprises increase efficiency, reduce operational costs, and maintain a competitive edge in a rapidly evolving technological landscape.
Using Adaapt is a streamlined process designed for both technical and non-technical users. The journey begins with data integration. Users can connect to over 250 data sources, including databases, cloud applications, and knowledge centers, using the platform's no-code connectors. Once data is integrated, users can interact with it through a generative AI-powered interface. This allows them to search for information, ask complex questions in natural language, and receive immediate insights without writing any code. The next step involves personalizing the experience by setting up role-based dashboards and custom Key Performance Indicators (KPIs). This ensures that teams in finance, sales, logistics, and other departments see the data that is most relevant to their functions. Finally, users can leverage the platform's workflow automation capabilities to streamline business processes, set up alerts for anomalies or SLA breaches, and build custom business applications, all within a unified, collaborative environment.
Adaapt is a versatile platform with proven success across various industries:
Healthcare: As demonstrated with Apollo Hospitals, Adaapt helps optimize operations across multiple branches. It enables real-time monitoring of patient care metrics, predictive analytics for resource allocation, and streamlined data management, resulting in significantly reduced decision time and improved patient outcomes.
Logistics: For companies like Driver Logistics, the platform transforms route planning and fleet management. Its AI-driven route optimization cuts fuel costs and delivery times, while predictive maintenance models reduce vehicle downtime, and real-time dashboards provide complete fleet visibility.
Insurance & Finance: In the insurance sector, exemplified by Universal Sompo, Adaapt's machine learning models excel at real-time fraud detection and claims processing. It analyzes vast datasets to identify suspicious patterns, automates risk assessment, and accelerates the entire claims lifecycle, improving both accuracy and customer satisfaction.
General Business Operations: Any organization can use Adaapt to enhance process efficiency, such as streamlining purchase order processing, automating document management, and providing leaders with centralized, AI-powered insights for strategic planning.
Adaapt offers a distinct competitive advantage through its holistic and user-centric approach. Its primary benefit is the democratization of data, making powerful analytics accessible via a no-code, self-service platform. This significantly reduces training costs and accelerates employee onboarding. By providing centralized, AI-powered insights, it empowers leaders to make faster, more strategic decisions, giving the business a competitive edge. The platform's ability to seamlessly integrate with existing systems and automate workflows across all platforms eliminates data silos, reduces manual errors, and achieves peak operational efficiency. This leads to tangible business outcomes, including improved revenue through faster deal closures, reduced customer churn, and significant cost reductions in operations.
Adaapt offers a flexible pricing structure to accommodate teams of all sizes, with options for monthly or yearly billing.
Basic (Free Trial): This plan is ideal for individuals or small teams starting out. It includes 100 credits per month, up to 5 queries per day, real-time analytics, 100 alerts integrations, mail support, 1 user login, and 1 developer login.
Standard: Designed for growing teams, this plan requires contacting sales for a custom quote. It includes over 500 credits upon signup, real-time analytics, 500+ alerts integrations, chat support, and options for custom AI model training and support.
Premium: The most comprehensive plan for large enterprises, also available by contacting sales. It offers 750+ free credits on signup, 1000+ alerts integrations, a dedicated customer manager, custom AI training, additional security features, predictive analytics, and real-time anomaly detection.
Analyst Intelligence is a sophisticated data analytics notebook platform, purpose-built on the Google Cloud Platform to empower finance and operations teams. It serves as a centralized hub for getting, cleaning, transforming, and analyzing data, fundamentally changing how teams in FP&A (Financial Planning & Analysis), Rev Ops (Revenue Operations), and BI (Business Intelligence) approach their workflows. The platform's core philosophy is to make advanced data analysis accessible to non-developers by providing a powerful, yet user-friendly, operations platform.
At its heart, Analyst Intelligence provides each client with their own secure and isolated Google BigQuery Data Warehouse. This solves a critical problem for finance teams who handle confidential information like salaries and financial plans, which cannot reside in a general IT data warehouse. By consolidating data from disparate sources—such as accounting systems, CRMs (like Salesforce), HR platforms, and spreadsheets—into this single source of truth, the platform drastically enhances data accuracy and reliability.
The platform is infused with artificial intelligence, most notably through its integration with Google's Vertex AI. This allows users to leverage cutting-edge machine learning models for tasks like forecasting and prediction without writing a single line of code. A standout feature is the AI-powered SQL assistant, which enables analysts to perform complex data cleaning and analysis by describing their needs in natural language, which the AI then translates into efficient SQL code. This significantly reduces the time spent on data wrangling, allowing teams to focus on generating valuable insights.
Getting started with Analyst Intelligence is designed to be quick and straightforward, with most users automating significant parts of their workload within the first day.
1. Request Access & Onboarding: Begin by requesting credentials. New users receive a complimentary onboarding session where the support team helps automate their first process, ensuring immediate value.
2. Connect Data Sources: With one-click integrations, you can connect to all your essential data sources. For example, connect to Salesforce once to import bookings data. This data is then stored in your centralized data warehouse and can be reused across countless applications (BI, planning, ad hoc reports) without re-establishing connections.
3. Transform and Analyze: Utilize the platform's code-optional notebooks. Non-technical users can leverage the no-code interface and AI assistants to clean data, calculate KPIs, and build analyses. For those comfortable with code, SQL transformations are fully supported.
4. Leverage AI and Machine Learning: Use the integrated AI to generate forecasts (e.g., headcount forecasting), perform cohort analysis, build revenue waterfalls, and run predictive models. The AI assists with documentation, error fixing, and complex analytical queries.
5. Visualize and Report: Create interactive dashboards using the no-code BI tool or connect the cleaned, centralized data back to your favorite spreadsheet tools like Google Sheets. This allows you to maintain your existing reporting workflows but backs them with a powerful, reliable database.
FP&A Teams: Consolidate actuals from accounting, CRM, and HR systems to feed 3-statement financial models. Automate variance analysis and P&L forecasting. Perform complex headcount and expense planning.
Revenue Operations (Rev Ops): Analyze the entire revenue lifecycle, from pipeline analysis and win-rate calculations to creating detailed revenue waterfalls and cohort analyses.
Business Intelligence (BI): Establish a single source of truth for all company metrics. Build comprehensive, automated dashboards for leadership and departmental reporting, eliminating manual data pulls.
Small Companies & Startups: Instantly gain access to a wide range of analytical insights through turnkey reporting templates, even without a dedicated analyst team. The 'Decision Science-as-a-Service' plan provides expert support for those needing it.
Democratizes Data Analysis: Empowers non-technical users with tools previously reserved for engineers and data scientists.
Eliminates Data Silos: Creates a single, reliable source of truth by centralizing data, which improves accuracy and decision-making.
Radical Efficiency: Automates tedious, manual data preparation and reporting tasks, freeing up teams to focus on strategic analysis.
Full Data Ownership: Your data resides in your own Google Cloud project. The platform makes it easy to access and use your data anywhere, preventing vendor lock-in.
Scalable and Affordable: Designed for teams of all sizes, with transparent pricing and a commitment to keeping costs down as your organization grows.
Analyst Intelligence offers flexible pricing and guarantees success with a 'try before you buy' approach, including a FREE PILOT with no credit card required.
Small Business: Ideal for executives or individual contributors with simple use cases and smaller data sizes. Includes features like headcount forecasting, spreadsheet plugins, data consolidation, and no-code dashboards.
Complete Platform: Designed for analysts and operators in FP&A, Rev Ops, and BI. Includes all Small Business features plus a dedicated Google BigQuery Data Warehouse, extensive integrations, no-code workflow automation, AI data analysis, SQL transformations, and advanced forecasting.
Decision Science-as-a-Service: A premium offering for teams that need hands-on support. Includes the Complete Platform plus white-glove onboarding, managed data pipelines, custom analysis, scenario modeling, and dedicated cell phone support.
For a detailed quote, prospective customers are encouraged to contact the sales team to design a package tailored to their specific data sizes, required apps, and support level.
Their taxonomy shows where the products overlap and where each one has a more distinct focus. Unknown fields are shown explicitly and are never filled with assumptions.
Traffic is shown on the same scale so differences in market visibility are not visually understated.
Both charts share the same months and vertical scale. Each tool identifies its latest reporting month; missing months are left blank, not counted as zero. Regional and source visit counts are estimates calculated from the reported shares.
| Country/region | Percentage | Estimated visits |
|---|---|---|
| 🇮🇳India | 100% | 1.1K |
| Country/region | Percentage | Estimated visits |
|---|---|---|
| 🇮🇳India | 92.66% | 425 |
| 🇧🇷Brazil | 7.34% | 34 |
Ratings, comments, favorites, and likes are community signals—not a substitute for product fit.
This page is assembled from ToolMage product listings, taxonomy, traffic statistics and on-site user feedback. It is not a hands-on test or an independent review.