ToolMage
Sign in

AI TOOL COMPARISON

Buster vs QueryX

What is the difference, and which fits your workflow? Compare features, usage, pricing models and traffic side by side.

Jump to key differences

Product overview

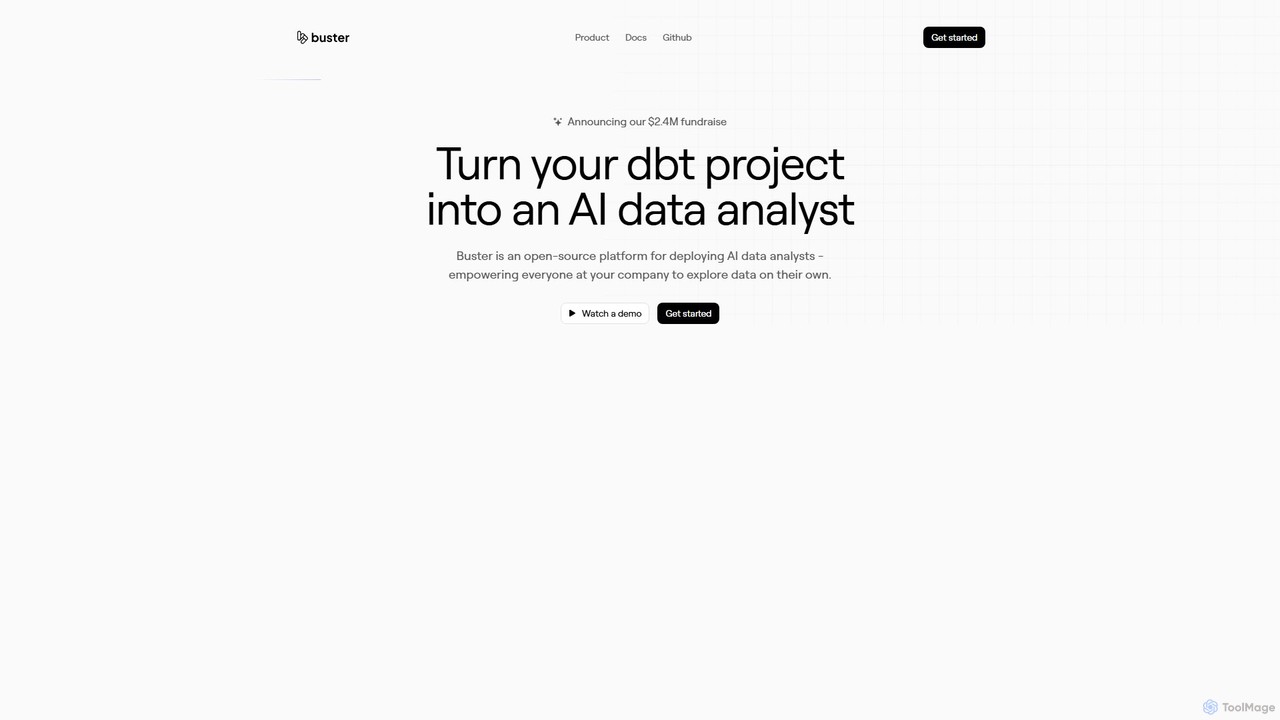
Buster Product overview

Buster is an open-source AI data analyst platform that empowers everyone in a company to explore data using plain English. It integrates with dbt projects, allowing business users to ask questions, generate visualizations, and build dashboards without writing code, while freeing up data teams from ad-hoc requests.

Preview

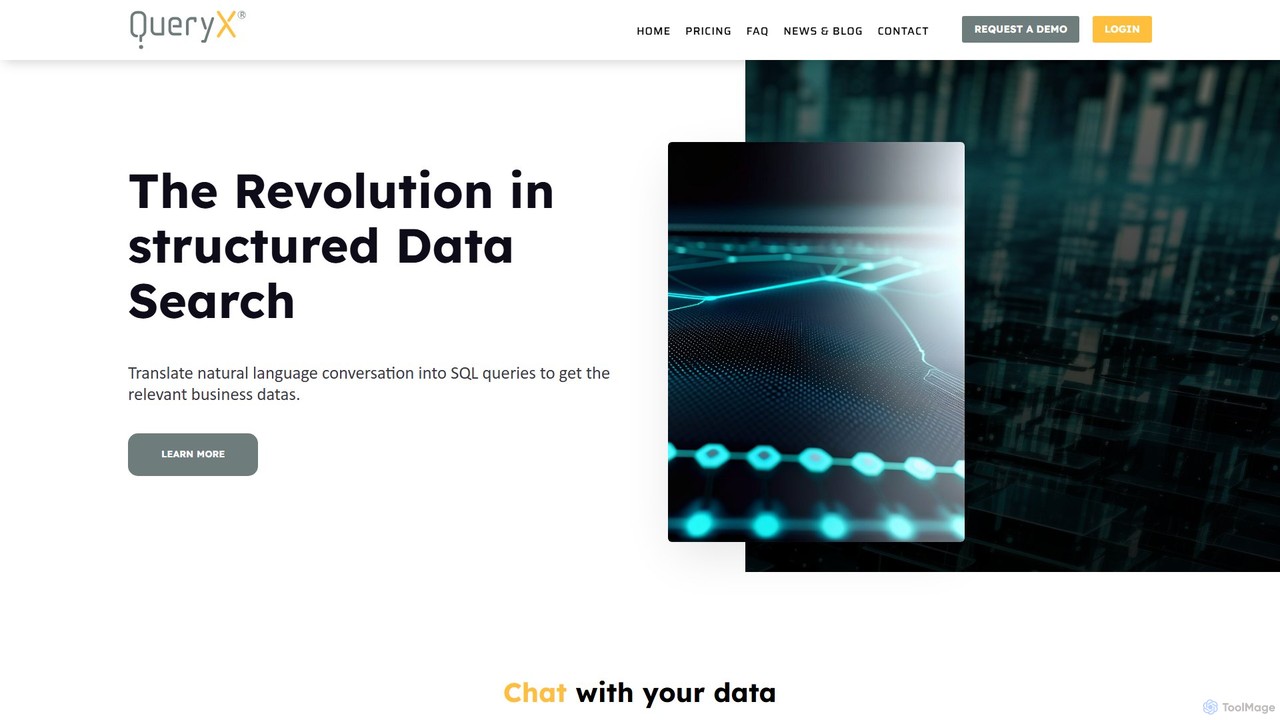
QueryX Product overview

QueryX is an AI-powered platform that translates natural language conversations, including voice commands, into complex SQL queries. It enables both technical and non-technical users to interact with structured databases effortlessly, accelerating data analysis and decision-making while ensuring data confidentiality and high accuracy.

Preview

Quick facts

Compare product focus, pricing models and audiences. Highlighted rows indicate different listed information; unknown pricing does not mean free.

Buster VS QueryX — Quick facts
Quick factsBusterQueryX
Pricing modelFreemiumFreemium
Product typeWebWeb
Primary focusBusiness IntelligenceBusiness Intelligence
Audience and rolesNo data availableNo data available
CategoriesBusiness Intelligence · Data Analysis · Database · AutomationBusiness Intelligence · Data Analysis · Database · No Code
AddedAug 11, 2025Aug 2, 2025
UpdatedNov 19, 2026Nov 19, 2026

Features, usage and use cases

Explore the listed product descriptions, features and workflows. Taxonomy labels alone are not feature evaluations.

Buster

Buster is an innovative, open-source platform designed to function as an AI data analyst, democratizing data access across an organization. It addresses the common bottleneck where data teams are overwhelmed with ad-hoc requests from business stakeholders. By turning a company's dbt project into an interactive AI analyst, Buster empowers non-technical users to independently query data, generate insights, and make faster, more informed decisions.

Backed by prominent investors like Y Combinator and General Catalyst, Buster is built to augment data teams, not replace them. It allows data engineers to focus on building robust and clean data models, while business operators can reliably explore this data on their own. The platform translates natural language questions into SQL queries, providing transparent and verifiable results.

How to use Buster

Using Buster is designed to be an intuitive process for both data professionals and business users:

  1. Integration: Data engineers start by connecting Buster to their data warehouse and integrating it with their existing dbt project. This process is seamless and allows Buster to leverage the pre-existing data models and documentation.
  2. Semantic Layer Generation: Once connected, Buster automatically generates a robust semantic layer. This layer helps the AI understand the context, relationships, and definitions within the data, ensuring accurate query interpretation.
  3. Natural Language Querying: Business users can then interact with the data through a simple, chat-like interface. They can ask questions in plain English, such as "Show me our total sales by product category for the last 30 days" or "Create a line chart of monthly sales broken down by sales rep."
  4. Visualization and Customization: The AI responds with data tables, charts, and graphs. Users can further refine these visualizations using natural language commands like "change this to a bar chart" or "add a trendline."
  5. Dashboard Creation: Users can assemble multiple metrics and visualizations into comprehensive, shareable dashboards to track key performance indicators (KPIs).
  6. Collaboration and Verification: Reports and metrics can be shared with team members. A built-in verification workflow allows users to request a review from the data team to ensure accuracy and build trust in the generated insights.
  7. Alerts and Scheduling: Set up automated reports to be sent to Slack or email on a schedule. Configure alerts for significant data spikes or anomalies to stay proactive.

Core Features of Buster

  • AI-Powered Natural Language Querying: Ask complex questions about your data in plain English and receive instant answers, tables, and visualizations.
  • Seamless dbt Integration: Connects directly to your dbt project to automatically create a semantic layer, respecting your existing data models and logic.
  • Automated Data Visualization: Instantly generates various chart types (bar, line, pie, etc.) and allows for natural language-based customization.
  • Interactive Dashboards: Build and share modern, interactive dashboards to monitor key metrics and company performance.
  • Slack Integration: Query data and receive insights directly within your Slack workspace, enhancing workflow efficiency.
  • Scheduled Reports & Alerts: Automate the delivery of reports and receive AI-generated summaries and alerts for important data changes.
  • Enterprise-Grade Security: Features SOC 2 Type II and HIPAA compliance, admin controls, and a policy of not training models on customer data to ensure security and privacy.
  • Open-Source and Self-Hostable: The core platform is open-source, offering flexibility and control for teams who wish to deploy it in their own cloud environment.
  • Bring Your Own API Keys (BYO): Provides the flexibility to use the LLM provider of your choice by bringing your own API keys.

Use Cases for Buster

Buster is versatile and can be applied across various departments:

  • Sales Teams: Can instantly track sales performance against quotas, identify top-performing representatives, and analyze customer lifetime value without waiting for a report.
  • Marketing Departments: Can measure campaign ROI, analyze customer segmentation, and monitor daily engagement metrics in real-time.
  • Operations & Product Teams: Can analyze product usage, track key feature adoption, create reports on SKU performance, and monitor operational efficiency.
  • Executive Leadership: Can access high-level company KPIs and performance indicators through customized dashboards for strategic decision-making.
  • Data Teams: Can significantly reduce their ad-hoc query workload, allowing them to focus on strategic data infrastructure and modeling projects.

Advantages of Buster

Buster offers significant advantages over traditional BI tools:

  • Democratization of Data: It truly enables self-service analytics for everyone, regardless of their technical skill level.
  • Increased Efficiency: Frees up valuable time for data teams and accelerates the decision-making process for business users.
  • Trust and Transparency: The ability to view the generated SQL and a formal verification process builds confidence in the data.
  • Flexibility and Control: The open-source option allows for complete customization and control over the deployment environment.
  • Scalability: With a usage-based pricing model and unlimited user seats, Buster can scale with a company's growth.

Pricing and Plans

Buster provides a flexible pricing structure. The platform is fundamentally open-source, which means it is free to download and deploy in your own cloud infrastructure. This option is ideal for teams that want maximum control and have the technical resources to manage the deployment. In addition to the free self-hosted version, Buster offers a fully-managed, fully-supported cloud offering. The pricing for the cloud version is usage-based, ensuring that you only pay for the resources you actually consume. This model includes unlimited seats and users, making it cost-effective to roll out across your entire organization. For detailed pricing on the managed cloud service, interested parties are encouraged to request early access through the company's website.

QueryX

QueryX is revolutionizing the way users interact with structured data. It's a sophisticated AI platform designed to bridge the gap between natural human language and the complex syntax of SQL. By allowing users to simply ask questions in their own words, either by typing or speaking, QueryX translates these conversational inputs into precise SQL queries. This empowers everyone in an organization, from business executives and doctors to data analysts and developers, to unlock valuable insights from their databases without needing to write a single line of code.

The platform is built to be a seamless blend of intuitive interaction and powerful AI-driven analysis. It functions as an intelligent co-pilot, dramatically speeding up the data exploration process. With QueryX, what used to take hours of meticulous query writing can now be accomplished in minutes, fostering a more data-driven culture across all departments.

How to use QueryX

Using QueryX is designed to be a straightforward and intuitive process. First, you connect your structured relational database to the QueryX environment. The platform supports a wide range of SQL databases. Once connected, you can use the QueryX Chat interface. Simply type your question in natural language, such as "Show me the total sales for the last quarter in the European region," or even dictate it using the voice input feature. QueryX processes your request, generates the corresponding SQL query, and returns the relevant data or insights. You can also ask follow-up questions to refine your search and conduct deeper investigations conversationally. For developers and system integrators, QueryX offers robust APIs and open-source sample code to embed its Text-to-SQL capabilities into existing software or BI visualization tools.

Core Features of QueryX

  • Natural Language to SQL: Translates conversational questions (text or voice) in multiple languages into accurate SQL queries.
  • Conversational Chat Interface: Allows users to interact with their data through an easy-to-use chat, supporting follow-up questions for iterative data investigation.
  • Voice-Powered Commands: Supports voice dictation, enabling hands-free data querying in your native language (e.g., French, Spanish).
  • SQL Coder Copilot: Acts as a powerful assistant for data analysts and developers, accelerating the generation of simple to highly complex SQL queries by up to 10x.
  • High Accuracy Engine: Utilizes a proprietary solution with a confidence rating engine, automatic error correction, and human feedback reinforcement learning to deliver results with over 2x the accuracy of standard LLM models.
  • Broad Database Support: Integrates with all major SQL database solutions, including MySQL, SQLite, MariaDB, and more.
  • API for Integration: Provides APIs for seamless integration into legacy software, custom applications, and BI tools.
  • Data Confidentiality: Ensures your data never leaves your secure environment, with options for on-premise deployment for enterprise clients.
  • Energy Efficiency: Optimized power consumption compared to standard large language models, making it a more sustainable solution.

Use Cases for QueryX

For Healthcare Professionals: A doctor like Margaux can independently search vast patient databases for specific information to aid in diagnosis by asking simple questions like, "Find patients with these symptoms who responded to this treatment," without needing IT assistance.

For Data Analysts: An analyst like Clara, who spends significant time writing complex SQL, can use QueryX to generate queries instantly. She can ask, "What is the correlation between customer acquisition cost and lifetime value by marketing channel?" and get the SQL code in seconds, freeing up time for deeper analysis.

For E-commerce Managers: A Customer Experience Manager like Quentin can enhance his RAG-based customer support tool. By integrating QueryX, he can provide real-time, dynamic information like "How many units of product X are left in stock?" or "What are the current promotions on laptops?" directly from the database.

Advantages of QueryX

QueryX offers a unique combination of simplicity, power, and security. Its no-code framework makes data accessible to everyone, regardless of technical skill. For professionals, it provides a massive productivity boost, significantly reducing the time spent on data extraction. The platform's commitment to accuracy, backed by its advanced error correction and learning mechanisms, ensures that the insights are reliable for critical business decisions. Furthermore, its strict confidentiality protocols and the option for on-premise deployment address the security concerns of modern enterprises.

Pricing and Plans

QueryX offers a scalable pricing structure to fit different needs:

  • Starter (Free): Ideal for individuals and small projects to discover QueryX. Includes 500 queries/month, support for up to 25 columns, and compatibility with MySQL, SQLite, and MariaDB. Features include Human in the loop, ERD, and Query auto-correction.
  • Pro (On Demand): Designed for teams with regular needs and larger datasets. Offers 1000 queries/month, support for up to 1000 columns, and compatibility with all SQL database formats. This is a SaaS solution with pricing available upon contact.
  • Enterprise (On Demand): A fully customized solution for large organizations with specific requirements. Provides unlimited queries and users, with the option for SaaS or on-premise deployment for ultimate accuracy and security. Pricing is customized upon contact.

Positioning

Their taxonomy shows where the products overlap and where each one has a more distinct focus. Unknown fields are shown explicitly and are never filled with assumptions.

Categories

Shared
Business IntelligenceData AnalysisDatabase
Only Buster
Automation
Only QueryX
No Code

Tags

Shared
business intelligencedata analysisnatural language querytext to sql
Only Buster
AI data analystdashboarddata visualizationdbtopen sourceself-service analytics
Only QueryX
APIdatabaseno-codesql copilotsql generatorvoice to sql

Audience and roles

Shared
No listed items
Only Buster
No listed items
Only QueryX
No listed items

Traffic comparison

Traffic is shown on the same scale so differences in market visibility are not visually understated.

How to interpret the traffic data

Both charts share the same months and vertical scale. Each tool identifies its latest reporting month; missing months are left blank, not counted as zero. Regional and source visit counts are estimates calculated from the reported shares.

Buster monthly traffic:

Latest traffic · 2026-05

Monthly visits
1.7K
Avg. visit duration
0:32
Pages per visit
1.67
Bounce rate
36.58%
Data updated 2026-06-15

Monthly traffic trend

  • 2025-09: 6.5K
  • 2026-01: 3.4K
  • 2026-02: 3.6K
  • 2026-03: 2.7K
  • 2026-04: 2.8K
  • 2026-05: 1.7K

Top regions

Top 5 countries/regions
Country/regionPercentageEstimated visits
🇺🇸United States76.79%1.3K
🇮🇳India23.21%397

Search keywords

ai busterbusterbuster appbuster socan gear buster

QueryX

No data available

Community signals

Ratings, comments, favorites, and likes are community signals—not a substitute for product fit.

Buster

Rating
No data available
Comments
0
Favorites
187
Likes
179

QueryX

Rating
No data available
Comments
0
Favorites
157
Likes
159

Buster vs QueryX · Comparison FAQ

What do Buster and QueryX have in common?
Both tools are listed under Business Intelligence、Data Analysis、Database. These categories indicate overlapping use cases; compare their detailed descriptions for workflows, capabilities and limitations.
Are Buster and QueryX free?
Listed pricing models: Buster — Freemium; QueryX — Freemium. Missing pricing is not proof of a free plan, and freemium does not mean every feature is free. Check official sites for current plans, limits and trials.
How should I choose between Buster and QueryX?
The primary listed category is Business Intelligence for Buster, and Business Intelligence for QueryX. Compare features, steps and use cases, then verify pricing, data permissions and deployment needs. This page does not include hands-on testing and does not declare a winner from traffic or tags.

Sources and comparison methodology

This page is assembled from ToolMage product listings, taxonomy, traffic statistics and on-site user feedback. It is not a hands-on test or an independent review.

  • Feature and plan descriptions reflect information in the listings, not real-time guarantees. Verify pricing, quotas, availability and privacy terms on the official sites.
  • Traffic uses the reporting months shown. Missing statistics do not mean zero visits, and different periods do not establish growth or superiority. Regional and source visit counts are estimates based on shares.
  • Different tags indicate differences in the listings, not proof that the other product lacks a capability. Ratings, favorites and visits are not used to declare a winner.

Related comparisons