
DataBrain
Embedded Analytics
AI TOOL COMPARISON
What is the difference, and which fits your workflow? Compare features, usage, pricing models and traffic side by side.
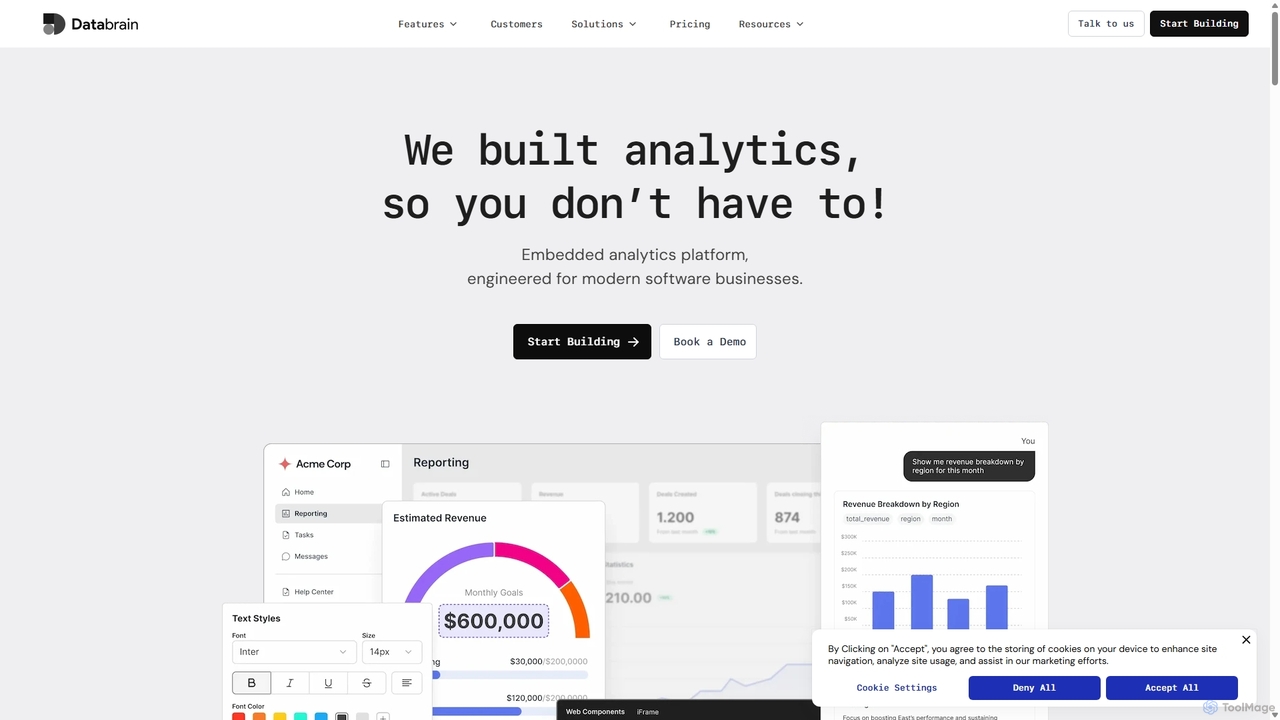
DataBrain is an AI-powered embedded analytics platform designed for modern software businesses. It enables companies to quickly build and integrate interactive, customer-facing dashboards and reports directly into their products. With a low-code interface, extensive customization, and natural language querying, DataBrain helps save significant development time, increase product stickiness, and create new revenue streams.
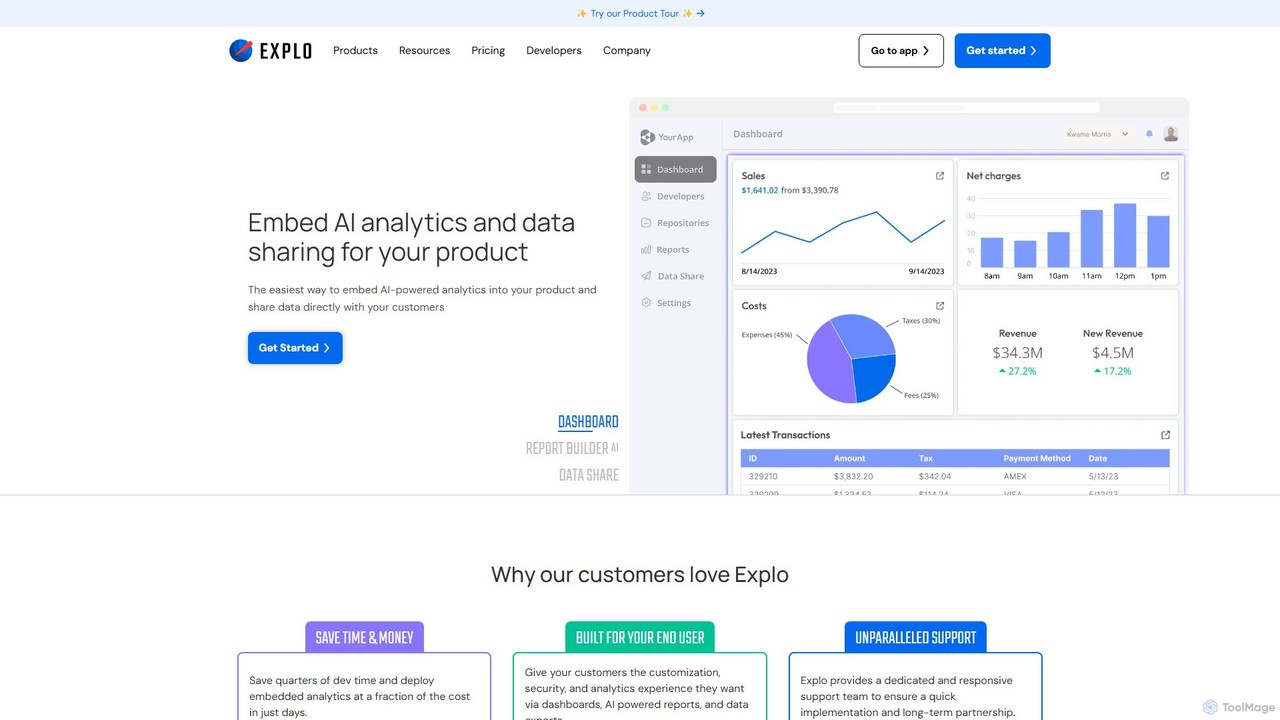
Explo is a powerful platform for creating and embedding customer-facing analytics and dashboards directly into any application. It allows businesses to connect their databases, build beautiful, customizable data visualizations, and share insights with their users seamlessly. With AI-powered features like a dashboard builder and reporting, Explo helps SaaS, E-commerce, and Fintech companies enhance their product value by providing native, white-labeled analytics experiences without extensive development effort.
Compare product focus, pricing models and audiences. Highlighted rows indicate different listed information; unknown pricing does not mean free.
| Quick facts | DataBrain | Explo |
|---|---|---|
| Pricing model | Freemium | Freemium |
| Product type | Web | Web |
| Primary focus | Embedded Analytics | Business Intelligence |
| Audience and roles | Business Intelligence Developer · Chief Technology Officer · Customer Support · Data Analyst · Product Manager · SaaS Founder · Sales Representative · Software Developer | No data available |
| Categories | Embedded Analytics · Business Intelligence · Low Code Platform · Reporting | Business Intelligence · Embedded Analytics · Data Visualization · Dashboard |
| Added | Sep 10, 2025 | Aug 8, 2025 |
| Updated | Nov 19, 2026 | Nov 19, 2026 |
Explore the listed product descriptions, features and workflows. Taxonomy labels alone are not feature evaluations.
DataBrain is a comprehensive embedded analytics platform engineered specifically for modern software and SaaS businesses. It addresses the common challenge of building and maintaining sophisticated, customer-facing analytics by providing a powerful, developer-friendly solution that can be integrated in minutes. The platform empowers companies to deliver valuable data insights to their end-users, enhancing product value and driving user engagement without diverting extensive engineering resources.
The core mission of DataBrain is to replace the cumbersome, inflexible, and expensive process of building analytics from scratch or using traditional BI tools that are not designed for embedding. It offers a seamless, truly native analytics experience for customers, featuring interactive dashboards, pixel-perfect customizable visualizations, and robust self-service reporting capabilities. A key differentiator is its AI-powered analytics, which allows end-users to 'chat with their data' using natural language to uncover hidden insights, making data exploration intuitive for everyone, regardless of their technical expertise.
Integrating DataBrain into your application is a streamlined, four-step process designed for speed and efficiency:
DataBrain is ideal for any software company looking to enhance its product with powerful analytics:
Switching to or starting with DataBrain provides a significant competitive advantage. Customer testimonials highlight massive cost savings (up to $300k) and development time reductions (from months to weeks). It offers predictable pricing compared to competitors like PowerBI, superior customization, and a developer-first approach that accelerates time-to-market. By handling the complexity of security, scalability, and multi-tenancy, DataBrain allows businesses to focus on their core product while delivering a world-class analytics experience.
DataBrain offers transparent pricing that scales with your business, with a 14-day free trial available for all plans.
Explo is a leading customer-facing analytics platform designed to empower businesses by embedding beautiful, interactive, and AI-powered dashboards directly into their own applications. It provides a comprehensive solution for companies in sectors like SaaS, E-commerce, Ed-tech, and Fintech to offer valuable data insights to their end-users, enhancing product stickiness and user engagement. Instead of spending months on building an in-house analytics solution, Explo enables you to launch a fully functional, white-labeled analytics experience in a fraction of the time.
The platform is built on the principle of simplicity and power, allowing both technical and non-technical users to create sophisticated data visualizations. With its AI-driven capabilities, Explo streamlines the process of turning raw data into actionable insights, making data more accessible and understandable for your customers.
Explo simplifies the process of embedding analytics into a few straightforward steps:
Explo is versatile and can be applied across numerous industries:
Explo offers significant advantages over building an analytics solution from scratch:
Explo offers a range of plans to suit different needs:
Their taxonomy shows where the products overlap and where each one has a more distinct focus. Unknown fields are shown explicitly and are never filled with assumptions.
Traffic is shown on the same scale so differences in market visibility are not visually understated.
Both charts share the same months and vertical scale. Each tool identifies its latest reporting month; missing months are left blank, not counted as zero. Regional and source visit counts are estimates calculated from the reported shares.
| Country/region | Percentage | Estimated visits |
|---|---|---|
| 🇮🇳India | 37.37% | 1.7K |
| 🇺🇸United States | 22.72% | 1K |
| 🇮🇩Indonesia | 19.61% | 871 |
| 🇮🇹Italy | 10.8% | 480 |
| 🇫🇷France | 9.5% | 422 |
| Country/region | Percentage | Estimated visits |
|---|---|---|
| 🇺🇸United States | 44.52% | 25.8K |
| 🇮🇳India | 17.96% | 10.4K |
| 🇧🇷Brazil | 17.75% | 10.3K |
| 🇻🇳Vietnam | 11.79% | 6.8K |
| 🇮🇩Indonesia | 7.98% | 4.6K |
| Source type | Percentage | Estimated visits |
|---|---|---|
| Direct | 94.21% | 54.5K |
| 3.9% | 2.3K | |
| Referral | 1.89% | 1.1K |
Ratings, comments, favorites, and likes are community signals—not a substitute for product fit.
This page is assembled from ToolMage product listings, taxonomy, traffic statistics and on-site user feedback. It is not a hands-on test or an independent review.