ToolMage
Sign in

AI TOOL COMPARISON

DevDynamics vs Haystack

What is the difference, and which fits your workflow? Compare features, usage, pricing models and traffic side by side.

Jump to key differences

Product overview

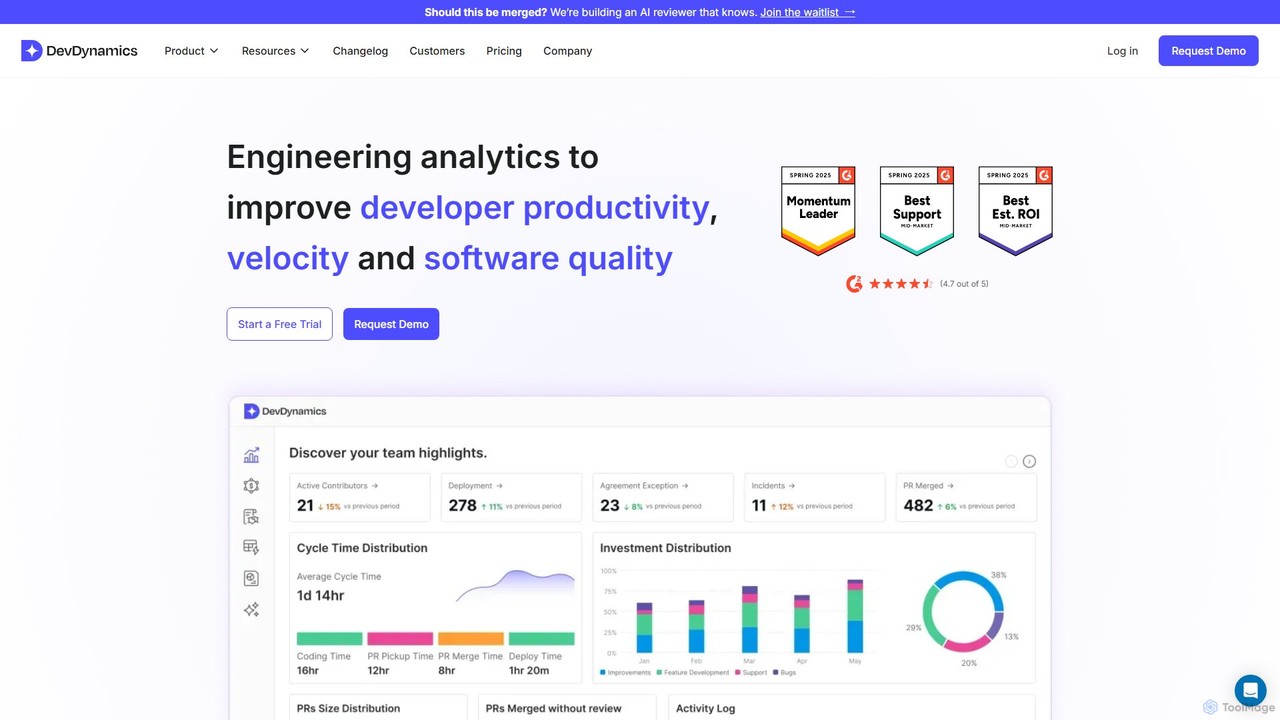
DevDynamics Product overview

DevDynamics is an AI-powered software engineering intelligence platform designed to help teams ship high-quality software faster. By integrating with tools like Jira, GitHub, and CI/CD pipelines, it provides deep insights into engineering workflows, DORA metrics, and developer experience. It empowers engineering leaders with data-driven reports and recommendations to optimize productivity, align with business goals, and foster a world-class engineering culture.

Preview

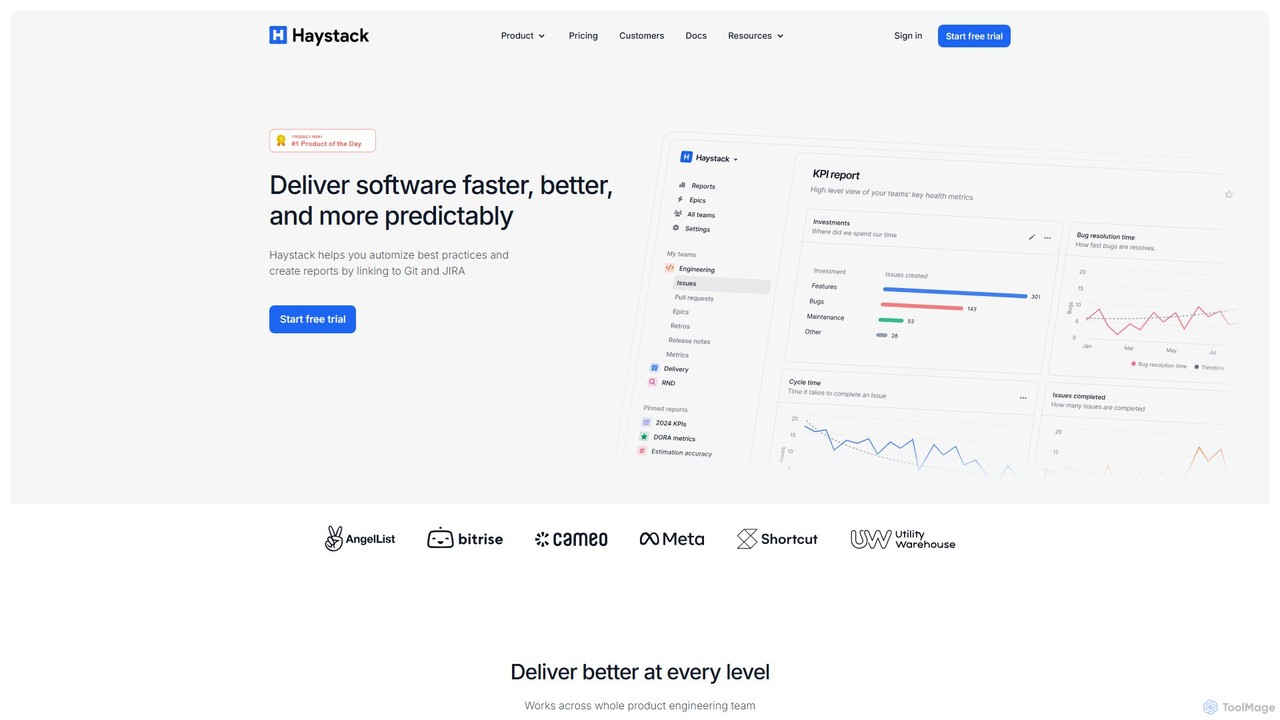
Haystack Product overview

Haystack is an engineering intelligence platform that provides actionable insights for product and engineering leaders. It helps teams improve their software delivery lifecycle by tracking DORA metrics, cycle time, and other key performance indicators. By analyzing data from Git and project management tools, Haystack identifies bottlenecks, automates reporting, and fosters a culture of transparency and continuous improvement, ultimately accelerating time-to-market.

Preview

Quick facts

Compare product focus, pricing models and audiences. Highlighted rows indicate different listed information; unknown pricing does not mean free.

DevDynamics VS Haystack — Quick facts
Quick factsDevDynamicsHaystack
Pricing modelFreemiumFreemium
Product typeWebWeb
Primary focusBusiness IntelligenceBusiness Intelligence
Audience and rolesNo data availableNo data available
CategoriesBusiness Intelligence · Analytics · Project ManagementBusiness Intelligence · Analytics & Reporting · Project Management
AddedAug 4, 2025Aug 1, 2025
UpdatedNov 19, 2026Nov 19, 2026

Features, usage and use cases

Explore the listed product descriptions, features and workflows. Taxonomy labels alone are not feature evaluations.

DevDynamics

DevDynamics is a comprehensive engineering analytics platform that provides engineering leaders with the visibility and insights needed to build world-class software development teams. It addresses the common challenge of managing engineering teams based on guesswork by replacing it with a data-driven approach. The platform integrates seamlessly into existing workflows, pulling data from over 20 sources including version control systems, issue trackers, CI/CD tools, and incident management platforms to create a single, unified view of the entire development lifecycle.

Powered by AI, DevDynamics goes beyond simple metrics. It offers deep, actionable insights and intelligent recommendations to help teams identify bottlenecks, improve processes, and accelerate delivery. The core philosophy is to align engineering efforts with business objectives, provide real-time visibility for effective decision-making, and create an environment that enables developers to achieve a state of flow, thereby boosting both productivity and satisfaction.

How to use DevDynamics

Using DevDynamics is a straightforward process designed for easy adoption:

  1. Integrate Your Tools: Start by connecting DevDynamics to your existing development toolchain. It offers one-click integrations with popular platforms like GitHub, GitLab, Jira, Jenkins, PagerDuty, Google Calendar, and more. This process is secure (SOC 2 certified) and does not require access to your source code.
  2. Define and Track Metrics: Work with DevDynamics' experts or use their pre-configured dashboards to set up and track key engineering metrics. This includes DORA metrics (Deployment Frequency, Lead Time for Changes, Change Failure Rate, Time to Restore Service), cycle times, throughput, and code review analytics.
  3. Analyze with AI-Powered Dashboards: Utilize the platform's standard and custom dashboards to visualize data. Monitor sprint progress, analyze team activity, track code quality, and review CI/CD performance. The AI engine generates reports that explain what is happening, why it's happening, and what actions to take.
  4. Drive Continuous Improvement: Leverage the insights for various management activities. Use developer reports for constructive 1:1 meetings, apply capacity forecasting for better planning, and use developer experience surveys to maintain team health and morale.

Core Features of DevDynamics

  • Comprehensive Engineering Metrics: Track DORA metrics, cycle times, throughput, pull request (PR) and code review insights, and define custom metrics tailored to your team's goals.
  • Extensive Integrations: Connects with over 20+ tools across the software development lifecycle, including Jira, GitHub, CI/CD, PagerDuty, and calendar apps, offering more integrations than competitors.
  • AI-Powered Insights: Features AI-generated reports, smart recommendations, capacity forecasting, and custom AI reports to uncover deep insights from your engineering data.
  • Advanced Dashboards & Reporting: Offers standard dashboards for Git, issues, and DORA, alongside specialized views for sprint analytics, activity logs, code quality, and CI/CD performance. Custom dashboards are available for specific team needs.
  • Delivery, Planning & Cost Management: Tools for tracking effort allocation, managing engineering workload, scenario planning, and forecasting. It also provides features for engineering cost tracking and R&D cost capitalization.
  • Developer Experience Focus: Includes features like developer experience surveys and quarterly reports to help leaders understand and improve team satisfaction and productivity.
  • Enterprise-Grade Security & Support: SOC 2 certified platform that never accesses your source code. Provides award-winning 24/7 support and dedicated account management for enterprise clients.

Use Cases for DevDynamics

DevDynamics is valuable for various roles within an engineering organization:

  • VPs of Engineering: Gain a holistic view of the organization's health, align engineering investments with business strategy, and report on R&D costs and productivity to the executive board.
  • Engineering Managers & Team Leads: Make data-informed decisions to unblock their teams, optimize sprint planning, balance workloads, and conduct more effective 1:1s with data-driven performance insights.
  • Project & Product Managers: Improve project predictability with accurate forecasting, monitor progress against goals, and ensure engineering resources are allocated to the highest-priority initiatives.
  • Developers: Understand their own contributions and impact, identify areas for personal growth, and work in a system that minimizes friction and supports focused, deep work.

Advantages of DevDynamics

DevDynamics stands out by offering a holistic solution that connects technical metrics with business outcomes. Its key advantages include its vast number of integrations, which provide a complete picture of the engineering process. The AI-powered layer delivers not just data, but actionable intelligence, saving managers time and helping them make smarter decisions. Furthermore, its focus on developer experience ensures that productivity improvements don't come at the cost of team health. The platform is built for enterprises, with robust security and dedicated support, making it a reliable partner for scaling engineering organizations.

Pricing and Plans

DevDynamics offers a freemium model with several tiers to suit different team sizes and needs:

  • Free Plan: $0/contributor/month. Includes core engineering metrics (DORA, Cycle times) and standard integrations with tools like Jira and GitHub.
  • Pro Plan: $15/contributor/month. Adds CI/CD & Incident Management integrations, AI-generated reports, sprint analytics, code quality dashboards, and email support.
  • Business Plan: $30/contributor/month. Includes everything in Pro, plus custom integrations, custom AI reports, capacity forecasting, developer experience surveys, engineering cost tracking, and 24/7 priority support.
  • Enterprise Plan: Custom pricing. Tailored for large-scale deployments with dedicated account managers, SLA-backed support, and advanced features like R&D cost capitalization.

Haystack

Haystack is a leading delivery operations and engineering intelligence platform designed to provide clarity and actionable insights for software development teams. Trusted by hundreds of companies, it transforms complex development data from Git repositories and project management tools into easy-to-understand metrics and reports. The platform focuses on improving engineering output, fostering team trust, and aligning development efforts with business objectives. Unlike tools that can be misused for top-down micromanagement, Haystack promotes transparency by ensuring that teams and executives have access to the same data, creating a collaborative environment for continuous improvement.

How to use Haystack

Getting started with Haystack is a straightforward process designed to deliver value quickly:

  1. Sign Up and Connect: Begin with a 14-day free trial, no credit card required. Connect your team's Git repositories (GitHub, GitLab, Bitbucket, including self-hosted versions) and project management tools.
  2. Data Analysis: Haystack securely analyzes metadata—such as timestamps, titles, and descriptions—without ever accessing or storing your source code. This analysis generates key performance indicators.
  3. Explore Dashboards: Dive into intuitive dashboards that visualize critical metrics like Cycle Time, Deployment Frequency, Change Failure Rate, and other DORA metrics. Identify trends, spot outliers, and understand your team's workflow.
  4. Identify Bottlenecks: Use the insights to pinpoint bottlenecks in your development process, such as long-running pull requests or inefficient code reviews, and take data-driven action to resolve them.
  5. Automate Reporting: Leverage features like Delivery Pulse to automatically generate release notes, track milestone progress, and receive weekly sprint summaries. This keeps all stakeholders informed without manual effort.
  6. Foster Improvement: Use the data in team meetings, 1-on-1s, and planning sessions to facilitate constructive conversations about performance and drive a culture of continuous improvement.

Core Features of Haystack

  • Engineering Metrics & Analytics: Comprehensive tracking of DORA metrics, Cycle Time, Throughput, Code Review metrics, and more to provide a full picture of engineering health.
  • Delivery Pulse: An automated communication feature that generates release notes from commits and tickets, celebrates milestone achievements, and provides weekly progress summaries to keep everyone in the loop.
  • Risk & Bottleneck Detection: Proactively identifies potential issues in the delivery pipeline, such as work-in-progress (WIP) overloads or stalled pull requests, allowing teams to address them before they cause delays.
  • Capacity Planning & Investment Visibility: Offers clear insights into team capacity and how engineering time is being invested across different initiatives, improving the accuracy of planning and resource allocation.
  • Customizable Dashboards and Reports: Simplifies complex data into actionable insights through intuitive visualizations and provides regular performance reports to track progress over time.
  • Seamless Integrations: Natively supports GitHub, GitLab, and Bitbucket (both cloud and enterprise versions), as well as integrations with tools like Slack for alerts and notifications.

Use Cases for Haystack

Haystack is valuable for various roles within an engineering organization:

  • VPs of Engineering & Directors: Gain a high-level overview of organizational health, align engineering performance with business goals, and make strategic, data-informed decisions to optimize time-to-market.
  • Engineering Managers: Lead more effective teams by managing scope, improving delivery consistency, and facilitating data-driven 1-on-1s. The platform helps transform planning processes from dreaded tasks into confident, efficient exercises.
  • Development Teams: Empower developers to understand their own workflows, identify areas for improvement, and see the impact of their work. The transparency helps build trust and promotes collaborative problem-solving. For example, teams have used Haystack to decrease their cycle time from 40 days to just 3 days.

Advantages of Haystack

Haystack stands out by focusing on team empowerment and trust. Its core advantages include:

  • Fosters Trust and Transparency: Provides a single source of truth for everyone, from individual contributors to executives, preventing data from being used as a tool for micromanagement.
  • Actionable, Not Just Informational: Goes beyond raw numbers to provide context and actionable insights that guide teams toward tangible improvements.
  • Enhances Collaboration: By automating updates and sharing progress openly, it keeps teams and stakeholders aligned and working together effectively.
  • Security First: Your source code is never accessed or stored, ensuring your intellectual property remains secure.
  • Time-Saving Automation: Automates tedious tasks like writing release notes and compiling progress reports, freeing up valuable engineering time.

Pricing and Plans

Haystack offers a transparent pricing model with a 14-day free trial.

  • Growth Plan: Priced at $20 per member per month (with an annual commitment), this plan is suggested for teams with under 100 engineers. It includes unlimited alerts, 12 months of historical data, and email & Slack support.
  • Enterprise Plan: Offers custom pricing for organizations with 100+ engineers. It includes all features from the Growth plan, plus on-premise/custom integrations, a dedicated performance specialist, quarterly performance reports, and team training/onboarding sessions.

A credit card is not required to start the free trial, making it easy to experience the platform's benefits firsthand.

Positioning

Their taxonomy shows where the products overlap and where each one has a more distinct focus. Unknown fields are shown explicitly and are never filled with assumptions.

Categories

Shared
Business IntelligenceProject Management
Only DevDynamics
Analytics
Only Haystack
Analytics & Reporting

Tags

Shared
developer productivityDORA metricsproject management
Only DevDynamics
ai-powered insightsCI/CDcode qualityengineering analyticsgithubjirasoftware developmentteam management
Only Haystack
agile developmentcode reviewcycle timedelivery pipelinedevopsengineering intelligencesoftware development analytics

Audience and roles

Shared
No listed items
Only DevDynamics
No listed items
Only Haystack
No listed items

Traffic comparison

Traffic is shown on the same scale so differences in market visibility are not visually understated.

How to interpret the traffic data

Both charts share the same months and vertical scale. Each tool identifies its latest reporting month; missing months are left blank, not counted as zero. Regional and source visit counts are estimates calculated from the reported shares.

DevDynamics monthly traffic:

Latest traffic · 2026-05

Monthly visits
5.5K
Avg. visit duration
0:32
Pages per visit
1.96
Bounce rate
35.56%
Data updated 2026-06-15

Monthly traffic trend

  • 2025-09: 32K
  • 2026-01: 9.1K
  • 2026-02: 4.5K
  • 2026-03: 5.4K
  • 2026-04: 7.6K
  • 2026-05: 5.5K

Top regions

Top 5 countries/regions
Country/regionPercentageEstimated visits
🇺🇸United States72%3.9K
🇮🇳India26.63%1.5K
🇵🇰Pakistan1.37%75

Search keywords

best tools to add to chat gpt for codingclarity enginedeveloper profileroles in a software development teamsoftware development plan requirements

Haystack monthly traffic:

Latest traffic · 2026-05

Monthly visits
6.8K
Avg. visit duration
0:21
Pages per visit
2.97
Bounce rate
37.08%
Data updated 2026-06-15

Monthly traffic trend

  • 2025-09: 6.8K
  • 2026-01: 5.7K
  • 2026-02: 4.2K
  • 2026-03: 6.6K
  • 2026-04: 6.7K
  • 2026-05: 6.8K

Top regions

Top 5 countries/regions
Country/regionPercentageEstimated visits
🇺🇸United States36.06%2.4K
🇧🇷Brazil24.07%1.6K
🇮🇳India19.21%1.3K
🇩🇪Germany11.3%765
🇻🇳Vietnam9.36%633

Search keywords

extract jira ids from pr titleshay stackhaystackhaystack deliveryheystack

Community signals

Ratings, comments, favorites, and likes are community signals—not a substitute for product fit.

DevDynamics

Rating
No data available
Comments
0
Favorites
171
Likes
177

Haystack

Rating
No data available
Comments
0
Favorites
197
Likes
203

DevDynamics vs Haystack · Comparison FAQ

What do DevDynamics and Haystack have in common?
Both tools are listed under Business Intelligence、Project Management. These categories indicate overlapping use cases; compare their detailed descriptions for workflows, capabilities and limitations.
Are DevDynamics and Haystack free?
Listed pricing models: DevDynamics — Freemium; Haystack — Freemium. Missing pricing is not proof of a free plan, and freemium does not mean every feature is free. Check official sites for current plans, limits and trials.
How should I choose between DevDynamics and Haystack?
The primary listed category is Business Intelligence for DevDynamics, and Business Intelligence for Haystack. Compare features, steps and use cases, then verify pricing, data permissions and deployment needs. This page does not include hands-on testing and does not declare a winner from traffic or tags.

Sources and comparison methodology

This page is assembled from ToolMage product listings, taxonomy, traffic statistics and on-site user feedback. It is not a hands-on test or an independent review.

  • Feature and plan descriptions reflect information in the listings, not real-time guarantees. Verify pricing, quotas, availability and privacy terms on the official sites.
  • Traffic uses the reporting months shown. Missing statistics do not mean zero visits, and different periods do not establish growth or superiority. Regional and source visit counts are estimates based on shares.
  • Different tags indicate differences in the listings, not proof that the other product lacks a capability. Ratings, favorites and visits are not used to declare a winner.

Related comparisons