ToolMage
Sign in

AI TOOL COMPARISON

Findly vs InsightBase

What is the difference, and which fits your workflow? Compare features, usage, pricing models and traffic side by side.

Jump to key differences

Product overview

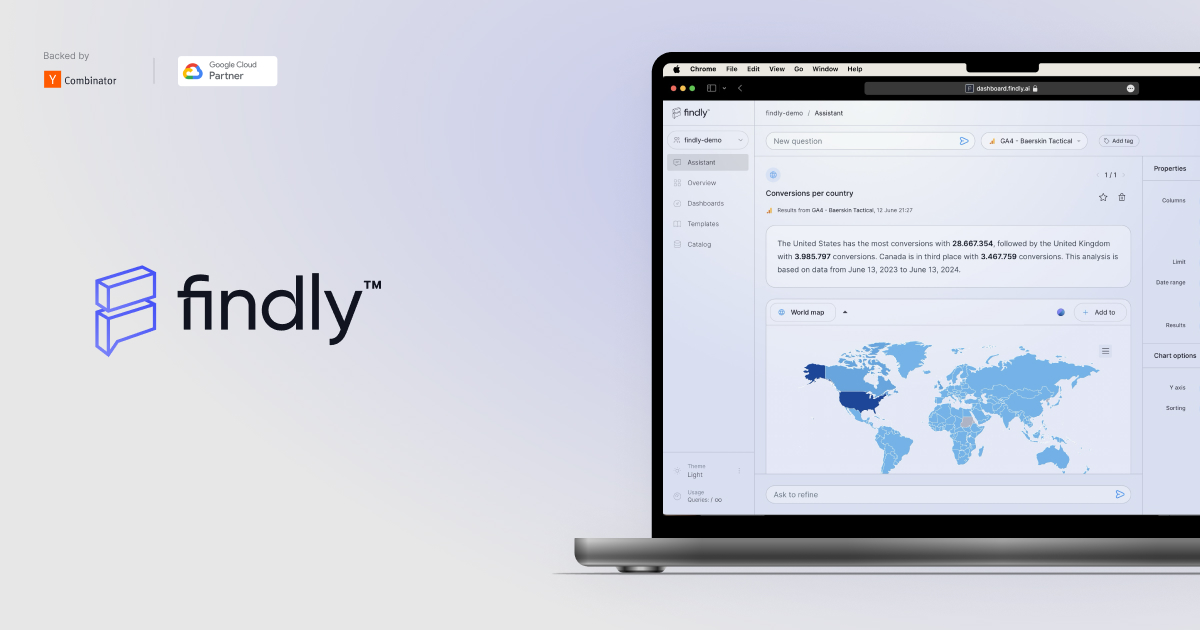
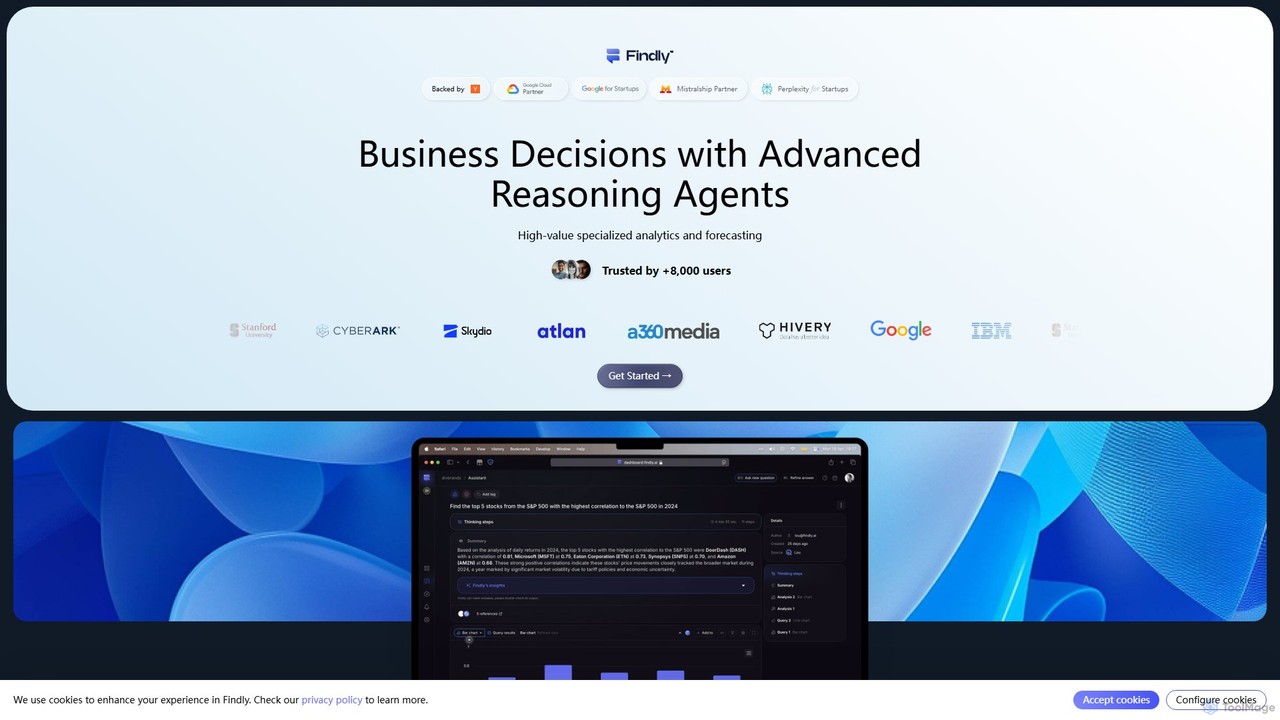
Findly Product overview

Findly is an AI-powered business intelligence (BI) platform that allows users to analyze data and get insights using natural language. It connects to various data sources, translates plain English questions into complex SQL queries, and provides interactive visualizations and reports. Designed for both technical and non-technical users, Findly simplifies data analysis, making it faster and more accessible for entire teams.

Preview

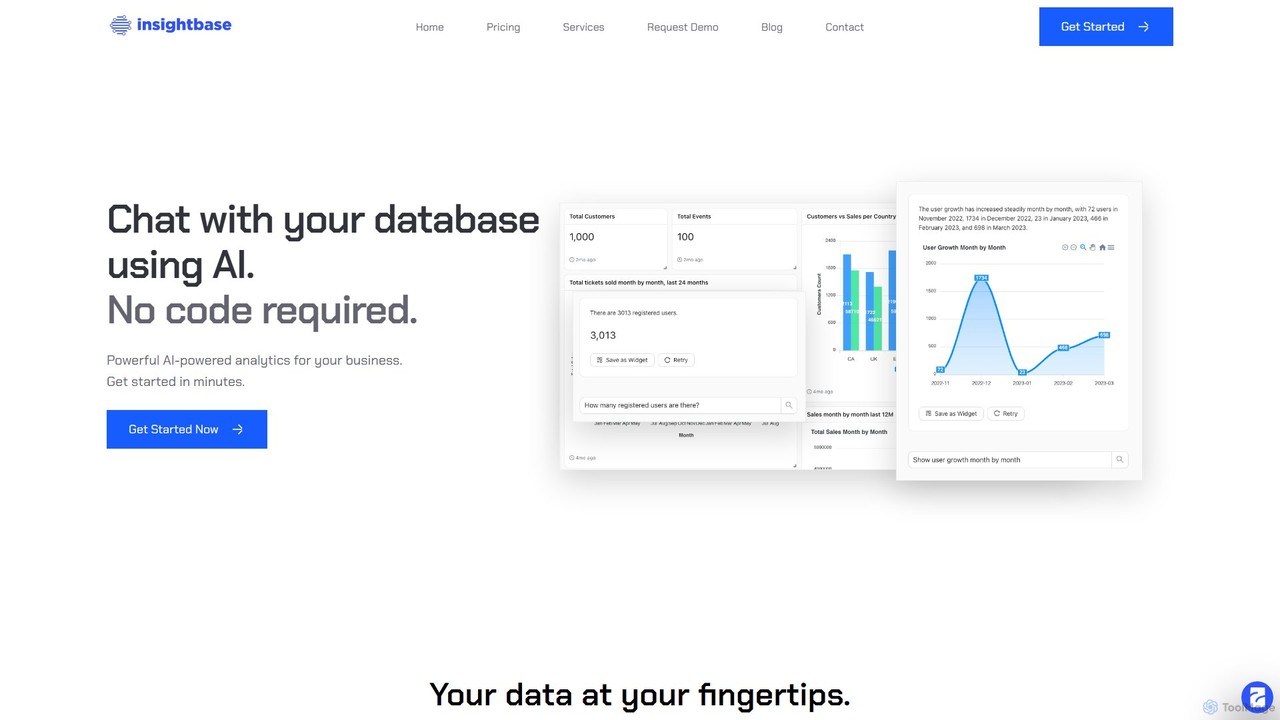
InsightBase Product overview

InsightBase is an AI-powered business intelligence platform that allows you to chat with your database using natural language. It empowers both non-technical and technical users to build dashboards, generate reports, and gain data-driven insights in minutes, without needing to write complex SQL queries.

Preview

Quick facts

Compare product focus, pricing models and audiences. Highlighted rows indicate different listed information; unknown pricing does not mean free.

Findly VS InsightBase — Quick facts
Quick factsFindlyInsightBase
Pricing modelFreemiumFreemium
Product typeWebWeb
Primary focusBusiness IntelligenceBusiness Intelligence
Audience and rolesNo data availableNo data available
CategoriesBusiness Intelligence · Data Analysis · No CodeBusiness Intelligence · Data Analysis · Database · No Code
AddedAug 14, 2025Aug 4, 2025
UpdatedNov 19, 2026Nov 19, 2026

Features, usage and use cases

Explore the listed product descriptions, features and workflows. Taxonomy labels alone are not feature evaluations.

Findly

Findly is a revolutionary AI-powered business intelligence (BI) and data analysis platform designed to bridge the gap between complex business data and actionable insights. It empowers users, regardless of their technical expertise, to have a direct conversation with their data. By simply asking questions in natural language, users can uncover trends, analyze performance, and make informed decisions without writing a single line of SQL code. Findly's core mission is to democratize data access and create a self-service analytics environment for modern businesses.

The platform's unique strength lies in its sophisticated multi-stage architecture, which goes far beyond standard text-to-SQL models. It utilizes a proprietary language parsing layer, a robust semantic layer, and an AI co-pilot named 'Semantica'. This combination ensures unparalleled accuracy by first understanding the business context and terminology (the 'what') before generating the complex technical query (the 'how'). This approach dramatically reduces errors and AI 'hallucinations' common in other systems, providing users with reliable and trustworthy results.

How to use Findly

Using Findly is an intuitive, conversational process designed to deliver insights quickly:

  1. Connect Data Sources: Begin by securely connecting your various data sources. Findly integrates seamlessly with marketing platforms like Google Analytics and Facebook Ads, data warehouses such as Google BigQuery, and virtually any SQL database.
  2. Build Your Semantic Layer: This is where Findly truly shines. Using the 'Semantica' AI co-pilot, you define your business logic. Semantica helps you map technical database columns to understandable business terms (e.g., 'ga_revenue' becomes 'Total Revenue'). It automates the discovery of metrics and dimensions, reducing a process that used to take weeks to mere hours.
  3. Ask Questions in Natural Language: Once set up, you can simply type questions into the Findly interface. For example: "What was our customer acquisition cost from Facebook Ads last quarter, broken down by campaign?" or "Show me the month-over-month growth for our top 5 products."
  4. Receive Instant Visualizations and Insights: Findly's AI instantly parses your question, uses the semantic layer to generate a precise SQL query, executes it, and presents the answer in the most suitable format—be it a bar chart, line graph, table, or a textual summary.
  5. Explore, Share, and Export: Dive deeper into the results with interactive dashboards. You can filter data, change chart types, and explore related metrics. When you're ready, you can generate and export reports to share with stakeholders or use the collaboration features to discuss findings with your team.

Core Features of Findly

  • Natural Language Querying (Text-to-SQL): The ability to ask complex data questions in plain English, eliminating the need for SQL or BI tool expertise.
  • Advanced Semantic Layer: A central hub for your business logic that ensures every query is consistent, accurate, and secure. It translates business terms into technical database language.
  • Semantica AI Co-pilot: An intelligent assistant that automates the creation and maintenance of the semantic layer, inferring metrics and dimensions from your data warehouse to accelerate setup by over 10x.
  • Broad Data Integration: Natively connects to Google Analytics, Facebook Ads, Shopify Ads, Google Search Console, BigQuery, and any SQL database, centralizing all your data for analysis.
  • Automated Insights & Advanced Analytics: Goes beyond answering questions to provide summaries, highlight trends, detect outliers, and even generate Python code for predictive analysis.
  • Interactive Dashboards & Visualizations: Automatically generates the best visualization for your query, with fully interactive charts and tables for deeper exploration.
  • Enterprise-Ready Solutions: Offers white-labeling, an embeddable assistant for your own applications, SAML SSO for secure access, and dedicated enterprise support.
  • Collaboration Tools: Features like team conversations, public report sharing, and saved prompts make it easy to work with data across an organization.

Use Cases for Findly

Findly is versatile and valuable for various teams within an organization:

  • Marketing Teams: Can instantly analyze campaign performance, ROI, and customer behavior by asking, "Compare conversion rates from Google and Facebook for the last 30 days."
  • Sales Departments: Can track performance and identify opportunities with queries like, "Show me the top-performing sales regions for Q3."
  • Product Managers: Can understand feature adoption and user engagement by asking, "What are the most used features by users who signed up in the last month?"
  • Executives & Leadership: Can get high-level business overviews on-demand, such as, "What is our total recurring revenue trend over the past 12 months?"
  • BI & Data Agencies: Can leverage Findly to serve their clients more efficiently, offering powerful, white-labeled, self-service analytics portals.

Advantages of Findly

Findly offers significant advantages over traditional BI tools and generic AI models:

  • Democratized Data Access: Empowers every team member, not just data experts, to make data-driven decisions.
  • Superior Accuracy and Reliability: Its semantic layer architecture results in over 50% better accuracy than models like GPT-4, with no SQL syntax errors and fewer hallucinations.
  • Unmatched Speed to Insight: Reduces the time from question to answer from days or hours to mere seconds.
  • Business Context-Aware: Understands your company's unique terminology and metrics, ensuring queries are interpreted correctly.
  • Scalable and Secure: Engineered to handle hundreds of tables and complex joins, with robust security features like data access controls and SSO.

Pricing and Plans

Findly offers a flexible pricing structure to suit different needs:

  • Basic Plan (Free): Perfect for individuals and small teams starting with data analysis. It includes access for up to 3 users, connections to Google Analytics and Facebook Ads, data visualization, and report generation.
  • Enterprise Plan (Contact Sales): A comprehensive solution for larger organizations. It features unlimited users, extensive data integrations (including any SQL DB, Shopify, BigQuery), a white-labeled solution, an embeddable assistant, dedicated Slack and setup support, SAML SSO, and access to all advanced capabilities.

InsightBase

InsightBase is a revolutionary business intelligence (BI) and data analytics platform designed to democratize data access for everyone in an organization. It bridges the gap between complex databases and actionable business insights by leveraging the power of artificial intelligence. With InsightBase, users can simply ask questions in plain English and receive instant answers, visualizations, and reports. This intuitive approach eliminates the traditional barriers of data analysis, making it 10 times faster than conventional BI tools and empowering teams to make smarter, data-driven decisions without extensive technical training.

The platform is built with a dual audience in mind. For executives, managers, and non-technical staff, it offers a simple chat interface to query data on the fly. For data scientists, analysts, and engineers, it provides a robust suite of tools including a visual dashboard builder, a custom SQL editor, and even a Javascript editor for maximum flexibility and control. This versatility ensures that while data becomes accessible to all, power users are not limited and can perform deep, complex analyses.

How to use InsightBase

Getting started with InsightBase is a straightforward process designed to deliver value within minutes:

  1. Connect Your Data Source: Securely connect your database to the platform. InsightBase supports a variety of popular databases including PostgreSQL, MySQL, MSSQL, and MongoDB, with more integrations continually being added.
  2. Ask Questions in Plain English: Use the AI-powered chat interface to ask business questions like, "What were our top 5 selling products last quarter?" or "Show me the user growth trend for the past six months." The AI will translate your query and fetch the relevant data.
  3. Build with the Visual Builder: For more structured reports, use the drag-and-drop visual builder. Select data points, choose from various chart types (bar, line, pie, etc.), and arrange them into a comprehensive dashboard without writing a single line of code.
  4. Leverage Advanced Tools (Optional): For complex or highly specific queries, data professionals can switch to the Custom SQL editor to write their own queries. The Javascript editor offers an additional layer of customization for dynamic visualizations and data manipulation.
  5. Monitor and Set Alerts: Configure data monitoring to receive automatic notifications when key metrics change, enabling proactive decision-making.
  6. Embed and Share: Embed your interactive dashboards and reports directly into your website, internal portal, or application, providing seamless access to insights for your team or customers.

Core Features of InsightBase

  • AI-Powered Natural Language Queries: Chat with your data in plain English to get instant answers and visualizations.
  • Visual Dashboard Builder: An intuitive drag-and-drop interface for creating beautiful and interactive dashboards.
  • Custom SQL and Javascript Editors: Full control for power users to write custom queries and scripts for maximum flexibility.
  • Real-time Data Monitoring: Set up alerts to be notified of significant changes in your data.
  • Embeddable Dashboards: Easily embed live dashboards and reports into any website or application.
  • Dynamic Widget Parameters: Create interactive reports where users can filter and change parameters on the fly.
  • Multiple Database Integrations: Natively supports PostgreSQL, MySQL, MSSQL, MongoDB, and more.
  • Robust Data Security: Your data is secure and encrypted, with access controls to ensure only authorized users can view it.
  • API Access: Integrate InsightBase's capabilities into your own workflows and applications.
  • Whitelabel & Self-Hosting: Enterprise options to customize the platform with your own branding and host it on your own infrastructure.

Use Cases for InsightBase

InsightBase is versatile and can be applied across various departments and industries:

  • Executive Leadership: C-level executives can get a high-level overview of business performance by asking direct questions, without needing to wait for reports from the analytics team.
  • Sales and Marketing Teams: Analyze campaign effectiveness, track KPIs, segment customers, and understand sales funnels in real-time.
  • Data Analysts and Scientists: Drastically speed up their workflow by using AI for initial data exploration and report generation, freeing up time for more in-depth strategic analysis.
  • Operations Teams: Monitor operational metrics, track inventory, and optimize processes by having direct access to live data.
  • SaaS Companies: Embed customer-facing dashboards directly into their products to provide added value and usage insights to their clients.

Advantages of InsightBase

InsightBase offers a significant competitive edge by transforming how businesses interact with their data:

  • Democratized Analytics: Empowers every team member, regardless of technical skill, to access and analyze data.
  • Unprecedented Speed: Turns weeks of traditional analysis work into minutes, accelerating the decision-making cycle.
  • Reduced Costs: Lowers dependency on specialized data engineers for routine reports and queries, saving time and resources.
  • Enhanced Flexibility: A single platform that serves the needs of both non-technical users with its simplicity and power users with its advanced features.
  • Proactive Insights: Data monitoring and alerts help businesses move from reactive to proactive strategies.

Pricing and Plans

InsightBase offers a tiered pricing structure to suit different needs, from individuals to large enterprises. A free trial is available to test the platform.

  • Individual Plan: $27/month. Ideal for individuals or small projects, includes 10,000 credits (~500 queries), 1 data source, and 1 user.
  • Starter Plan: $97/month. Designed for startups and small teams, includes 40,000 credits (~2,000 queries), 2 data sources, and 5 users.
  • Professional Plan: $300/month. Suited for growing businesses, offering 120,000 credits (~6,000 queries), 5 data sources, and 15 users.
  • Enterprise Plan: Custom pricing. For data-driven companies with extensive needs, this plan offers unlimited credits, data sources, users, and full features like whitelabeling and self-hosting.

All paid plans include API access, embeddable dashboards, auto-refreshing widgets, and data monitoring.

Positioning

Their taxonomy shows where the products overlap and where each one has a more distinct focus. Unknown fields are shown explicitly and are never filled with assumptions.

Categories

Shared
Business IntelligenceData AnalysisNo Code
Only Findly
No listed items
Only InsightBase
Database

Tags

Shared
business intelligencedata analysisdata visualizationno-codereporting
Only Findly
marketing analyticsnatural language queryself-service BIsemantic layertext to sql
Only InsightBase
AI chatanalyticsBIdashboarddatabaseSQL

Audience and roles

Shared
No listed items
Only Findly
No listed items
Only InsightBase
No listed items

Traffic comparison

Traffic is shown on the same scale so differences in market visibility are not visually understated.

How to interpret the traffic data

Both charts share the same months and vertical scale. Each tool identifies its latest reporting month; missing months are left blank, not counted as zero. Regional and source visit counts are estimates calculated from the reported shares.

Findly monthly traffic:

Latest traffic · 2026-05

Monthly visits
4.8K
Avg. visit duration
0:14
Pages per visit
1.79
Bounce rate
40.74%
Data updated 2026-06-15

Monthly traffic trend

  • 2025-09: 7.4K
  • 2026-01: 5.6K
  • 2026-02: 5.8K
  • 2026-03: 8.1K
  • 2026-04: 8.1K
  • 2026-05: 4.8K

Top regions

Top 5 countries/regions
Country/regionPercentageEstimated visits
🇺🇸United States43.39%2.1K
🇬🇧United Kingdom29.93%1.4K
🇲🇽Mexico11.31%546
🇮🇳India10.57%511
🇵🇱Poland4.8%232

Search keywords

darling aidarlink aifindlyfindly did itfindsly

InsightBase

No data available

Community signals

Ratings, comments, favorites, and likes are community signals—not a substitute for product fit.

Findly

Rating
No data available
Comments
0
Favorites
172
Likes
176

InsightBase

Rating
No data available
Comments
0
Favorites
142
Likes
151

Findly vs InsightBase · Comparison FAQ

What do Findly and InsightBase have in common?
Both tools are listed under Business Intelligence、Data Analysis、No Code. These categories indicate overlapping use cases; compare their detailed descriptions for workflows, capabilities and limitations.
Are Findly and InsightBase free?
Listed pricing models: Findly — Freemium; InsightBase — Freemium. Missing pricing is not proof of a free plan, and freemium does not mean every feature is free. Check official sites for current plans, limits and trials.
How should I choose between Findly and InsightBase?
The primary listed category is Business Intelligence for Findly, and Business Intelligence for InsightBase. Compare features, steps and use cases, then verify pricing, data permissions and deployment needs. This page does not include hands-on testing and does not declare a winner from traffic or tags.

Sources and comparison methodology

This page is assembled from ToolMage product listings, taxonomy, traffic statistics and on-site user feedback. It is not a hands-on test or an independent review.

  • Feature and plan descriptions reflect information in the listings, not real-time guarantees. Verify pricing, quotas, availability and privacy terms on the official sites.
  • Traffic uses the reporting months shown. Missing statistics do not mean zero visits, and different periods do not establish growth or superiority. Regional and source visit counts are estimates based on shares.
  • Different tags indicate differences in the listings, not proof that the other product lacks a capability. Ratings, favorites and visits are not used to declare a winner.

Related comparisons