
Pricing model: Freemium
AI TOOL COMPARISON
Graphitup vs Graphy
What is the difference, and which fits your workflow? Compare features, usage, pricing models and traffic side by side.


Graphy
3D
Product overview
Graphitup Product overview
Graphitup is an AI-powered data visualization tool that transforms raw data from Excel or Google Sheets into stunning, on-brand charts and interactive dashboards. It offers robust theming, extensive customization, and easy publishing options, enabling businesses and creators to tell compelling data stories and build lasting digital assets.
Preview

Graphy Product overview
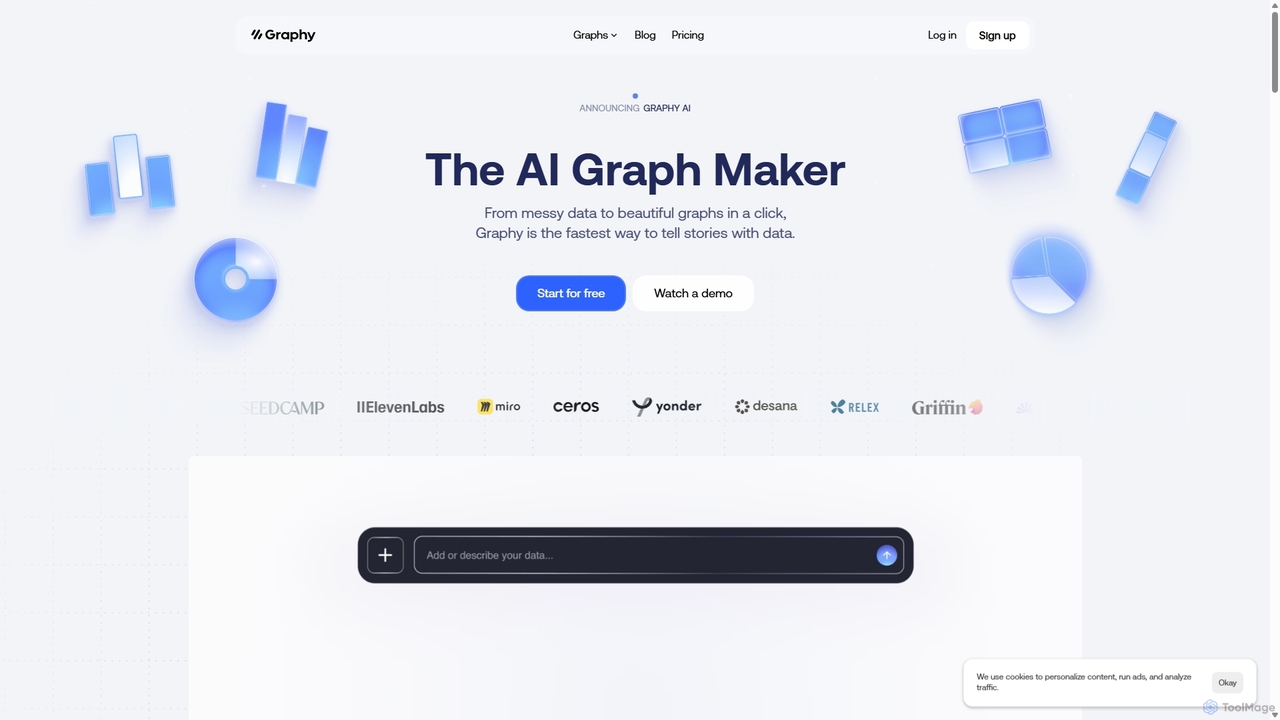
Graphy is an AI-powered data visualization tool that transforms raw data into beautiful, interactive charts and graphs in seconds. It simplifies data storytelling by automatically identifying key insights, allowing users to chat with their data, and offering extensive customization. Ideal for marketers, analysts, and teams who need to create compelling visual reports and presentations without complex software.
Preview
Quick facts
Compare product focus, pricing models and audiences. Highlighted rows indicate different listed information; unknown pricing does not mean free.
| Quick facts | Graphitup | Graphy |
|---|---|---|
| Pricing model | Freemium | Freemium |
| Product type | Web | Web |
| Primary focus | 3D | 3D |
| Audience and roles | Blogger · Business Owner · Content Creator · Data Analyst · Graphic Designer · Journalist · Marketing Manager · Product Manager | Business Owner · Consultant · Content Creator · Data Analyst · Finance Manager · Founder · Marketing Manager · Product Manager · Sales Representative · Social Media Manager |
| Categories | 3D · Content Creation · Presentation Tools | 3D · Business Intelligence · Reporting · Presentations |
| Added | Nov 16, 2025 | Sep 21, 2025 |
| Updated | Nov 19, 2026 | Nov 19, 2026 |
Features, usage and use cases
Explore the listed product descriptions, features and workflows. Taxonomy labels alone are not feature evaluations.
Graphitup
Graphitup is an innovative AI tool designed to revolutionize how businesses and creators analyze, design, and publish data visualizations. It empowers users to quickly convert complex data, whether from messy Excel spreadsheets or Google Sheets, into beautiful, insightful, and 100% on-brand charts and interactive dashboards. With its AI-driven analysis, Graphitup helps users uncover compelling stories within their data and presents dozens of visual recommendations.
How to use Graphitup
To use Graphitup, simply upload your data from sources like Excel, Google Sheets, CSV, or XLSX files. The AI will then analyze your data and suggest various visual recommendations. You can select your preferred story, customize every aspect of the chart using the robust editor, choosing from a massive library of pre-made themes or creating your own to match your brand. Finally, publish your interactive charts and dashboards anywhere using a public share link or universal embed code. Paid plans offer real-time data syncing from Google Sheets for dynamic updates.
Core Features of Graphitup
- AI-powered data analysis and visual recommendations
- Creation of on-brand charts, graphs, and dashboards
- Support for data from Excel, Google Sheets, CSV, and XLSX files
- Robust theming options and a massive library of pre-made themes
- Extensive customization capabilities for every chart element
- Interactive chart editor for fine-tuning visualizations
- Public share links and universal embed codes for publishing anywhere
- Google Drive Sync for seamless data integration (Creator & Growth plans)
- Unlimited AI Credits (Creator & Growth plans)
- Real-time data syncing from Google Sheets (Paid plans)
- High-resolution export options (PNG, JPEG, WEBM)
Use Cases for Graphitup
Graphitup is ideal for a wide range of applications, including marketing reports, sales analysis, project tracking, financial dashboards, and content creation. Businesses can use it to visualize customer metrics, revenue trends, and budget breakdowns. Authors, journalists, and bloggers can transform their data into compelling presentations and engaging content. It's perfect for anyone looking to communicate data efficiently, create professional-looking reports, or build interactive data experiences for their audience.
Advantages of Graphitup
The primary advantages of Graphitup include its AI-driven efficiency in turning data into insights, its unparalleled customization options for maintaining brand consistency, and its ease of use for both data analysis and publishing. It supports various data sources without altering the original data, offers a free tier to get started, and provides scalable plans for growing needs. The ability to create interactive, high-resolution visualizations and embed them universally makes it a powerful tool for enhancing digital assets and audience engagement.
Pricing and Plans
Graphitup offers a tiered pricing structure:
- Free: $0 per month, includes 5 charts, limited templates, limited themes, limited free AI credits, and 500 views per month.
- Creator: $16 per month, includes everything in Free, plus unlimited charts, full template database, full theme options, removal of Graphitup logo from interactive charts, Google Drive Sync, unlimited AI credits, and chat support, with 10,000 views per month.
- Growth: $40 per month, includes everything in Creator, plus 3 dashboards, with 100,000 views per month.
- Enterprise: Custom pricing (contact for details), includes unlimited views, unlimited charts, unlimited dashboards, and unlimited AI credits.
Graphy
Graphy is an innovative AI-powered platform designed to revolutionize data storytelling. It enables users to effortlessly convert messy, raw data into stunning, interactive, and shareable graphs with just a few clicks. Trusted by over 300,000 professionals, Graphy bridges the gap between complex datasets and clear, actionable insights, making it the fastest way to communicate stories with data. The platform is built for speed and simplicity, eliminating the need for cumbersome tools like pivot tables or advanced design skills. Whether for internal reporting, board memos, social media content, or client presentations, Graphy empowers teams to make faster, data-driven decisions and achieve stronger alignment.
How to use Graphy
Using Graphy is a straightforward, four-step process designed for maximum efficiency:
- Add Your Data: Begin by connecting your data source. Graphy offers multiple flexible options: link a live Google Sheet for automatic updates, upload a CSV or Excel file, paste values directly into the editor, use the API for programmatic integration, or even ask the AI to search for public data on a specific topic. The platform is designed to ingest data without requiring pre-formatting.
- Let AI Work Its Magic: Once your data is loaded, Graphy's powerful AI engine analyzes the dataset to automatically identify and highlight the most significant insights. You can also interact with your data using a natural language chat interface. Ask questions like "What were the top 5 performing products last quarter?" and Graphy will generate the appropriate chart and insights instantly. The process is transparent, so you can always see how the AI arrived at its conclusions.
- Make Your Data Shine: Customize your charts to match your brand's aesthetic. Instantly apply your company's colors and fonts to all your visualizations. Use powerful annotations, trend lines, and callouts to draw attention to key data points and narrate the story behind the numbers.
- Tell Your Story: Share your completed graphs with ease. You can export high-quality static images for presentations and reports or embed live, interactive charts directly into tools like Notion, Canva, ClickUp, or your own website. This ensures your audience can engage with the data in a meaningful way, right where they work.
Core Features of Graphy
- AI Graph Maker: Automatically transforms raw data into polished, presentation-ready graphs.
- AI-Powered Insights: The data engine reads your dataset and surfaces key trends and patterns, saving hours of manual analysis.
- Chat with Data: A conversational interface that allows you to ask questions in natural language to get instant answers, charts, and insights.
- Multiple Data Sources: Connect data from Google Sheets, CSV/Excel files, direct paste, or via API.
- Extensive Chart Library: Create a wide variety of charts, including bar, line, pie, donut, funnel, heatmap, time series, and many more.
- Advanced Customization: Full control over branding with custom colors, fonts, and themes. Add annotations, trendlines, and goal markers to enhance your story.
- Seamless Sharing & Embedding: Export charts as images or embed interactive versions into websites, documents, and other productivity tools.
- Team Collaboration: Invite colleagues to view, edit, and collaborate on chart projects in real-time.
- Brand Kits: (Business Plan) Centralize brand assets to ensure consistency across all team-created visualizations.
- Automated Data Refresh: (Business Plan) Automatically syncs data from connected Google Sheets to keep your charts always up-to-date.
Use Cases for Graphy
Graphy is versatile and valuable for various professional roles:
- Marketing Teams: Create compelling visuals for social media posts, newsletters, and campaign performance reports that capture audience attention.
- Finance & Operations: Transform dense financial spreadsheets into clear, digestible charts for internal reporting, board meetings, and investor updates.
- Product Managers: Visualize user data, track feature adoption, and communicate product performance to stakeholders.
- Founders & Executives: Quickly create high-impact charts to tell a compelling story to investors, the board, and the entire company.
- Consultants & Analysts: Deliver professional, data-driven insights to clients with beautifully branded and easy-to-understand visualizations.
Advantages of Graphy
Graphy stands out from traditional data tools by focusing on storytelling and ease of use. Its key advantages include incredible speed, transforming days of reporting work into hours. The AI-driven approach automates analysis and visualization, making it accessible to users without a technical background. Unlike passive BI tools, Graphy helps you actively build a narrative with context and commentary, leading to clearer communication and stronger alignment. The final output is consistently beautiful and professional, elevating the quality of any report or presentation.
Pricing and Plans
Graphy offers a freemium model with plans to suit different needs:
- Free Plan: Perfect for individuals. Includes unlimited charts, the ability to share anywhere, and limited AI use. Charts created on this plan will have a Graphy watermark.
- Plus Plan: Priced at $16 per user/month (billed annually). Ideal for professionals and internal reporting. Includes everything in Free, plus custom colors, removal of the Graphy logo, and unlimited AI features.
- Business Plan: Priced at $36 per user/month (billed annually). Best for teams. Includes everything in Plus, plus automatic Google Sheets refresh, password-protected links, and centralized brand kits.
- Enterprise/SDK: Custom pricing for businesses looking to integrate Graphy's powerful data storytelling capabilities directly into their own platform via SDK and Embed APIs.
Positioning
Their taxonomy shows where the products overlap and where each one has a more distinct focus. Unknown fields are shown explicitly and are never filled with assumptions.
Categories
Shared
3D
Only Graphitup
Content CreationPresentation Tools
Only Graphy
Business IntelligenceReportingPresentations
Tags
Shared
business intelligenceData Storytellingdata visualizationexcelGoogle Sheetsreporting
Only Graphitup
AI analysisbar chartsbrandingchartscontent creationcustomizationDashboardsdata insightsembedgraphsinteractiveline chartsmarketingpie chartspresentation
Only Graphy
AIchart makerdashboarddata analysisgraph makerinteractive charts
Audience and roles
Shared
Business OwnerContent CreatorData AnalystMarketing ManagerProduct Manager
Only Graphitup
BloggerGraphic DesignerJournalist
Only Graphy
ConsultantFinance ManagerFounderSales RepresentativeSocial Media Manager
Traffic comparison
Traffic is shown on the same scale so differences in market visibility are not visually understated.
How to interpret the traffic data
Both charts share the same months and vertical scale. Each tool identifies its latest reporting month; missing months are left blank, not counted as zero. Regional and source visit counts are estimates calculated from the reported shares.
Graphitup monthly traffic:
Latest traffic · 2026-05
Monthly visits
4.1K
Avg. visit duration
0:08
Pages per visit
1.74
Bounce rate
45.79%
Data updated 2026-06-15
Monthly traffic trend
- 2025-09: No data available
- 2026-01: 6.3K
- 2026-02: 6.8K
- 2026-03: 3.1K
- 2026-04: 1.5K
- 2026-05: 4.1K
Top regions
Top 5 countries/regions
| Country/region | Percentage | Estimated visits |
|---|---|---|
| 🇺🇸United States | 88.31% | 3.6K |
| 🇨🇦Canada | 11.69% | 475 |
Search keywords
gauge chart generatorgraph maker aigraph maker onlinepie chart makerкруговая диаграмма онлайн
Graphy monthly traffic:
Latest traffic · 2026-05
Monthly visits
167.6K
Avg. visit duration
1:18
Pages per visit
4.38
Bounce rate
38.75%
Data updated 2026-06-15
Monthly traffic trend
- 2025-09: 155.2K
- 2026-01: 177.6K
- 2026-02: 154.1K
- 2026-03: 164K
- 2026-04: 200.4K
- 2026-05: 167.6K
Top regions
Top 5 countries/regions
| Country/region | Percentage | Estimated visits |
|---|---|---|
| 🇮🇳India | 34.73% | 58.2K |
| 🇰🇭Cambodia | 29.22% | 49K |
| 🇺🇸United States | 20.57% | 34.5K |
| 🇷🇺Russia | 8.1% | 13.6K |
| 🇲🇾Malaysia | 7.38% | 12.4K |
Traffic sources
| Source type | Percentage | Estimated visits |
|---|---|---|
| Direct | 86.47% | 144.9K |
| Referral | 11.57% | 19.4K |
| 1.96% | 3.3K |
Search keywords
graph aigraph generatorgraph makergraphygraphy ai
Community signals
Ratings, comments, favorites, and likes are community signals—not a substitute for product fit.
Graphitup
Rating
No data available
Comments
0
Favorites
176
Likes
170
Graphy
Rating
No data available
Comments
0
Favorites
175
Likes
192
Graphitup vs Graphy · Comparison FAQ
What do Graphitup and Graphy have in common?
Both tools are listed under 3D. These categories indicate overlapping use cases; compare their detailed descriptions for workflows, capabilities and limitations.
Are Graphitup and Graphy free?
Listed pricing models: Graphitup — Freemium; Graphy — Freemium. Missing pricing is not proof of a free plan, and freemium does not mean every feature is free. Check official sites for current plans, limits and trials.
How should I choose between Graphitup and Graphy?
The primary listed category is 3D for Graphitup, and 3D for Graphy. Compare features, steps and use cases, then verify pricing, data permissions and deployment needs. This page does not include hands-on testing and does not declare a winner from traffic or tags.
Graphitup · Comparison FAQ
Do your charts publish in realtime when I update my spreadsheets?
Yes, for users with paid plans, Graphitup offers real-time data syncing from Google Sheets. This feature is highly valuable for those working with dynamic data, ensuring your charts reflect the latest information.
What kinds of data do you support?
Graphitup works with various data sources, including messy Excel files, Google Sheets, CSV files, and XLSX files. You can upload your data or connect directly to Google Drive for seamless integration.
What if I don’t have any data yet?
Graphitup is designed to help you visualize your existing data. While the platform doesn't provide sample data, you can explore its features and templates to understand how it can transform your future datasets once you have them.
What kinds of charts do you support?
Graphitup supports a wide range of visualizations, including Charts, Graphs, Dashboards, and Calculators. Specifically, it offers makers for Line Charts, Stacked Bar Graphs, and Pie Charts, among others, to help you tell diverse data stories.
What platforms can I publish my charts on?
You can publish your charts anywhere using a public share link or a universal embed code. This allows for flexible integration into websites, reports, presentations, or even custom applications.
Sources and comparison methodology
This page is assembled from ToolMage product listings, taxonomy, traffic statistics and on-site user feedback. It is not a hands-on test or an independent review.
Graphitup
- Product information updated
- Traffic reporting month
- 2026-05
Graphy
- Product information updated
- Traffic reporting month
- 2026-05
- Feature and plan descriptions reflect information in the listings, not real-time guarantees. Verify pricing, quotas, availability and privacy terms on the official sites.
- Traffic uses the reporting months shown. Missing statistics do not mean zero visits, and different periods do not establish growth or superiority. Regional and source visit counts are estimates based on shares.
- Different tags indicate differences in the listings, not proof that the other product lacks a capability. Ratings, favorites and visits are not used to declare a winner.