

ToolMage
Sign in
Chart
Api · 82 monthly visits

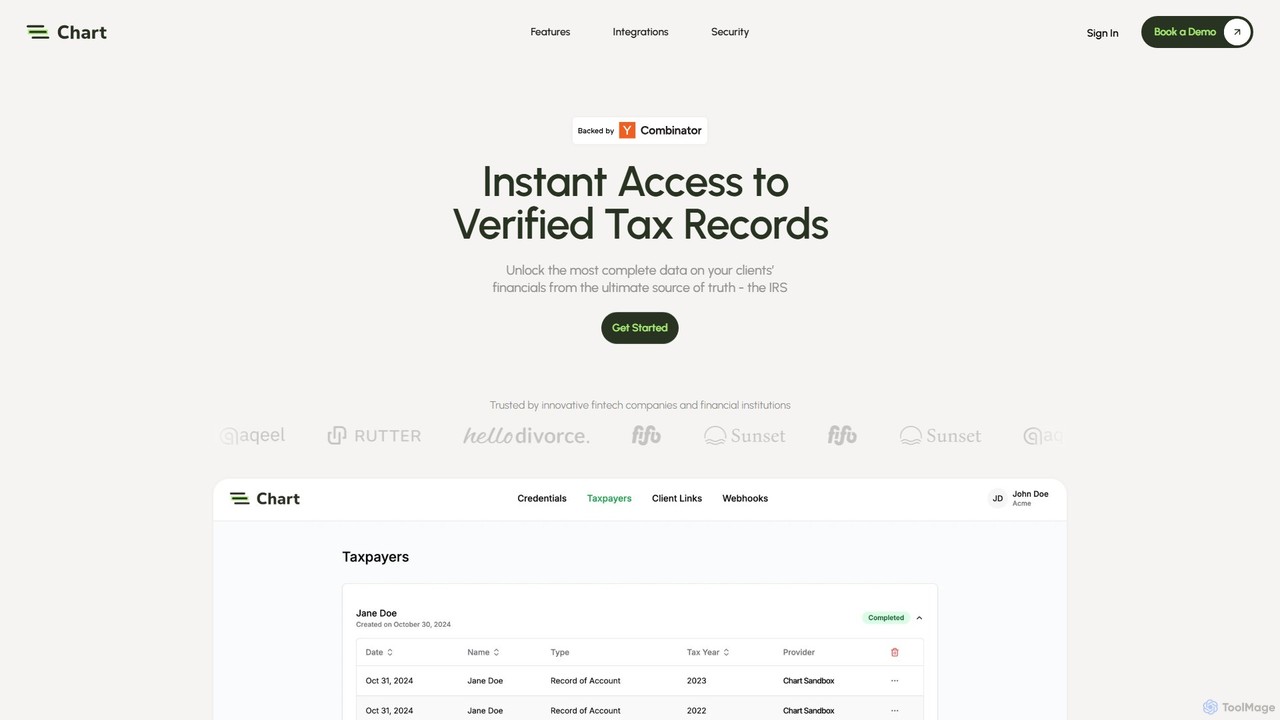
Chart is a developer-focused platform providing instant, real-time access to verified IRS tax records. It empowers fintech companies and financial institutions to automate income verification and streamline client onboarding. By connecting directly to the IRS and tax preparation software, Chart delivers structured JSON data, ensuring accuracy and eliminating fraud with a secure, SOC 2 Type II compliant solution.

VS
Pluggy
Api · 440K monthly visits

Pluggy is an Open Finance API platform that allows developers to connect to users' financial accounts. It provides a single API to access aggregated financial data, including transactions, balances, and investments, and to initiate instant payments via PIX.

Chart vs Pluggy: pricing, features, traffic, and use cases

Compare Chart and Pluggy across positioning, pricing, traffic, and user feedback using structured factual data.

Updated Aug 5, 2026

Product overview

Chart Product overview

Chart is a developer-focused platform providing instant, real-time access to verified IRS tax records. It empowers fintech companies and financial institutions to automate income verification and streamline client onboarding. By connecting directly to the IRS and tax preparation software, Chart delivers structured JSON data, ensuring accuracy and eliminating fraud with a secure, SOC 2 Type II compliant solution.

Preview

Pluggy Product overview

Pluggy is an Open Finance API platform that allows developers to connect to users' financial accounts. It provides a single API to access aggregated financial data, including transactions, balances, and investments, and to initiate instant payments via PIX.

Preview

Detailed feature comparison

FeatureChartPluggy
Primary categoryApiApi
Added2025-08-092025-08-14
PricingPaidFreemium
Official websitewww.trychart.comwww.pluggy.ai
Product typeWebsiteWebsite
Performance data
User ratingNot verifiedNot verified
Comments00
Monthly visits82440K
Monthly growth-87.1%13.3%
Favorites97117
DetailsView detailsView details

Chart vs Pluggy monthly traffic

Compare Chart and Pluggy by monthly reach, traffic trend, visit depth, top regions, and acquisition sources.

How to interpret the traffic data

In the Chart vs Pluggy monthly traffic comparison, Chart currently shows 82 visits and Pluggy shows 440K; Pluggy has about 5,365.4 times the visible traffic of Chart, an absolute difference of about 439.9K visits. This reflects visible reach, not feature quality or paid users.

Both tools provide verified traffic details, so monthly trends, visit depth, regions, and acquisition sources can be compared on the same basis.

Chart monthly traffic:

Latest traffic

Monthly visits
82
Avg. visit duration
0:00
Pages per visit
1.09
Bounce rate
34.36%
Data updated 2026-06-11

Monthly traffic trend

  • 2025/8: 1.4K Monthly visits
  • 2025/9: 363 Monthly visits
  • 2026/2: 0 Monthly visits
  • 2026/3: 0 Monthly visits
  • 2026/4: 637 Monthly visits
  • 2026/5: 82 Monthly visits

Search keywords

chart tax retursntrychart

Pluggy monthly traffic:

Latest traffic

Monthly visits
440K
Avg. visit duration
3:18
Pages per visit
4.03
Bounce rate
21.39%
Data updated 2026-06-11

Monthly traffic trend

  • 2025/9: 35.7K Monthly visits
  • 2026/1: 74.2K Monthly visits
  • 2026/2: 71.3K Monthly visits
  • 2026/3: 117.1K Monthly visits
  • 2026/4: 388.5K Monthly visits
  • 2026/5: 440K Monthly visits

Top regions

Top 5 countries/regions
Country/regionPercentageTraffic
🇧🇷Brazil98.99%435.5K
🇺🇸United States0.7%3.1K
🇮🇳India0.25%1.1K
🇨🇦Canada0.04%176
🇪🇸Spain0.02%88

Traffic sources

Source typePercentageTraffic
Direct62.85%276.5K
Referral34.26%150.7K
Email2.89%12.7K

Search keywords

meupluggyopen financepluggypluggy apipluggy open finance
Traffic-based selection guidance: If public market visibility is an important first-pass criterion, investigate Pluggy first. The final choice should still follow taxonomy, use case, and a real trial because higher traffic does not prove broader capabilities or better workflow fit.

Usage comparison

Compare the core capabilities of Chart and Pluggy

Chart Core features

Api
Verification
Automation

Pluggy Core features

Api
Open Banking
Data Aggregation

Use cases

Chart Use cases

API
developer tools
financial data
fintech
automation
FCRA
income verification
IRS data
SOC 2
tax records
underwriting

Pluggy Use cases

API
developer tools
financial data
fintech
brazil finance
data aggregation
open banking
open finance
payment initiation
pix

Chart vs Pluggy:In-depth comparison and selection guidance

First decide whether the products solve the same kind of need

This in-depth Chart vs Pluggy comparison uses only the product records, taxonomy, audience, traffic, and community signals available on this page. Chart is primarily listed under “Api”, while Pluggy is primarily listed under “Api”, so the first decision is whether your actual task matches their recorded scope.

The structured fields currently show these decision-relevant differences: Pricing (Chart: Paid; Pluggy: Freemium); Monthly visits (Chart: 82; Pluggy: 440K); Monthly growth (Chart: -87.1%; Pluggy: 13.3%); Favorites (Chart: 97; Pluggy: 117); Website (Chart: www.trychart.com; Pluggy: www.pluggy.ai). These facts are more useful for selection than brand visibility alone.

What market visibility and monthly traffic mean

In the Chart vs Pluggy monthly traffic comparison, Chart currently shows 82 visits and Pluggy shows 440K; Pluggy has about 5,365.4 times the visible traffic of Chart, an absolute difference of about 439.9K visits. This reflects visible reach, not feature quality or paid users.

Both tools provide verified traffic details, so monthly trends, visit depth, regions, and acquisition sources can be compared on the same basis.

If public market visibility is an important first-pass criterion, investigate Pluggy first. The final choice should still follow taxonomy, use case, and a real trial because higher traffic does not prove broader capabilities or better workflow fit.

Product positioning, use cases, and roles

Chart and Pluggy currently overlap in shared categories: Api; shared tags: API, developer tools, financial data, and fintech. This can place both on the same shortlist, but it does not prove equal implementation, depth, or cost.

Chart's unique categories/tags are Verification, Automation, automation, FCRA, income verification, IRS data, SOC 2, and tax records; Pluggy's are Open Banking, Data Aggregation, brazil finance, data aggregation, open banking, open finance, payment initiation, and pix. These unique fields are the strongest differentiators: validate the product whose recorded scope matches the task instead of following traffic alone.

What ratings, comments, and favorites can tell you

Chart has no verified rating, 0 comments, 97 favorites, and 102 likes;Pluggy has no verified rating, 0 comments, 117 favorites, and 116 likes。

Neither product has enough rating or comment samples for a credible reputation ranking.

Selection guidance by actual need

When to evaluate Chart first

Put Chart on the priority trial list when the task aligns with “Api” and especially Verification, Automation, automation, FCRA, income verification, and IRS data. This follows recorded positioning and does not imply unlisted capabilities are absent.

Chart also currently records: pricing is paid, product type is website, 82 verified monthly visits, no verified user rating. Verify any hard requirement around price, platform, or reach before trial, and do not let sparse review data substitute for testing.

When to evaluate Pluggy first

Put Pluggy on the priority trial list when the task aligns with “Api” and especially Open Banking, Data Aggregation, brazil finance, data aggregation, open banking, and open finance. This follows recorded positioning and does not imply unlisted capabilities are absent.

Pluggy also currently records: pricing is freemium, product type is website, 440K verified monthly visits, no verified user rating. Verify any hard requirement around price, platform, or reach before trial, and do not let sparse review data substitute for testing.

How to validate the recommendation before deciding

The available data describes positioning, public visibility, and community signals, but it cannot prove output quality, speed, integration effort, privacy, or long-term cost in your workflow. Before deciding, run the same representative tasks in Chart and Pluggy, then record completion time, accuracy, manual corrections, and the real paid threshold. A like-for-like trial turns this comparison into a defensible adoption decision.

Comparison FAQ

How should I choose between Chart and Pluggy?
Compare positioning, pricing, taxonomy, and traffic maturity, then verify the latest details on each official website.
Where does this comparison data come from?
The factual baseline is derived from product, taxonomy, traffic, and community data. Reviewed editorial conclusions show their source and verification date.
What do unknown fields mean?
Unknown means there is not enough reliable evidence; the page does not fill gaps with assumptions.