
Typo
Business Intelligence
AI TOOL COMPARISON
What is the difference, and which fits your workflow? Compare features, usage, pricing models and traffic side by side.
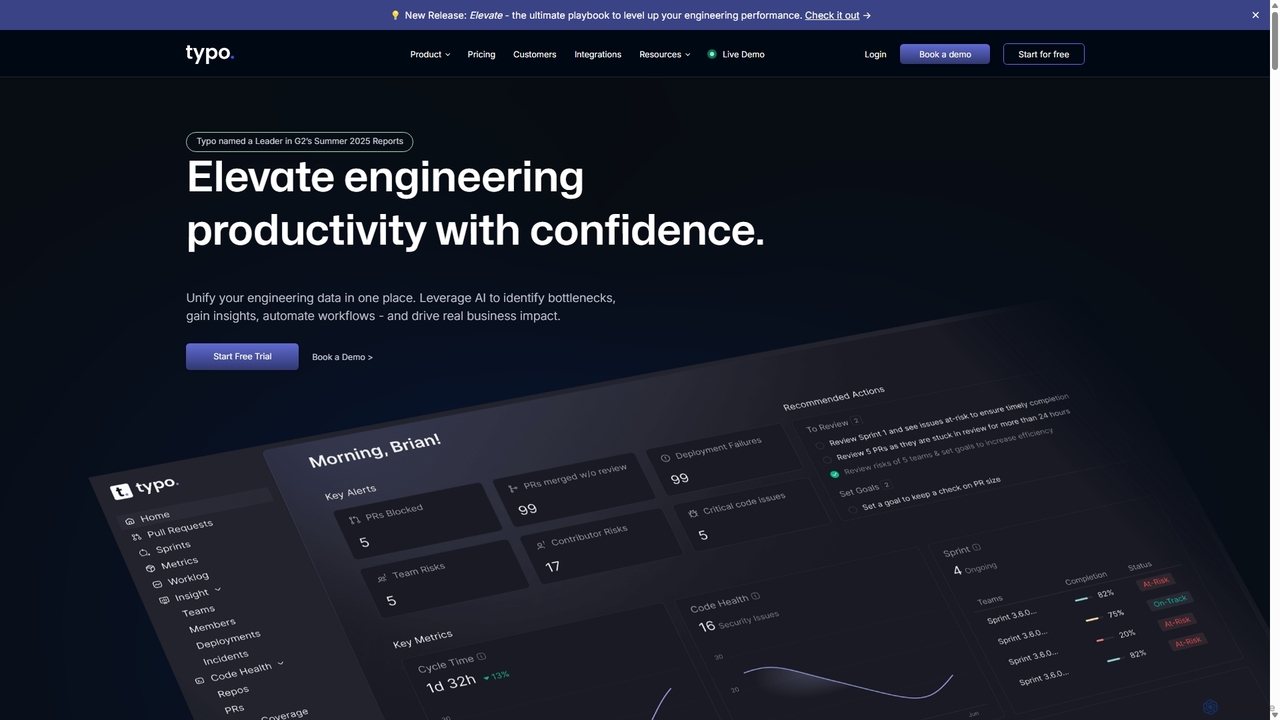
Typo is an AI-powered engineering intelligence platform designed to enhance software delivery and developer productivity. It centralizes data from across the SDLC, providing engineering leaders with actionable insights through DORA metrics, cycle time analysis, and DevEx surveys. With features like AI code reviews and burnout alerts, Typo helps teams identify bottlenecks, improve workflows, and build a high-performing, data-driven engineering culture.
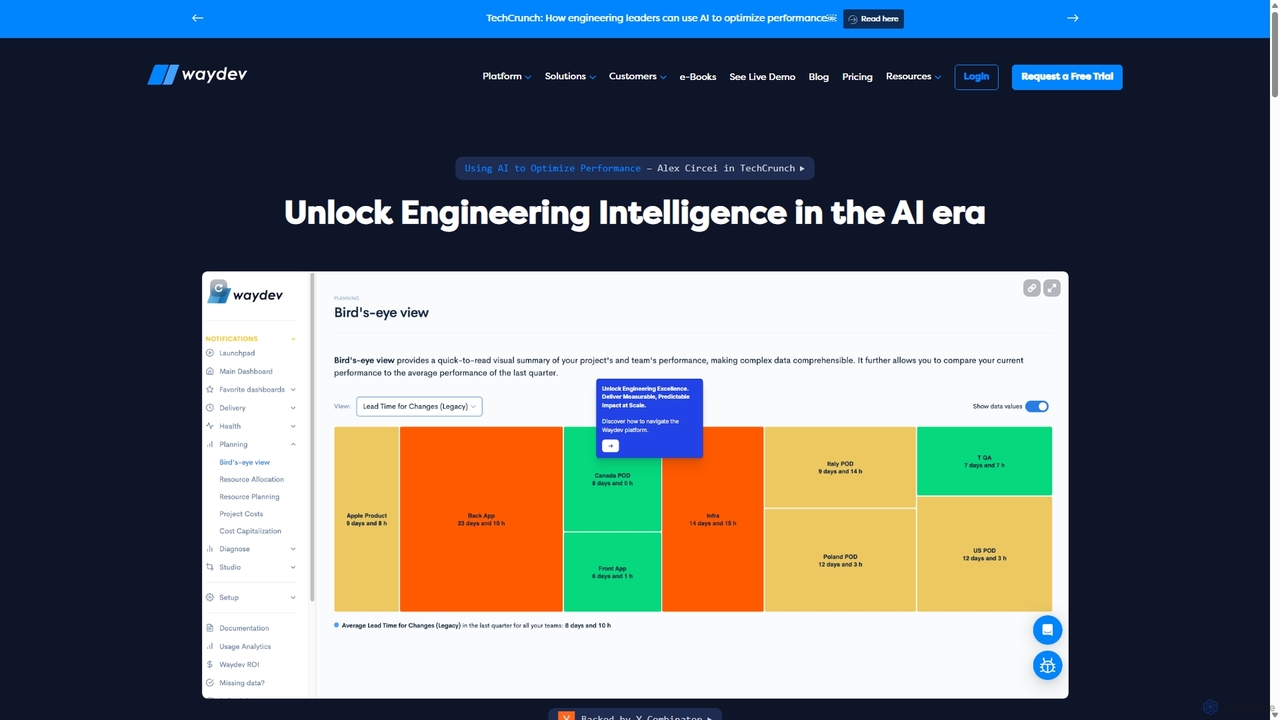
Waydev is an AI-powered engineering intelligence platform that provides visibility into software development processes. It analyzes data from Git, CI/CD, and project management tools to deliver insights based on DORA and SPACE frameworks, helping teams optimize productivity, accelerate delivery, and align engineering work with business goals.
Compare product focus, pricing models and audiences. Highlighted rows indicate different listed information; unknown pricing does not mean free.
| Quick facts | Typo | Waydev |
|---|---|---|
| Pricing model | Freemium | Paid |
| Product type | Web | Web |
| Primary focus | Business Intelligence | Business Intelligence |
| Audience and roles | CTO · DevOps Engineer · Engineering Manager · Product Manager · Software Developer · Tech Lead · VP of Engineering | CTO · Data Analyst · DevOps Engineer · Engineering Manager · Product Manager · Software Developer · VP of Engineering |
| Categories | Business Intelligence · Code Quality · Engineering Intelligence · Project Management | Business Intelligence · Code Quality · Project Management |
| Added | Sep 18, 2025 | Sep 16, 2025 |
| Updated | Nov 19, 2026 | Nov 19, 2026 |
Explore the listed product descriptions, features and workflows. Taxonomy labels alone are not feature evaluations.
Typo is a comprehensive AI-powered engineering intelligence platform that provides end-to-end visibility into the software development lifecycle (SDLC). It is designed for modern engineering leaders, including CTOs, VPs of Engineering, and Engineering Managers, who need to move beyond gut feelings and make data-driven decisions. By integrating with your existing development toolchain—such as Git, Jira, CI/CD pipelines, and Slack—Typo centralizes engineering, delivery, and team-health metrics into a single, intuitive dashboard. This unified view helps teams identify bottlenecks, streamline workflows, and accelerate software delivery while maintaining high quality and improving developer well-being.
Inspired by industry-leading frameworks like DORA (DevOps Research and Assessment) and SPACE, Typo offers a holistic perspective on engineering performance. It doesn't just track output; it measures outcomes and the overall health of the development process. The platform uses AI to provide predictive insights, automate tedious tasks like code reviews, and proactively alert managers to potential issues like developer burnout. This allows engineering teams to focus on what they do best: building innovative and reliable software.
Getting started with Typo is a straightforward process designed to deliver value quickly:
For CTOs and VPs of Engineering: Gain a high-level, strategic overview of the entire engineering organization's health and performance. Align engineering initiatives with business outcomes, justify R&D investments, and track ROI on technical projects.
For Engineering Managers: Identify and resolve team-level bottlenecks in real-time. Use objective data to facilitate more effective sprint retrospectives and 1-on-1s. Balance workloads, monitor for burnout, and coach developers toward continuous improvement.
For Developers: Receive fast, objective feedback on code quality through AI reviews. Understand the impact of their work on team goals and reduce friction in the PR process. Gain insights into personal work patterns to improve focus and efficiency.
Unified Visibility: Typo eliminates data silos by bringing all your engineering metrics into one platform, providing a single source of truth for performance and health.
Actionable, Not Just Observational: The platform doesn't just show you data; it provides AI-driven insights, auto-fixes, and predictive alerts to help you take meaningful action.
Holistic Approach: By combining performance metrics (DORA, Cycle Time) with well-being metrics (DevEx, Burnout Alerts), Typo ensures you are building a sustainable, high-performing team.
Cost-Effective: Testimonials highlight that Typo offers a powerful value proposition compared to more expensive competitors, making engineering intelligence accessible to more teams.
Fosters a Positive Culture: By focusing on team-level metrics and providing objective data, Typo helps create a culture of transparency, accountability, and continuous improvement, rather than micromanagement.
Typo offers a flexible pricing structure to suit teams of different sizes.
A 14-day free trial is available for the Pro plan, allowing teams to explore the full range of features.
Waydev is a comprehensive software engineering intelligence platform designed to bring clarity and data-driven insights to the entire software development lifecycle (SDLC). Backed by Y Combinator, it empowers engineering leaders, managers, and executives to make informed decisions by transforming raw data from their existing toolstack into actionable metrics and reports. By leveraging AI and established frameworks like DORA and the SPACE framework, Waydev makes the invisible work of engineering teams visible, fostering a culture of continuous improvement and aligning technical output with strategic business objectives.
The platform integrates seamlessly with your development ecosystem, pulling data from Git repositories (GitHub, GitLab, Bitbucket, Azure DevOps), project management systems (Jira, ClickUp), and CI/CD pipelines. This creates a single source of truth, eliminating the need for manual reporting and providing real-time visibility into team performance, project health, and operational efficiency. Waydev helps organizations answer critical questions about their development process, such as identifying bottlenecks, managing resource allocation, tracking project costs, and improving the overall developer experience (DX).
1. Integrate Your Toolstack: Connect Waydev to your existing engineering tools, including Git providers, ticketing systems, and CI/CD pipelines. The platform supports both cloud and on-premise versions for enterprise needs. The integration process is secure and straightforward, using tokens to access metadata without storing your source code.
2. Automated Data Analysis: Once connected, Waydev automatically analyzes the metadata from your tools. It processes commits, pull requests, tickets, and deployment data to calculate key performance metrics.
3. Explore Dashboards and Reports: Navigate through various modules like Delivery, Health, and Planning. Use pre-built dashboards to monitor DORA metrics (Deployment Frequency, Lead Time for Changes, etc.), Cycle Time, and team performance. Executives can use high-level reports for resource planning and project cost analysis.
4. Customize and Configure: Tailor the platform to your needs. Create custom dashboards to visualize the metrics that matter most to your organization. Define custom metrics, set targets, and configure automated alerts to be notified of important events or deviations via Slack or other communication tools.
5. Leverage AI Insights: Utilize the AI-powered features like the AI Coach and AI Predictability to get proactive recommendations and forecasts. Use the Developer Experience (DX) module to gather qualitative feedback from your team through surveys, combining it with quantitative data for a holistic view.
For C-Level Executives: Align engineering initiatives with business goals, track the ROI of development efforts through project cost reports, and communicate progress to stakeholders with clear, data-backed visuals.
For Engineering Managers: Make better, data-driven decisions to optimize team workflows. Identify and resolve bottlenecks in the code review process, balance workloads, and use objective metrics for performance reviews and coaching.
For Product Leaders: Use data to improve product strategy by understanding the development velocity for new features, tracking sprint commitments, and ensuring the product roadmap is aligned with engineering capacity.
For Contributors/Developers: Keep track of personal performance and contributions, understand their impact on team goals, and use data to showcase their work and growth.
Complete Visibility: Transforms opaque development processes into a clear, data-driven story of progress and performance.
Actionable Insights: Goes beyond raw data to provide context and recommendations, helping teams move from observation to optimization.
Increased Efficiency: Customers report significant improvements, including accelerated velocity, faster cycle times, and reduced unplanned work.
Business Alignment: Directly connects engineering output to business value by tracking costs and resource allocation against strategic initiatives.
Improved Developer Well-being: The DX module provides a channel for feedback, helping leaders create a better work environment and retain top talent.
Waydev offers three main pricing tiers, billed annually per active contributor:
A free trial is available for businesses to explore the platform's capabilities.
Their taxonomy shows where the products overlap and where each one has a more distinct focus. Unknown fields are shown explicitly and are never filled with assumptions.
Traffic is shown on the same scale so differences in market visibility are not visually understated.
Both charts share the same months and vertical scale. Each tool identifies its latest reporting month; missing months are left blank, not counted as zero. Regional and source visit counts are estimates calculated from the reported shares.
| Country/region | Percentage | Estimated visits |
|---|---|---|
| 🇮🇳India | 63.05% | 4.6K |
| 🇺🇸United States | 18.61% | 1.4K |
| 🇬🇧United Kingdom | 10.93% | 797 |
| 🇧🇷Brazil | 3.84% | 280 |
| 🇩🇪Germany | 3.57% | 260 |
| Source type | Percentage | Estimated visits |
|---|---|---|
| Direct | 95.02% | 6.9K |
| Referral | 3.45% | 252 |
| 1.53% | 112 |
| Country/region | Percentage | Estimated visits |
|---|---|---|
| 🇧🇷Brazil | 67.96% | 27.2K |
| 🇺🇸United States | 16.16% | 6.5K |
| 🇳🇬Nigeria | 5.97% | 2.4K |
| 🇺🇿Uzbekistan | 5.12% | 2K |
| 🇻🇳Vietnam | 4.79% | 1.9K |
| Source type | Percentage | Estimated visits |
|---|---|---|
| Direct | 95.4% | 38.1K |
| Referral | 2.89% | 1.2K |
| 1.71% | 684 |
Ratings, comments, favorites, and likes are community signals—not a substitute for product fit.
This page is assembled from ToolMage product listings, taxonomy, traffic statistics and on-site user feedback. It is not a hands-on test or an independent review.