ChatterQuant
ChatterQuant is an AI-powered platform for financial professionals, tracking social media discussions about stocks and crypto. It provides …
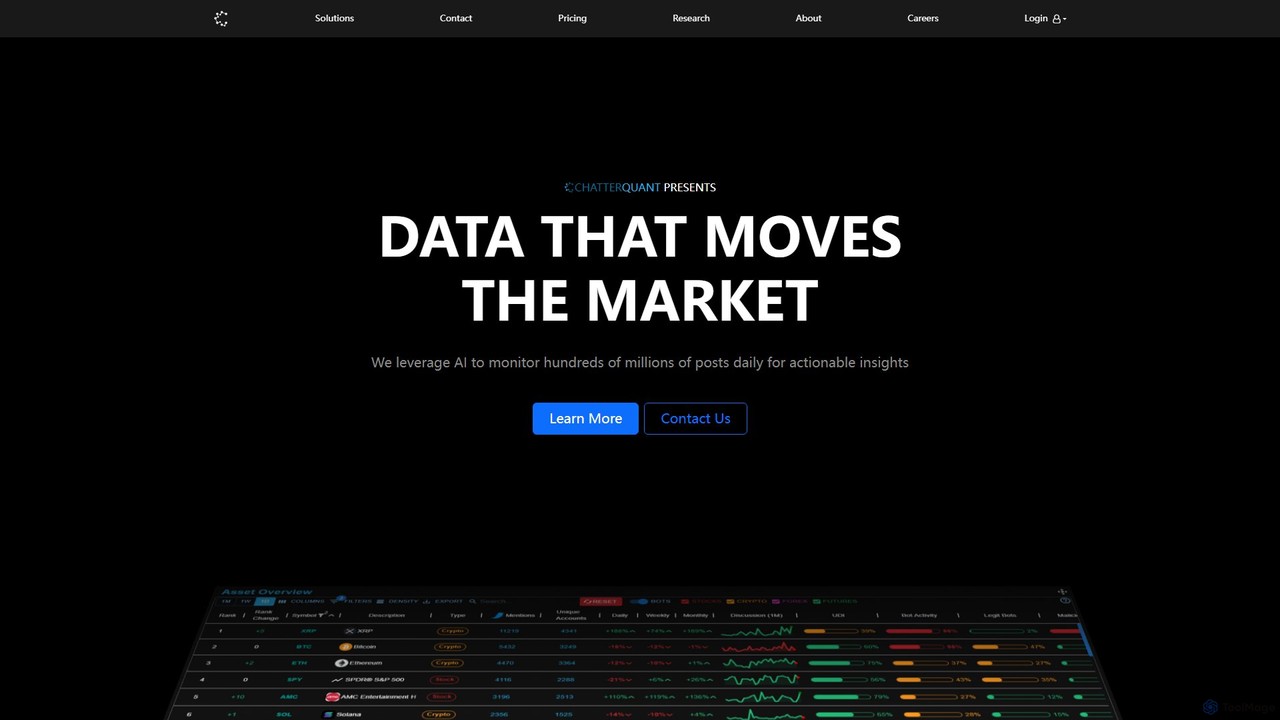
ChatterQuant is an AI-powered platform for financial professionals, tracking social media discussions about stocks and crypto. It provides actionable insights through advanced dashboards and APIs, helping users generate alpha, manage risk, and streamline due diligence by analyzing sentiment, bot activity, and market trends in real-time.
About Alternative Data
Alternative Data tools are AI-powered platforms designed to collect, process, and analyze non-traditional data sources for predictive insights. These tools utilize machine learning and NLP to extract valuable signals from vast, unstructured datasets like satellite imagery, web traffic, social media sentiment, and credit card transactions. They provide investors, analysts, and businesses with unique, real-time intelligence that is not available through conventional financial reports. This enables earlier trend detection, a more comprehensive market view, and a significant competitive edge in decision-making.
Core Features
- Data Source Aggregation: Connects to and ingests data from diverse sources like web scraping, satellite feeds, and social APIs.
- Unstructured Data Processing: Uses AI to structure and analyze text, images, geolocation data, and other complex formats.
- Predictive Signal Extraction: Identifies patterns and correlations that indicate future company performance or market shifts.
- Insight Visualization: Presents complex data findings through intuitive dashboards, heatmaps, and trend charts.
- API Access: Provides programmatic access to processed data and insights for integration into proprietary models.
Applicable Scenarios
These tools are predominantly used in the finance and investment sectors, including hedge funds and asset management firms, for generating alpha. They are also increasingly adopted in corporate strategy, market research, and supply chain management to monitor competitors, understand consumer behavior, and anticipate operational disruptions.
Selection Criteria
When choosing an Alternative Data tool, evaluate the breadth, depth, and historical availability of its data sources. Assess the sophistication of its AI models for signal extraction and the robustness of its API for integration. Crucially, verify that the data is sourced ethically and complies with privacy regulations like GDPR and CCPA.
Alternative DataUse Cases
Investment Signal Generation for Hedge Funds
A quantitative analyst at a hedge fund uses an alternative data platform to gain an edge in predicting retail company performance. Instead of waiting for quarterly earnings reports, the analyst subscribes to datasets that track real-time foot traffic at stores via anonymized mobile location data and satellite imagery of parking lots. The AI tool processes this raw data, adjusts for seasonality, and correlates it with historical sales figures. This generates a predictive signal indicating that a specific retailer's sales are likely to beat market expectations by 5%, allowing the fund to take a long position before the official earnings announcement.
Competitive Intelligence for Market Research
A market research firm for a consumer electronics brand wants to understand the market share dynamics of a new product launch. They use an alternative data tool to aggregate and analyze millions of online product reviews, social media mentions, and web traffic data for their own and competitors' websites. The AI's sentiment analysis reveals that a competitor's product is suffering from negative sentiment due to battery issues, while their own product is praised for its design. The web traffic analysis confirms a 15% higher engagement on their product page, providing actionable intelligence to double down on marketing efforts highlighting design and reliability.
Supply Chain Risk Monitoring and Prediction
A global logistics company uses an alternative data platform to proactively manage supply chain risks. The system continuously monitors satellite imagery of major ports, GPS data from cargo ships, and local news feeds from key manufacturing regions. When the AI detects an unusual buildup of ships outside a port combined with news reports of a local labor strike, it flags a high-risk disruption. This alert is triggered two weeks before official channels confirm the delay, giving the company enough time to reroute shipments through an alternative port, saving millions in potential losses and maintaining delivery schedules for their clients.
Analyzing Real Estate Market Trends
A real estate investment trust (REIT) aims to identify the next high-growth urban area. They use an alternative data tool that analyzes anonymized mobile geolocation data to map commuter patterns, identifies areas with increasing foot traffic to new cafes and shops, and tracks the volume of online searches for apartments in specific neighborhoods. The platform combines this with public data on building permits. The analysis highlights a previously overlooked neighborhood showing a 30% year-over-year increase in evening foot traffic and a spike in permits for residential renovations, signaling a gentrification trend and a prime investment opportunity.
Gauging Economic Health with Transaction Data
A government economic advisor needs a real-time indicator of consumer spending, which is faster than official monthly statistics. They use a platform that provides aggregated and anonymized credit and debit card transaction data. By analyzing spending patterns across different sectors (e.g., retail, travel, dining), they can identify early signs of economic slowdown or recovery. For instance, a sustained 10% drop in discretionary spending over two weeks could trigger a policy review, allowing for a more agile response to changing economic conditions long before traditional data would confirm the trend.
Tracking Brand Health and Public Perception
The corporate strategy team of a major airline wants to monitor its brand health in real-time. They employ an alternative data tool that scrapes and analyzes millions of data points from news articles, social media platforms, and review sites. The AI categorizes mentions by topic (e.g., price, service, safety) and sentiment. After a marketing campaign, the dashboard shows a 25% increase in positive sentiment related to 'customer service' but also flags a new, growing cluster of negative conversations about baggage fees. This allows the team to validate the campaign's success while simultaneously addressing a new customer pain point before it escalates into a major issue.