Multiplayer
Multiplayer is a full-stack session recording platform that captures frontend and backend data, providing complete context for debugging, …
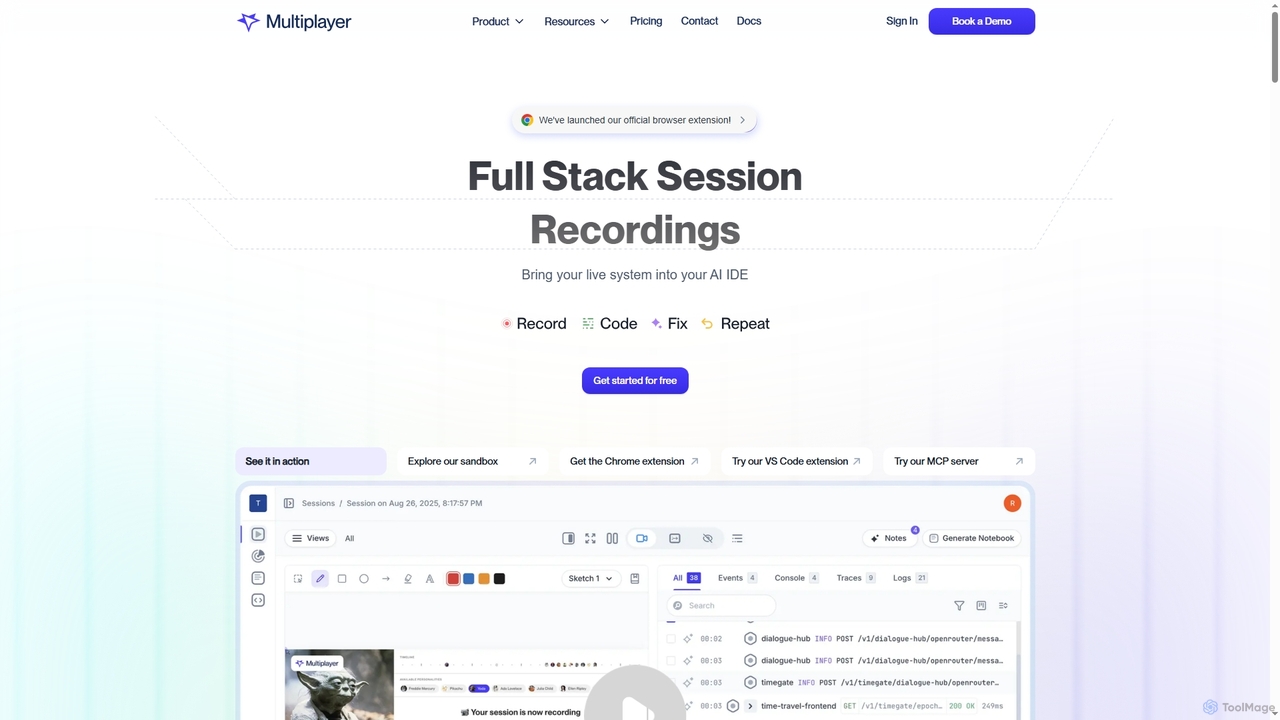
Multiplayer is a full-stack session recording platform that captures frontend and backend data, providing complete context for debugging, testing, and AI-powered feature development. It integrates seamlessly with AI IDEs and engineering workflows to accelerate problem resolution and build new features with confidence.
About Application Monitoring
Application Monitoring tools are a specialized category of software used to track the performance, availability, and user experience of software applications in real-time. As a core practice within the broader field of observability, these tools utilize techniques like distributed tracing and code-level profiling to provide deep insights into application behavior. They help development and operations teams identify performance bottlenecks, troubleshoot errors, and understand how code changes impact end-users. This proactive approach ensures application reliability and optimizes digital experiences.
Core Features
- Distributed Tracing: Follows a single user request across multiple microservices and components to pinpoint the source of delays or failures.
- Code-Level Diagnostics: Identifies slow or inefficient functions, database queries, and API calls directly within the application's source code.
- Real User Monitoring (RUM): Measures application performance from the perspective of the end-user's browser or device, capturing metrics like page load time.
- Service Mapping: Automatically discovers and visualizes the dependencies between application components, services, and infrastructure.
- Error Tracking and Alerting: Captures, groups, and provides context for application errors, notifying teams of critical issues in real-time.
Use Cases
Application Monitoring is crucial for any organization running business-critical software. It is heavily used by DevOps teams, Site Reliability Engineers (SREs), and software developers in industries like e-commerce, finance, and SaaS. Common scenarios include troubleshooting production incidents, optimizing database performance before a major sales event, and validating the performance of new features in a canary release.
How to Choose
When selecting an Application Monitoring tool, consider its support for your specific programming languages and frameworks. Evaluate the depth of its tracing and profiling capabilities. Assess its integration with your existing logging, alerting, and infrastructure monitoring systems. Finally, analyze the pricing model (e.g., per-host, per-transaction, or data volume) to ensure it aligns with your budget and usage patterns.
Application MonitoringUse Cases
Proactively Identify Performance Bottlenecks
A DevOps engineer for a high-traffic e-commerce platform notices a gradual increase in API response times. Using an Application Monitoring tool, they analyze distributed traces for the checkout process. The tool's service map highlights a specific microservice responsible for inventory checks as the source of the latency. By drilling down to the code-level diagnostics, they pinpoint an inefficient database query that runs on every request. They optimize the query and deploy the fix, reducing the average API response time by 60% and preventing a potential outage during peak shopping hours.
Rapidly Troubleshoot Production Incidents
A Site Reliability Engineer (SRE) receives an alert that error rates for a critical user authentication service have spiked. Instead of sifting through gigabytes of unstructured logs, the SRE opens the Application Monitoring dashboard. The tool has already correlated the spike in errors with a recent deployment. The distributed trace for a failed login request immediately shows a timeout when calling a newly updated downstream dependency. This allows the team to roll back the problematic change in minutes, rather than hours, restoring service and minimizing user impact.
Optimize Front-End User Experience
A front-end developer is tasked with improving the Core Web Vitals for a media-heavy website. They use the Real User Monitoring (RUM) feature of their Application Monitoring tool to analyze performance data from thousands of real user sessions. The RUM data reveals that the Largest Contentful Paint (LCP) is poor, particularly for users on mobile networks. The tool visualizes the page load waterfall, showing that unoptimized, high-resolution images are blocking the rendering path. Based on this data, the developer implements image compression and lazy loading, leading to a 40% improvement in LCP scores and a noticeable boost in SEO rankings.
Validate Performance of New Releases
A software team at a SaaS company is rolling out a major refactor of their billing service using a canary release strategy. They configure their Application Monitoring tool to compare key performance indicators (KPIs) like latency, error rate, and CPU usage between the old version (stable) and the new version (canary). The dashboard shows that while the canary version's latency is lower, its error rate is 5% higher under load. The team pauses the rollout, uses the tool's error tracking to identify a null pointer exception in a new code path, and deploys a hotfix before proceeding with the full release, preventing a widespread billing issue for customers.
Understand Complex Microservice Architectures
A new architect joins a company with a complex, distributed system of over 100 microservices. Instead of spending weeks reading outdated documentation, they use the service map feature in the Application Monitoring tool. This feature automatically generates a real-time, interactive diagram of all services and their dependencies, including data flow and call frequency. The architect can click on any service to see its health metrics and performance. This provides an accurate, up-to-date view of the entire system, enabling them to quickly understand the architecture and make informed decisions about future development and scaling.
Correlate Application Performance with Business KPIs
The product manager for a subscription-based service wants to understand the impact of application performance on user churn. They use an Application Monitoring tool that allows them to enrich transaction data with custom attributes, such as user subscription tier and plan value. By creating a dashboard, they can directly correlate slow page load times for the 'Upgrade Plan' page with a lower conversion rate. This data-driven insight allows them to prioritize performance optimization work for that specific user journey, demonstrating a clear link between technical performance and business outcomes like revenue.