ZapDigits
ZapDigits is a privacy-first analytics and dashboarding tool designed for startups and SaaS teams. It consolidates key metrics …
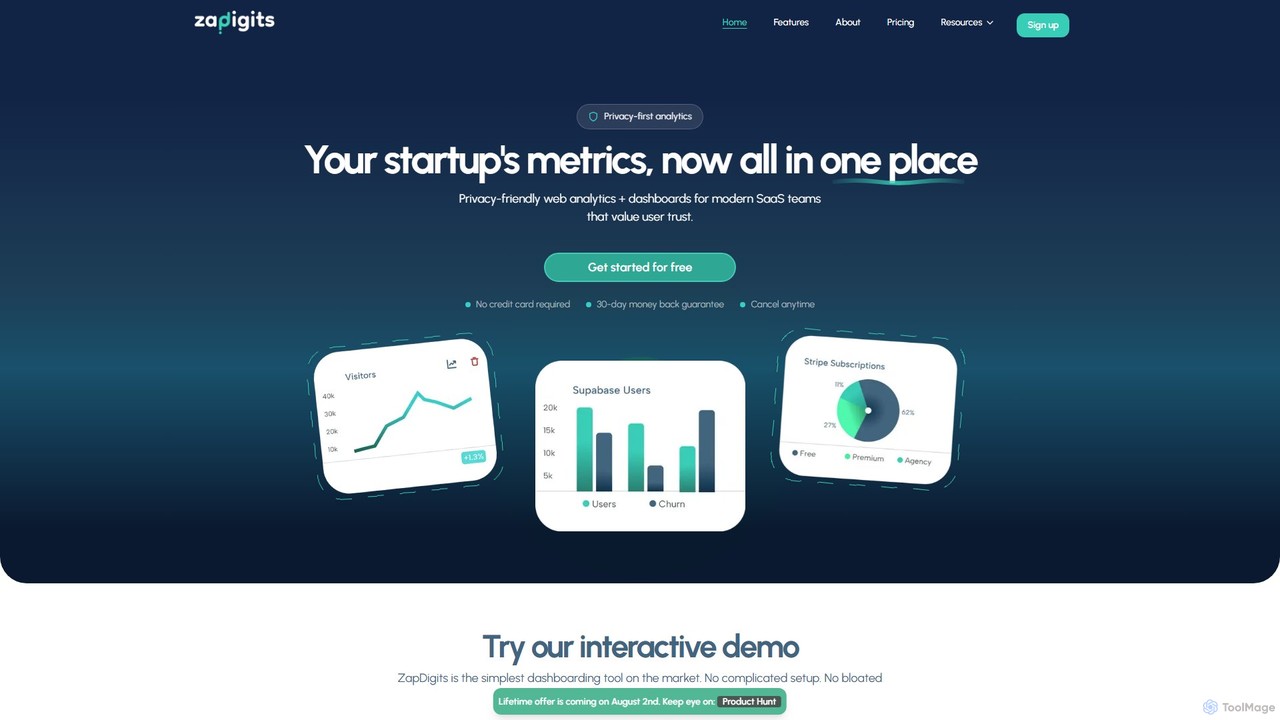
ZapDigits is a privacy-first analytics and dashboarding tool designed for startups and SaaS teams. It consolidates key metrics from various services like Stripe, Supabase, and GitHub into a single, easy-to-understand dashboard. With a no-code setup, it provides clear, actionable insights without the complexity of traditional BI tools, helping founders save time and make data-driven decisions.
About Metrics Tracking
Metrics Tracking tools are AI-powered platforms designed to automatically collect, analyze, and visualize key business performance indicators (KPIs) for startups. These tools utilize machine learning to process data from various sources, identifying trends, anomalies, and predictive insights without manual intervention. For a growing startup, this provides a real-time, unified view of business health, enabling founders and teams to make data-driven decisions quickly. They transform raw data into actionable intelligence, highlighting growth opportunities and potential risks.
Core Features
- Automated Data Integration: Connects seamlessly with platforms like Stripe, Google Analytics, CRMs, and ad networks to centralize data.
- Real-time KPI Dashboards: Offers customizable dashboards to monitor critical startup metrics such as MRR, Churn, LTV, and CAC.
- Predictive Forecasting: Uses historical data to generate forecasts for revenue, user growth, and other key metrics.
- Anomaly Detection: Automatically identifies and alerts teams to unusual changes or deviations in performance data.
- Cohort Analysis: Segments users based on acquisition date or behavior to track retention and engagement over time.
Use Cases
These tools are essential for SaaS companies tracking subscription health, e-commerce businesses optimizing conversion funnels, and mobile app developers monitoring user engagement. They empower founders, product managers, and marketers to move beyond simple spreadsheets and gain a deep, dynamic understanding of their business performance and customer behavior.
How to Choose
When selecting a Metrics Tracking tool, consider its integration capabilities with your existing tech stack. Evaluate the specific metrics it supports and whether they align with your business model (e.g., SaaS vs. e-commerce). Assess the platform's ease of use for non-technical team members and its scalability to handle future data growth. Finally, review the pricing model to ensure it fits a startup's budget.
Metrics TrackingUse Cases
Monitor SaaS Subscription Health
A founder of a B2B SaaS startup uses a metrics tracking tool to get a real-time pulse on their business. By integrating with Stripe and their CRM, the tool automatically calculates and displays key metrics like Monthly Recurring Revenue (MRR), customer churn rate, and Lifetime Value (LTV) on a single dashboard. The AI's anomaly detection feature recently flagged a 15% spike in churn for customers on a specific pricing plan, allowing the product team to investigate and discover a critical bug. This proactive insight helped them fix the issue before it impacted a larger user base, directly preserving revenue.
Optimize E-commerce Conversion Funnels
An e-commerce marketing manager connects their Shopify store, Google Analytics, and ad platforms to a metrics tracking tool. The AI automatically maps the entire customer journey, from ad click to purchase. It visualizes the conversion funnel and identifies the biggest drop-off point is the 'Shipping Information' page. The tool's AI suggests that the high shipping cost revealed at this stage is a likely deterrent. Based on this insight, the team A/B tests offering free shipping, resulting in a 20% increase in checkout completions and a significant boost in overall revenue.
Forecast Revenue for Investor Reporting
A startup CEO needs to prepare a quarterly report for the board of investors. Instead of spending days in spreadsheets, they use their metrics tracking tool's forecasting feature. The AI analyzes historical growth trends in MRR and new customer acquisition. It generates several forecast scenarios (optimistic, pessimistic, and likely) for the next two quarters. The CEO uses the 'likely' scenario projection, supported by clear data visualizations from the tool, to present a confident, data-backed growth plan in the board meeting, strengthening investor confidence.
Analyze Marketing Campaign ROI
A growth marketer at a startup runs campaigns across Google Ads, Facebook, and LinkedIn. They use a metrics tracking tool to aggregate spending and performance data from all channels into one view. The tool automatically calculates the Customer Acquisition Cost (CAC) for each channel and compares it to the Lifetime Value (LTV) of customers acquired from that channel. The AI highlights that while LinkedIn has the highest CAC, it also brings in customers with a 3x higher LTV. This insight prompts a strategic shift to invest more in LinkedIn for high-value customer acquisition, optimizing the overall marketing budget for long-term profitability.
Understand User Engagement in a Mobile App
A product manager for a new mobile app uses a metrics tool to understand user behavior. The tool's cohort analysis feature allows them to group users by their sign-up week and track their retention over time. They notice that users who engage with 'Feature X' within their first day have a 40% higher 30-day retention rate. This data-driven insight validates the feature's importance. The product team then redesigns the onboarding flow to guide new users towards 'Feature X' immediately, significantly improving the app's overall stickiness and long-term user retention.
Validate Product-Market Fit with Data
An early-stage startup founder is trying to determine if they have achieved product-market fit. They use a metrics tracking tool to monitor the 'Power User Curve,' which plots daily active users by their level of engagement. The tool shows a flattening curve for high-engagement users, indicating that a core group of users finds the product indispensable and uses it daily. This is a strong, quantitative signal of product-market fit. Armed with this data, the founder can confidently shift focus from product iteration to scaling up marketing and sales efforts.