
ToolMage
Sign in

AI TOOL COMPARISON

AskYourDatabase vs Quadratic

What is the difference, and which fits your workflow? Compare features, usage, pricing models and traffic side by side.

Jump to key differences

Product overview

AskYourDatabase Product overview

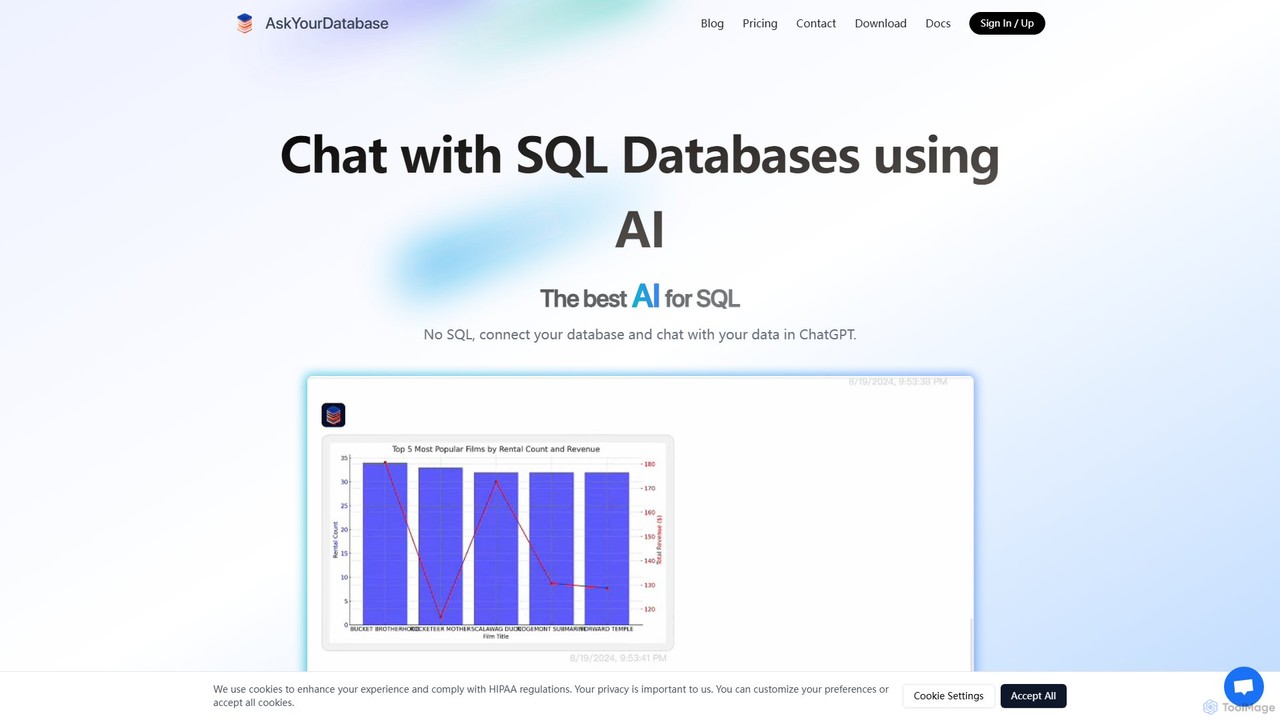
AskYourDatabase is a powerful AI SQL assistant that allows you to interact with your databases using natural language. Query data, create visualizations, and build interactive dashboards without writing a single line of SQL. It supports various databases, offers both desktop and embeddable chatbot versions, and prioritizes data security with on-premise deployment options.

Preview

Quadratic Product overview

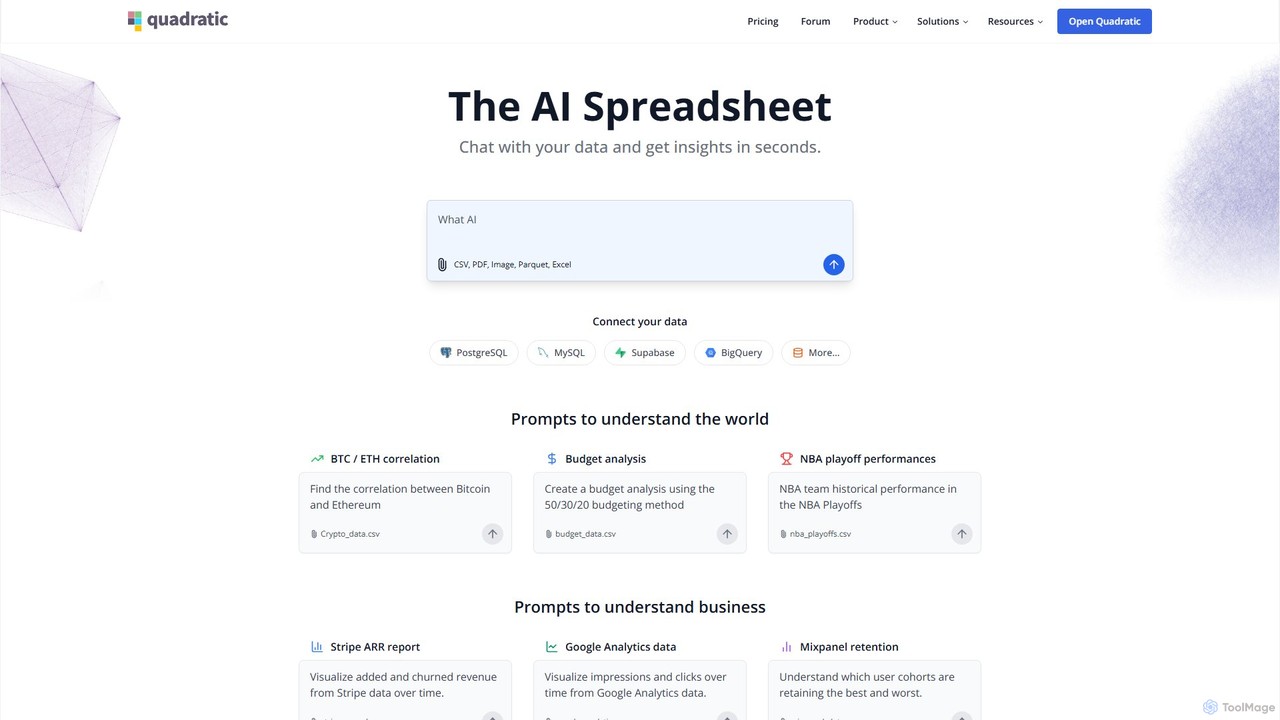
Quadratic is a powerful AI spreadsheet that integrates a familiar interface with Python, SQL, and natural language prompts. Connect directly to live databases, analyze data, extract information from PDFs, and create visualizations instantly. It's a secure, collaborative platform for data analysts, business professionals, and developers.

Preview

Quick facts

Compare product focus, pricing models and audiences. Highlighted rows indicate different listed information; unknown pricing does not mean free.

AskYourDatabase VS Quadratic — Quick facts
Quick factsAskYourDatabaseQuadratic
Pricing modelFreemiumFreemium
Product typeWebWeb
Primary focusData AnalysisBusiness Intelligence
Audience and rolesNo data availableNo data available
CategoriesData Analysis · Database · Platform · Business IntelligenceBusiness Intelligence · Data Analysis · Database · Spreadsheets
AddedAug 6, 2025Aug 16, 2025
UpdatedNov 19, 2026Nov 19, 2026

Features, usage and use cases

Explore the listed product descriptions, features and workflows. Taxonomy labels alone are not feature evaluations.

AskYourDatabase

AskYourDatabase is a revolutionary AI-powered platform designed to bridge the gap between complex databases and non-technical users. It empowers anyone to query, analyze, and visualize data by simply asking questions in plain English. This eliminates the need for SQL expertise, saving countless hours for both technical and non-technical teams. The tool is built by a team of world-class data engineers and AI specialists, trusted by over 100 companies worldwide. It offers a seamless experience, whether you're a developer building internal tools, a manager seeking quick business insights, or a company wanting to provide customers with self-service data exploration capabilities.

The platform is available in two main formats: a secure Desktop App that keeps all data connections local to your device, and a versatile Website Chatbot that can be embedded into any webpage or system. It supports a wide array of popular databases, including PostgreSQL, MySQL, Microsoft SQL Server, Oracle, MongoDB, Snowflake, and BigQuery, ensuring easy integration into your existing infrastructure.

How to use AskYourDatabase

Getting started with AskYourDatabase is designed to be straightforward. The process generally involves three steps:

  1. Connect Your Database: The first step is to connect your data source. You'll need to provide your database connection string. The platform ensures this process is secure, especially with the Desktop App where connections happen locally, or through a fixed IP server for the cloud version. The documentation provides clear guides for preparing your connection string.
  2. Start Asking Questions: Once connected, you can immediately start interacting with your data using natural language. There's no need to write complex SQL queries. You can ask things like "Show me the total sales for last month, broken down by product category" or "Which 10 customers had the highest lifetime value?". The AI interprets your request and generates the corresponding data or visualization.
  3. Refine and Visualize: The tool is more than just a query generator; it's an interactive chatbot. You can ask follow-up questions to drill down into the data. You can also instantly transform query results into clear, engaging visuals like charts and graphs. For more permanent needs, you can use the Dashboard Builder to create real-time, interactive dashboards, again, just by describing what you want to see.

Core Features of AskYourDatabase

  • Natural Language Querying: Chat with your database in plain English. The AI translates your questions into complex SQL queries automatically.
  • AI Dashboard Builder: Create real-time, interactive dashboards by describing the components you need. No coding or complex query language required.
  • Instant Data Visualization: Automatically convert complex data sets into easy-to-understand charts and graphs to uncover insights at a glance.
  • Broad Database Support: Natively connects to a wide range of databases, including Clickhouse, PostgreSQL, MySQL, Microsoft SQL Server, Oracle, MongoDB, Snowflake, and BigQuery.
  • Self-Learning AI: The AI model learns from your data schema and feedback, improving its accuracy and relevance over time. You can fine-tune it with natural language questions and corresponding SQL queries.
  • Embeddable Chatbot: Easily integrate the AI chatbot as a widget on your website, providing a powerful BI tool for your customers or internal teams.
  • Robust Security & Access Control: Offers on-premise deployment for maximum data privacy. It also supports fine-grained, user-level access control, making it safe to ship to your customers.
  • Desktop Application: A dedicated desktop app ensures all data and connections remain on your local machine for enhanced security.

Use Cases for AskYourDatabase

AskYourDatabase is versatile and can be applied in various scenarios:

  • Customer-Facing BI Chatbot: Embed a chatbot into your product or website to allow your customers to perform their own ad-hoc data queries. This reduces the burden on your engineering team and provides a superior user experience.
  • Internal Tools & Admin Dashboards: Instead of building and maintaining complex internal tools with platforms like Retool or PowerBI, teams can connect directly to their database. This allows for business intelligence, data analysis, reporting, and even data manipulation (inserting/updating) through a simple chat interface.
  • Business Intelligence & Data Analysis: Managers and executives can get instant answers to business questions without needing to wait for a data analyst. This accelerates decision-making and democratizes data access across the organization.
  • Rapid Dashboard Prototyping: Quickly build and share interactive, real-time dashboards for monitoring key metrics, tracking performance, or presenting data to stakeholders.

Advantages of AskYourDatabase

AskYourDatabase stands out from other SQL AI tools with several key advantages:

  • Highest Accuracy: The tool is specifically designed to work well with real-world, complex production databases that may contain hundreds of tables.
  • Interactive Experience: It's not just a one-way SQL generator; it's a conversational AI that you can chat with, ask follow-up questions, and refine your queries interactively.
  • Focus on Security: With options for on-premise deployment of both the application and the AI model, plus SOC 2 and ISO 27001 compliance in progress, it offers enterprise-grade security.
  • Ease of Fine-Tuning: The AI can be easily trained and improved using natural language questions and SQL queries, making it highly adaptable to your specific database schema and terminology.
  • 24/7 Support: A dedicated customer support team is available around the clock to assist with any issues.

Pricing and Plans

AskYourDatabase offers distinct pricing for its Desktop App and Website Chatbot.

Desktop App:

  • Professional: $39/month. Provides unlimited access to models like GPT-4.1-mini and Claude-4-sonnet.
  • Ultimate: $49/month (promotional price). Includes unlimited access to all models, including GPT-4.1, for the most demanding tasks.

Website Chatbot:

  • Basic: $79/month. Includes 500 questions/month and up to 3 chatbots, using the GPT-4.1-mini model.
  • Scale: $149/month. A popular choice with 1000 questions/month, up to 6 chatbots, access to more powerful models (including GPT-4.1 and Claude-4-sonnet), and the dashboard builder.
  • Established: $329/month. Offers 1500 questions/month, unlimited chatbots, and allows you to use your own branding and logo.
  • Enterprise: Custom pricing. Designed for large teams, offering on-premise hosting, unlimited users, and access to the most powerful models like GPT-4.

A free trial and a free quota for smaller models are available, allowing users to test the platform without a credit card.

Quadratic

Quadratic reimagines the spreadsheet for the modern data era, blending the intuitive, cell-based interface of traditional spreadsheets with the powerful capabilities of AI, coding, and direct database connections. It serves as a next-generation alternative to tools like Excel and Google Sheets, designed for users who need to move beyond basic calculations and perform complex data analysis, visualization, and automation. With Quadratic, you can seamlessly transition from simple data entry to writing Python scripts for machine learning, querying databases with SQL, or using natural language to generate insights and charts on the fly.

The platform is built for speed and efficiency, allowing users to import data from various sources, including CSV files, PDFs, and images, and immediately begin their analysis. Its AI-powered prompts act as a data co-pilot, helping users understand data correlations, perform budget analyses, or visualize business metrics without writing a single line of code. For technical users, the integration of code cells (Python, SQL, JavaScript) directly within the grid is a game-changer, enabling sophisticated data manipulation, scientific computing, and the creation of interactive visualizations without leaving the spreadsheet environment.

How to use Quadratic

Getting started with Quadratic is straightforward. First, you can import your data by uploading a file (like CSV, PDF, or an image) or by connecting directly to your databases, such as PostgreSQL, MySQL, Snowflake, or BigQuery. Once your data is in the sheet, you can interact with it in several ways:

  • Natural Language Prompts: Use the AI prompt bar to ask questions about your data. For example, you can type "Visualize impressions and clicks over time" or "Find the correlation between Bitcoin and Ethereum," and Quadratic will generate the corresponding analysis or chart.
  • Code Cells: For more advanced tasks, click on a cell and switch its mode to Python, SQL, or JavaScript. You can write and execute Python code for data analysis with libraries like Pandas, generate SQL queries to fetch or manipulate data from a connected database, or build custom functions with JavaScript.
  • Traditional Spreadsheet Functions: Use it like any other spreadsheet with standard formulas and functions for everyday calculations.
  • Collaboration: Share your spreadsheet with team members for real-time, multiplayer collaboration, making it a central hub for data projects.

Core Features of Quadratic

  • AI-Powered Analysis: Use natural language prompts to generate insights, create and edit charts, and automate data analysis tasks.
  • Integrated Code Cells: Write and execute Python, SQL, and JavaScript directly in spreadsheet cells, unlocking advanced data science and automation capabilities.
  • Direct Database Connections: Securely connect to popular databases like PostgreSQL, MySQL, Snowflake, and BigQuery to query and analyze live data without complex ETL pipelines.
  • Multi-Format Data Import: Easily import and extract data from CSV files, as well as unstructured sources like PDFs and images.
  • Real-Time Collaboration: Work with your team in a multiplayer environment, similar to Google Sheets, but with far more powerful features.
  • Enterprise-Grade Security: Quadratic is SOC 2 (Type II) and HIPAA compliant, ensuring your data is stored securely and privately, making it suitable for sensitive business and healthcare information.
  • Self-Hosting Option: Enterprise plans offer the ability to self-host Quadratic for maximum control and security.

Use Cases for Quadratic

Quadratic is versatile and can be applied across various domains:

  • Business Intelligence: Create dynamic dashboards by connecting to Google Analytics, Stripe, or Mixpanel data to visualize revenue, user retention, and other key performance indicators.
  • Financial Analysis: Build complex financial models, like a Black-Scholes calculator, track investment portfolios, or manage personal and business budgets with advanced templates.
  • Data Science & Research: Analyze large datasets, perform statistical analysis (e.g., t-tests, ANOVA), build machine learning models, and chart population growth or economic data from sources like FRED.
  • Education: Used in academic settings for teaching data analysis, coding, and statistical concepts in an interactive and accessible environment.
  • Operations & Reporting: Automate ad-hoc reporting, analyze sales data from POS systems, and streamline data cleaning and preparation processes.

Advantages of Quadratic

The primary advantage of Quadratic is its unique fusion of a user-friendly spreadsheet interface with the power of a developer's toolkit. This eliminates the need to switch between multiple applications (like a spreadsheet, a SQL client, and a Python notebook). It democratizes data analysis by allowing non-coders to perform complex queries via AI, while empowering technical users with a more integrated and efficient workflow. Its strong focus on security and compliance (SOC 2, HIPAA) makes it a trustworthy choice for businesses handling sensitive data, a clear advantage over standard spreadsheet tools.

Pricing and Plans

Quadratic offers a flexible pricing structure to cater to different users:

  • Personal (Free): Designed for individuals. It includes unlimited personal files but has limited AI usage and sharing capabilities.
  • Pro ($18/user/month, billed annually): Aimed at teams and professionals. This plan offers 10-20x higher AI limits, a shared team workspace, unlimited sharing, and priority support.
  • Enterprise (Custom): Tailored for large organizations. It provides custom AI usage, Single Sign-On (SSO), advanced permissions, dedicated support, and self-hosting options.
  • Education Plan: A special plan is available for students and educators.

All payments are processed securely through Stripe, and users can upgrade or downgrade their plans at any time.

Positioning

Their taxonomy shows where the products overlap and where each one has a more distinct focus. Unknown fields are shown explicitly and are never filled with assumptions.

Categories

Shared
Data AnalysisDatabase
Only AskYourDatabase
PlatformBusiness Intelligence
Only Quadratic
Business IntelligenceSpreadsheets

Tags

Shared
business intelligencedata analysisdatabasedata visualizationSQL
Only AskYourDatabase
AI assistantchatbotdashboarddeveloper toolsno-codesql generator
Only Quadratic
AIExcel alternativefinancial analysisGoogle Sheets alternativeHIPAApythonSOC 2spreadsheet

Audience and roles

Shared
No listed items
Only AskYourDatabase
No listed items
Only Quadratic
No listed items

Traffic comparison

Traffic is shown on the same scale so differences in market visibility are not visually understated.

How to interpret the traffic data

Both charts share the same months and vertical scale. Each tool identifies its latest reporting month; missing months are left blank, not counted as zero. Regional and source visit counts are estimates calculated from the reported shares.

AskYourDatabase monthly traffic:

Latest traffic · 2026-05

Monthly visits
10.4K
Avg. visit duration
0:25
Pages per visit
2.22
Bounce rate
41.78%
Data updated 2026-06-15

Monthly traffic trend

  • 2025-09: 25.4K
  • 2026-01: 16.8K
  • 2026-02: 12.1K
  • 2026-03: 11.4K
  • 2026-04: 10.4K
  • 2026-05: 10.4K

Top regions

Top 5 countries/regions
Country/regionPercentageEstimated visits
🇺🇸United States33.58%3.5K
🇧🇷Brazil27.45%2.9K
🇻🇳Vietnam17.3%1.8K
🇮🇳India13.33%1.4K
🇹🇷Turkey8.34%869

Search keywords

ask your databaseaskyourdatabase careerschat with databasedatabase in to chatqual ia é melhor para banco de dados

Quadratic monthly traffic:

Latest traffic · 2026-05

Monthly visits
118.5K
Avg. visit duration
0:35
Pages per visit
2.2
Bounce rate
43.16%
Data updated 2026-06-15

Monthly traffic trend

  • 2025-09: 184.9K
  • 2026-01: 177.8K
  • 2026-02: 167.5K
  • 2026-03: 139.4K
  • 2026-04: 126.9K
  • 2026-05: 118.5K

Top regions

Top 5 countries/regions
Country/regionPercentageEstimated visits
🇮🇳India45.71%54.2K
🇺🇸United States35.84%42.5K
🇨🇦Canada8.47%10K
🇪🇹Ethiopia5.16%6.1K
🇳🇬Nigeria4.82%5.7K

Traffic sources

Source typePercentageEstimated visits
Direct72.25%85.6K
Referral17.35%20.6K
Email10.4%12.3K

Search keywords

coefficientgoogle sheetsquadraticquadratic aiquadratic formula calculator

Community signals

Ratings, comments, favorites, and likes are community signals—not a substitute for product fit.

AskYourDatabase

Rating
No data available
Comments
0
Favorites
185
Likes
162

Quadratic

Rating
No data available
Comments
0
Favorites
186
Likes
147

AskYourDatabase vs Quadratic · Comparison FAQ

What do AskYourDatabase and Quadratic have in common?
Both tools are listed under Data Analysis、Database. These categories indicate overlapping use cases; compare their detailed descriptions for workflows, capabilities and limitations.
Are AskYourDatabase and Quadratic free?
Listed pricing models: AskYourDatabase — Freemium; Quadratic — Freemium. Missing pricing is not proof of a free plan, and freemium does not mean every feature is free. Check official sites for current plans, limits and trials.
How should I choose between AskYourDatabase and Quadratic?
The primary listed category is Data Analysis for AskYourDatabase, and Business Intelligence for Quadratic. Compare features, steps and use cases, then verify pricing, data permissions and deployment needs. This page does not include hands-on testing and does not declare a winner from traffic or tags.

Sources and comparison methodology

This page is assembled from ToolMage product listings, taxonomy, traffic statistics and on-site user feedback. It is not a hands-on test or an independent review.
  • Feature and plan descriptions reflect information in the listings, not real-time guarantees. Verify pricing, quotas, availability and privacy terms on the official sites.
  • Traffic uses the reporting months shown. Missing statistics do not mean zero visits, and different periods do not establish growth or superiority. Regional and source visit counts are estimates based on shares.
  • Different tags indicate differences in the listings, not proof that the other product lacks a capability. Ratings, favorites and visits are not used to declare a winner.

Related comparisons