
Quadratic Overview
Quadratic reimagines the spreadsheet for the modern data era, blending the intuitive, cell-based interface of traditional spreadsheets with the powerful capabilities of AI, coding, and direct database connections. It serves as a next-generation alternative to tools like Excel and Google Sheets, designed for users who need to move beyond basic calculations and perform complex data analysis, visualization, and automation. With Quadratic, you can seamlessly transition from simple data entry to writing Python scripts for machine learning, querying databases with SQL, or using natural language to generate insights and charts on the fly.
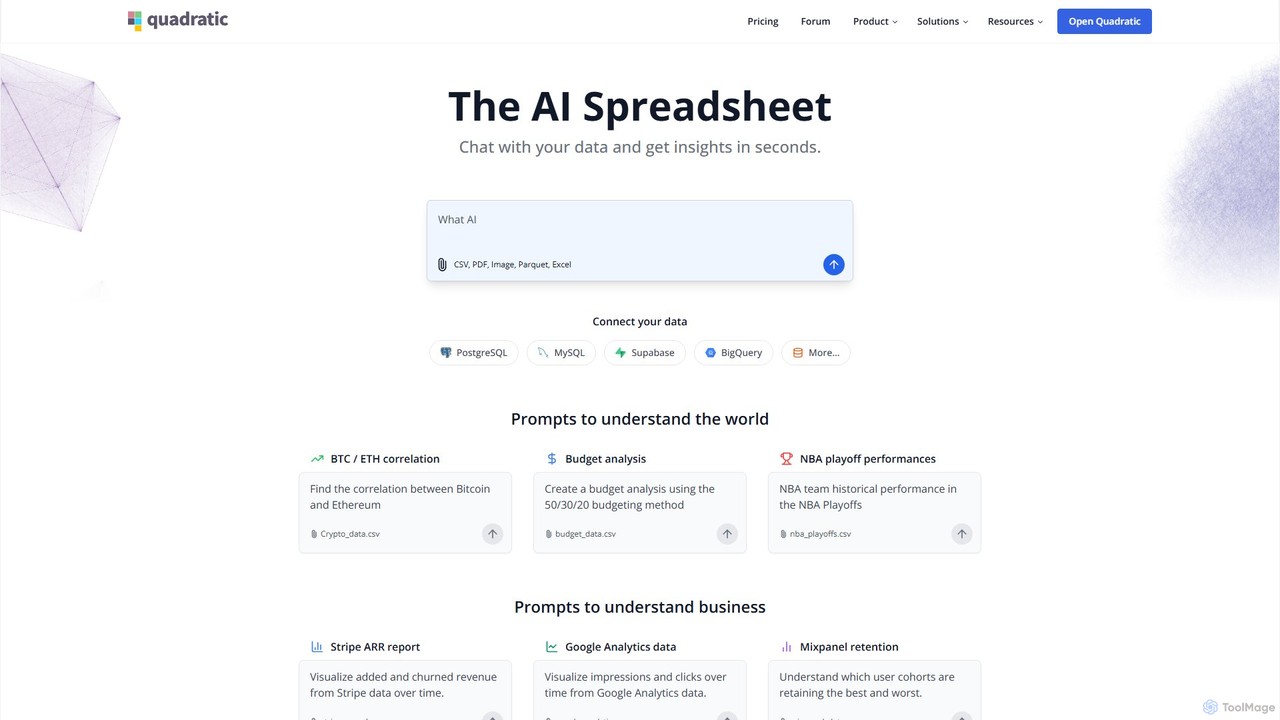
The platform is built for speed and efficiency, allowing users to import data from various sources, including CSV files, PDFs, and images, and immediately begin their analysis. Its AI-powered prompts act as a data co-pilot, helping users understand data correlations, perform budget analyses, or visualize business metrics without writing a single line of code. For technical users, the integration of code cells (Python, SQL, JavaScript) directly within the grid is a game-changer, enabling sophisticated data manipulation, scientific computing, and the creation of interactive visualizations without leaving the spreadsheet environment.
How to use Quadratic
Getting started with Quadratic is straightforward. First, you can import your data by uploading a file (like CSV, PDF, or an image) or by connecting directly to your databases, such as PostgreSQL, MySQL, Snowflake, or BigQuery. Once your data is in the sheet, you can interact with it in several ways:
- Natural Language Prompts: Use the AI prompt bar to ask questions about your data. For example, you can type "Visualize impressions and clicks over time" or "Find the correlation between Bitcoin and Ethereum," and Quadratic will generate the corresponding analysis or chart.
- Code Cells: For more advanced tasks, click on a cell and switch its mode to Python, SQL, or JavaScript. You can write and execute Python code for data analysis with libraries like Pandas, generate SQL queries to fetch or manipulate data from a connected database, or build custom functions with JavaScript.
- Traditional Spreadsheet Functions: Use it like any other spreadsheet with standard formulas and functions for everyday calculations.
- Collaboration: Share your spreadsheet with team members for real-time, multiplayer collaboration, making it a central hub for data projects.
Core Features of Quadratic
- AI-Powered Analysis: Use natural language prompts to generate insights, create and edit charts, and automate data analysis tasks.
- Integrated Code Cells: Write and execute Python, SQL, and JavaScript directly in spreadsheet cells, unlocking advanced data science and automation capabilities.
- Direct Database Connections: Securely connect to popular databases like PostgreSQL, MySQL, Snowflake, and BigQuery to query and analyze live data without complex ETL pipelines.
- Multi-Format Data Import: Easily import and extract data from CSV files, as well as unstructured sources like PDFs and images.
- Real-Time Collaboration: Work with your team in a multiplayer environment, similar to Google Sheets, but with far more powerful features.
- Enterprise-Grade Security: Quadratic is SOC 2 (Type II) and HIPAA compliant, ensuring your data is stored securely and privately, making it suitable for sensitive business and healthcare information.
- Self-Hosting Option: Enterprise plans offer the ability to self-host Quadratic for maximum control and security.
Use Cases for Quadratic
Quadratic is versatile and can be applied across various domains:
- Business Intelligence: Create dynamic dashboards by connecting to Google Analytics, Stripe, or Mixpanel data to visualize revenue, user retention, and other key performance indicators.
- Financial Analysis: Build complex financial models, like a Black-Scholes calculator, track investment portfolios, or manage personal and business budgets with advanced templates.
- Data Science & Research: Analyze large datasets, perform statistical analysis (e.g., t-tests, ANOVA), build machine learning models, and chart population growth or economic data from sources like FRED.
- Education: Used in academic settings for teaching data analysis, coding, and statistical concepts in an interactive and accessible environment.
- Operations & Reporting: Automate ad-hoc reporting, analyze sales data from POS systems, and streamline data cleaning and preparation processes.
Advantages of Quadratic
The primary advantage of Quadratic is its unique fusion of a user-friendly spreadsheet interface with the power of a developer's toolkit. This eliminates the need to switch between multiple applications (like a spreadsheet, a SQL client, and a Python notebook). It democratizes data analysis by allowing non-coders to perform complex queries via AI, while empowering technical users with a more integrated and efficient workflow. Its strong focus on security and compliance (SOC 2, HIPAA) makes it a trustworthy choice for businesses handling sensitive data, a clear advantage over standard spreadsheet tools.
Pricing and Plans
Quadratic offers a flexible pricing structure to cater to different users:
- Personal (Free): Designed for individuals. It includes unlimited personal files but has limited AI usage and sharing capabilities.
- Pro ($18/user/month, billed annually): Aimed at teams and professionals. This plan offers 10-20x higher AI limits, a shared team workspace, unlimited sharing, and priority support.
- Enterprise (Custom): Tailored for large organizations. It provides custom AI usage, Single Sign-On (SSO), advanced permissions, dedicated support, and self-hosting options.
- Education Plan: A special plan is available for students and educators.
All payments are processed securely through Stripe, and users can upgrade or downgrade their plans at any time.
Traffic
Latest traffic
Status
Monthly traffic trend
- 2025-9: 184.9K
- 2026-1: 177.8K
- 2026-2: 167.5K
- 2026-3: 139.4K
- 2026-4: 126.9K
- 2026-5: 118.5K
Geography
Top 5 countries / regions
- 🇮🇳India45.7%
- 🇺🇸United States35.8%
- 🇨🇦Canada8.5%
- 🇪🇹Ethiopia5.2%
- 🇳🇬Nigeria4.8%
Traffic sources
| Source type | Percentage |
|---|---|
Direct | 72.3% |
Referral | 17.4% |
Email | 10.4% |
Top keywords
| Keyword | Cost per click |
|---|---|
| coefficient | $7.21 |
| google sheets | $1.99 |
| quadratic | $2.20 |
| quadratic ai | $2.53 |
| quadratic formula calculator | $1.18 |
Quadratic Videos on YouTube


The Next Signal


Latent Space

Through GenAI Lens


Quadratic Alternatives
InsightBase
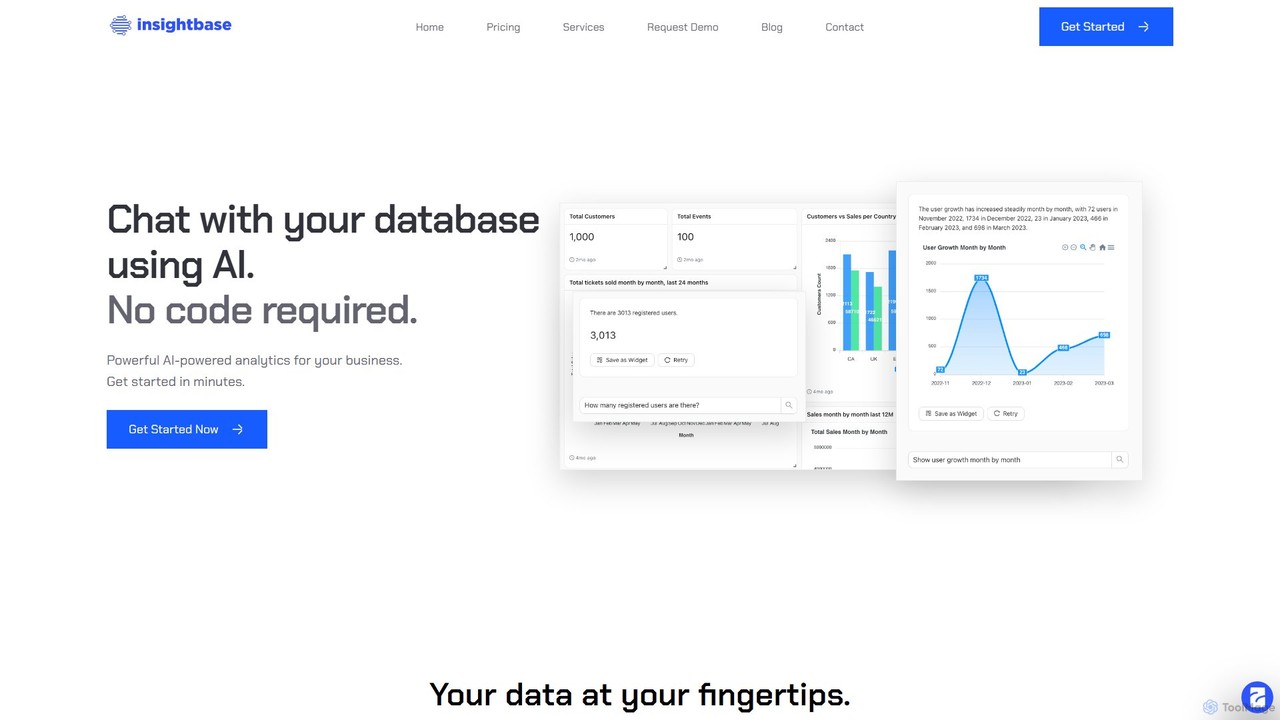
InsightBase is an AI-powered business intelligence platform that allows you to chat with your database using natural language. It empowers both non-technical and technical users to build dashboards, generate reports, and gain data-driven insights in minutes, without needing to write complex SQL queries.
Business Intelligence
ChatExcel
ChatExcel is an AI-powered data analysis tool that allows users to process spreadsheets and analyze data through a simple chat interface. It automates tasks like data cleaning, merging, and analysis, and generates over 100 types of charts and visualizations from natural language commands. No coding or complex formulas required, boosting productivity by up to 90%.
Business Intelligence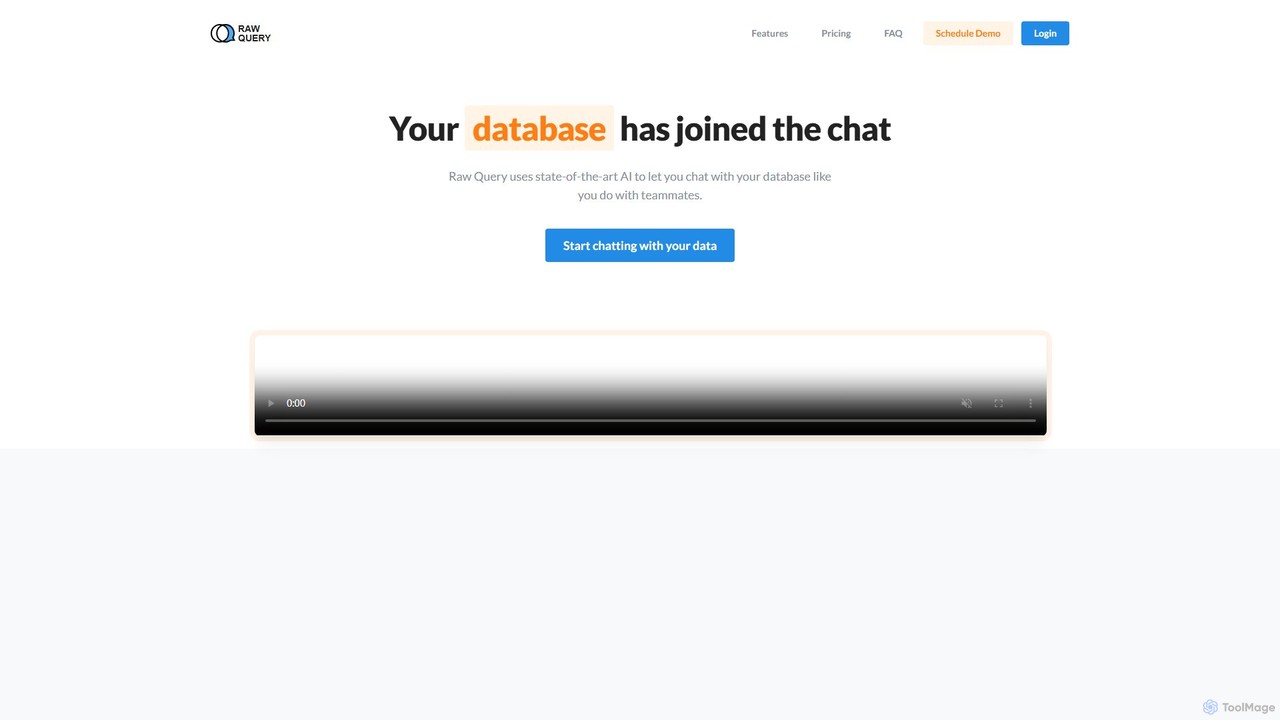
Raw Query
Raw Query is an AI-powered data assistant that allows you to interact with your database using natural language. Query, add, and update data through a simple chat interface, eliminating the need for complex SQL or custom internal tools. Ideal for developers and business teams to get instant data insights.
Business Intelligence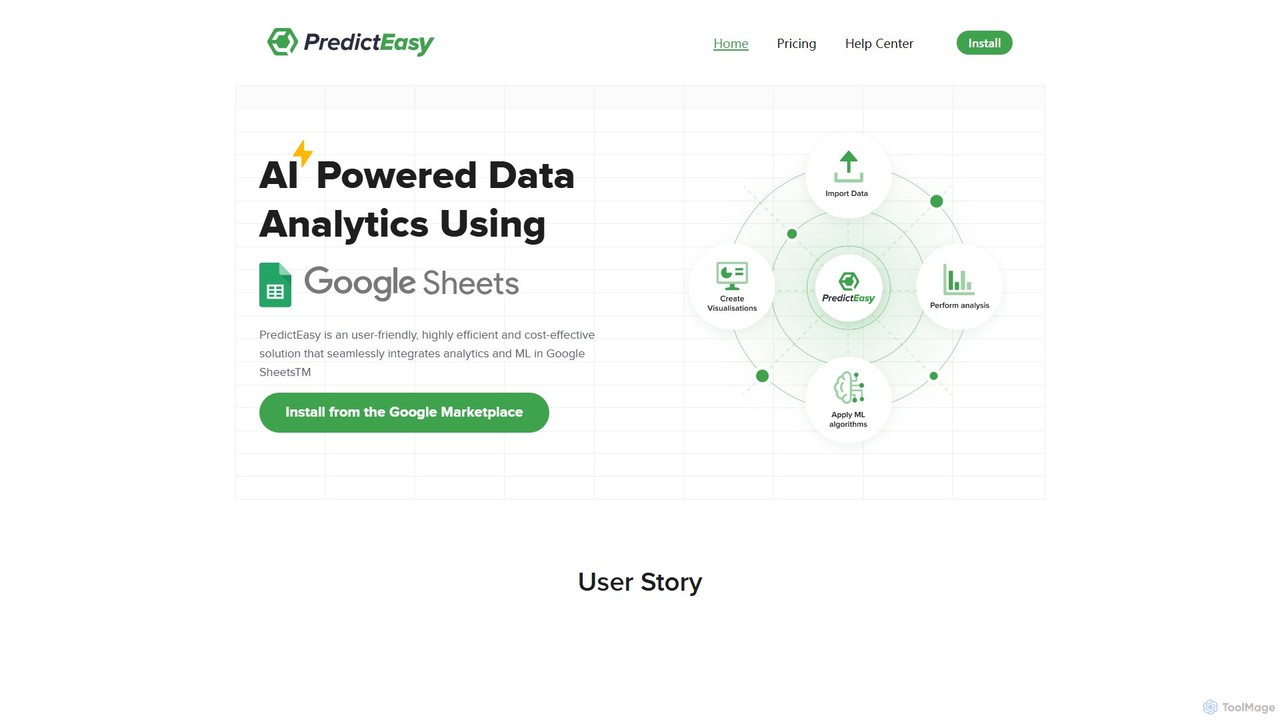
PredictEasy
PredictEasy is a powerful no-code AI add-on for Google Sheets that democratizes data analytics. It allows users to perform advanced tasks like predictive modeling, time-series forecasting, NLP, and statistical analysis with just a few clicks. Ideal for business professionals, researchers, and data analysts, it transforms your spreadsheet into a sophisticated data science tool, enabling data-driven decisions without writing any code.
Business Intelligence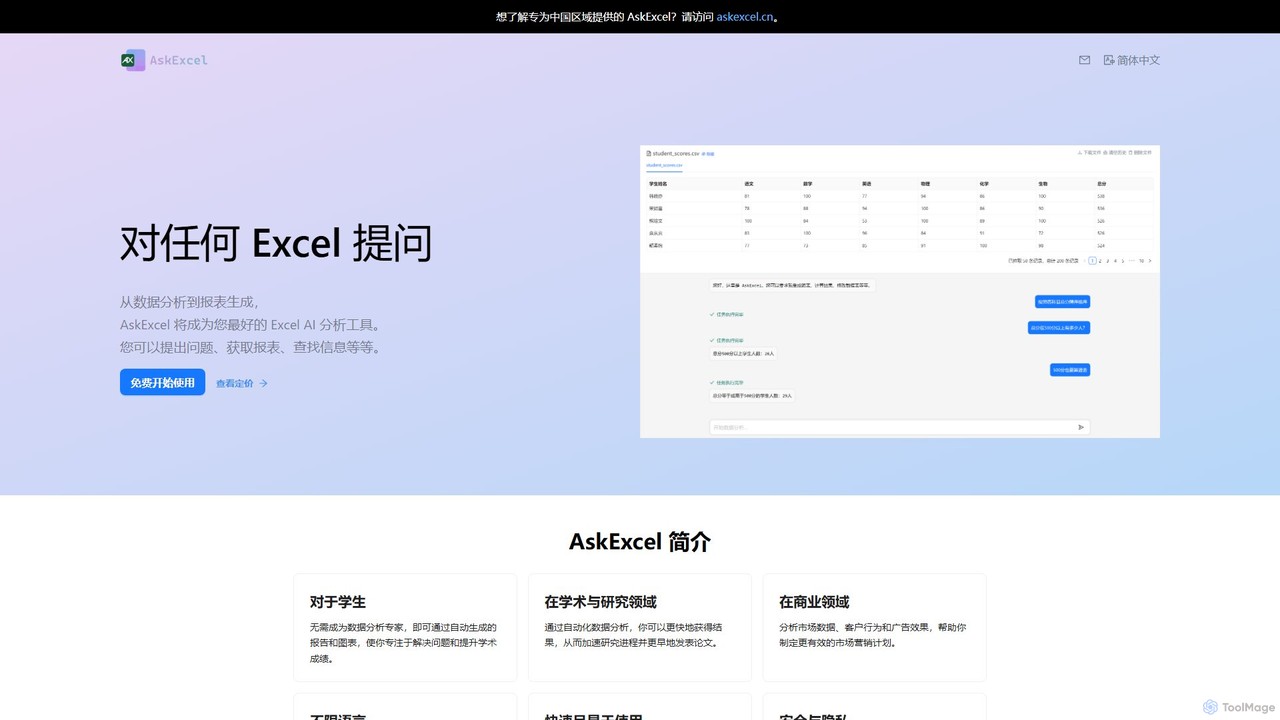
AskExcel
AskExcel is an AI-powered data analysis tool that transforms your Excel spreadsheets into interactive conversations. Simply upload your file, ask questions in natural language, and instantly receive data analysis, reports, and visualizations without writing any formulas or code.
Business IntelligenceQuadratic Categories
Quadratic Embed Widget
Copy this embed code to place the badge on your blog, article, or product site and send readers directly to this ToolMage detail page.

Related AI tools
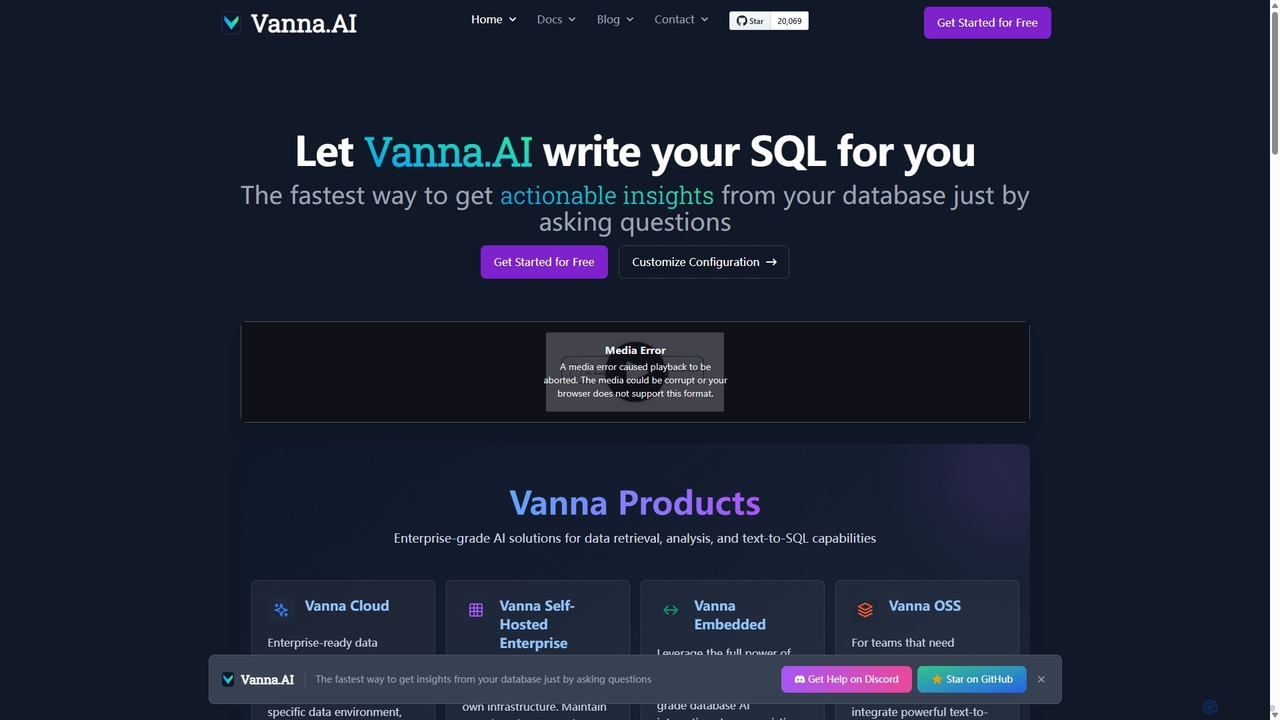
Vanna.AI
Vanna.AI is an open-source, personalized AI SQL agent that transforms natural language questions into accurate SQL queries. It uses a Retrieval-Augmented Generation (RAG) model trained on your specific database schema, documentation, and past queries to achieve high accuracy on complex datasets. It's designed for security, flexibility, and easy integration into any application, empowering both technical and non-technical users to gain insights from their data effortlessly.
Business Intelligence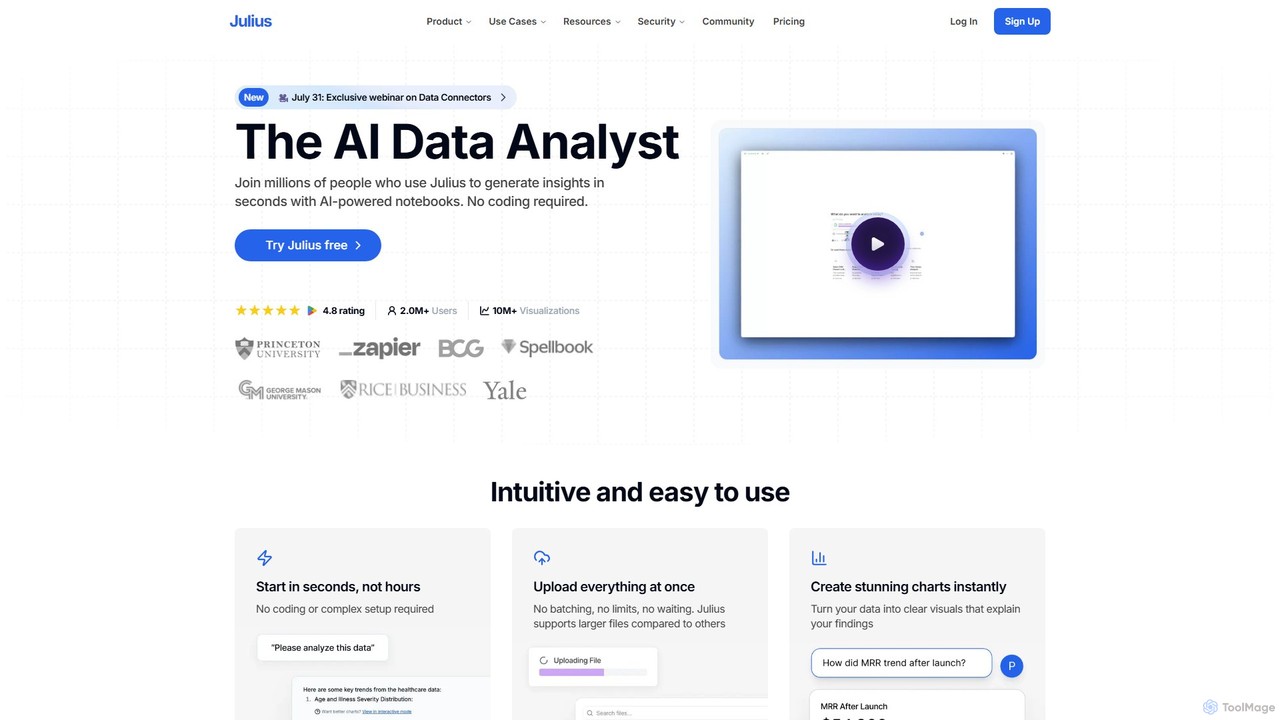
Julius AI
Julius AI is your AI Data Analyst, designed to interpret, analyze, and visualize complex data effortlessly. Connect your data from spreadsheets, databases, or PDFs, ask questions in natural language, and receive instant insights, charts, and reports. No coding is required, but it also supports Python, R, and SQL for advanced users, making data analysis accessible to everyone.
Developer ToolsInsightBase
InsightBase is an AI-powered business intelligence platform that allows you to chat with your database using natural language. It empowers both non-technical and technical users to build dashboards, generate reports, and gain data-driven insights in minutes, without needing to write complex SQL queries.
Business Intelligence
Jyek
Jyek is an AI agent platform that understands objectives, creates execution plans, uses tools, and delivers verifiable results for complex, multi-step tasks.
Automation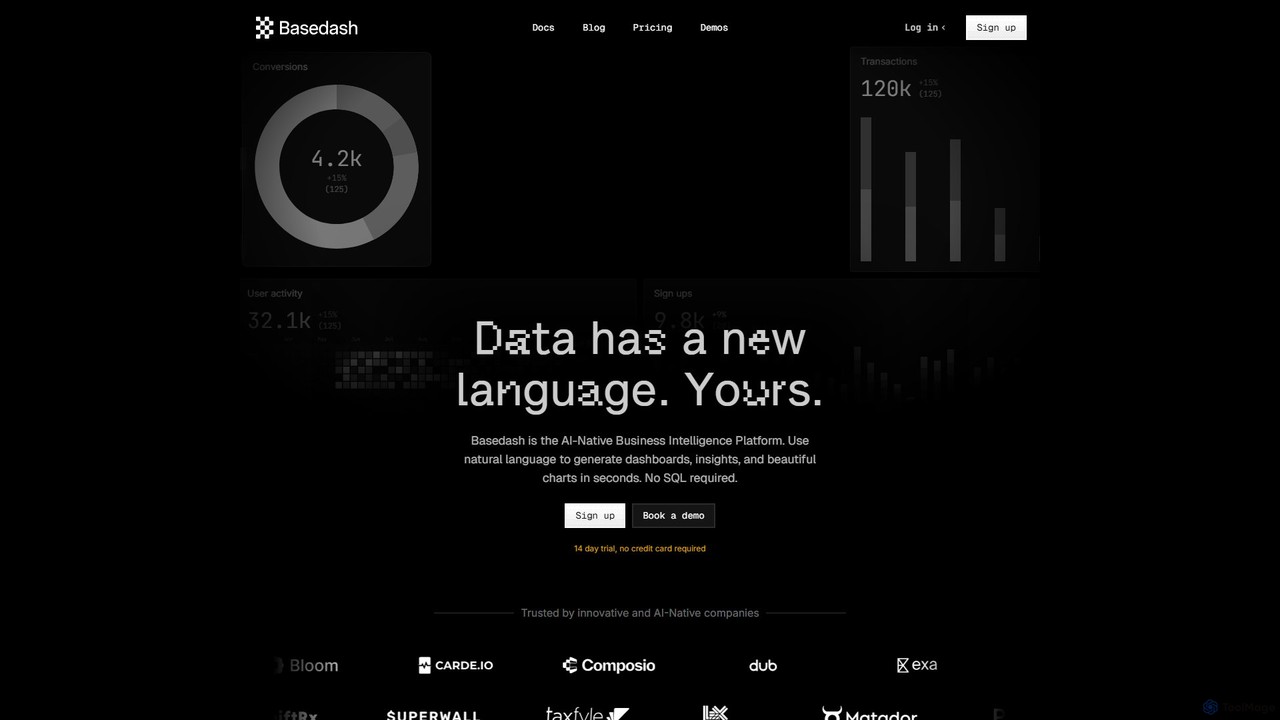
Basedash
Basedash is an AI-native business intelligence platform that allows teams to interact with their data using natural language. Generate beautiful dashboards, charts, and insights in seconds without writing any SQL code. Connect your data sources and simply ask questions to get answers.
Business Intelligence
Fabi.ai
Fabi.ai is an AI-powered business intelligence and data analysis platform designed for lean teams. It integrates SQL, Python, and AI to help users build dashboards, automate workflows, and explore data 10x faster. The platform offers an all-in-one collaborative environment, reducing context switching and enabling both technical and non-technical users to derive insights from their data sources like data warehouses, Google Sheets, and more.
Business Intelligence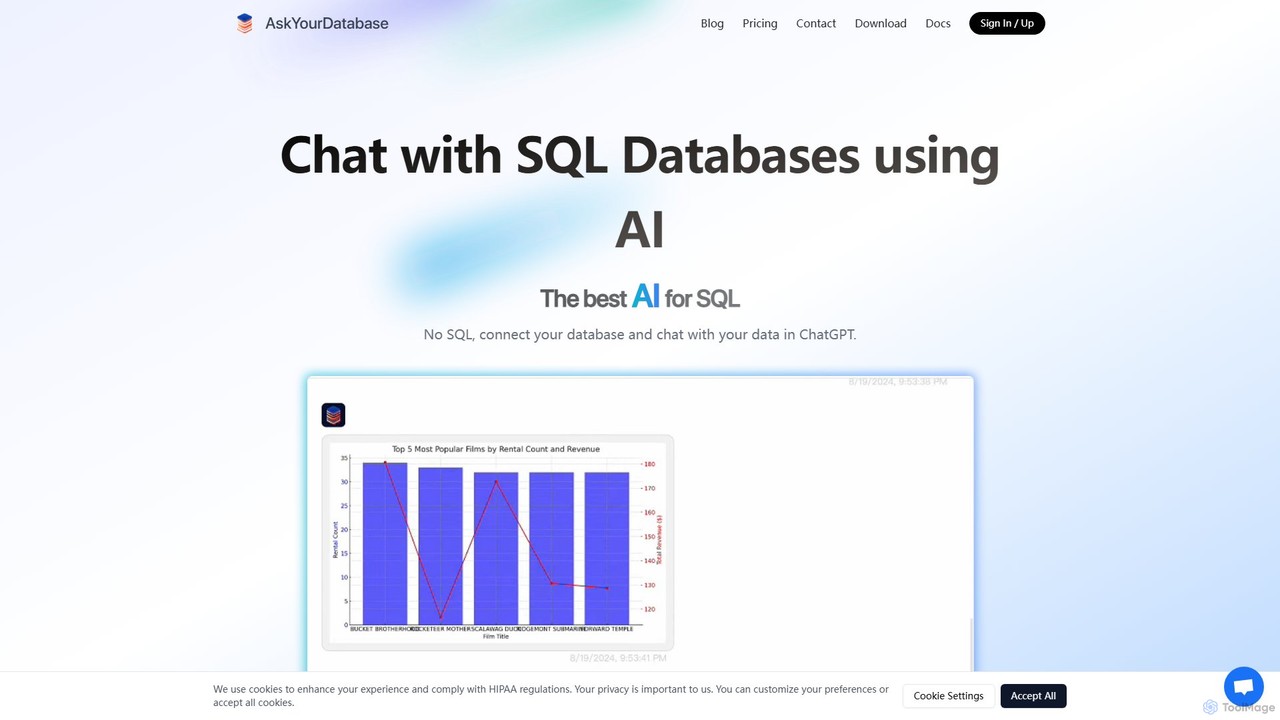
AskYourDatabase
AskYourDatabase is a powerful AI SQL assistant that allows you to interact with your databases using natural language. Query data, create visualizations, and build interactive dashboards without writing a single line of SQL. It supports various databases, offers both desktop and embeddable chatbot versions, and prioritizes data security with on-premise deployment options.
Data Analysis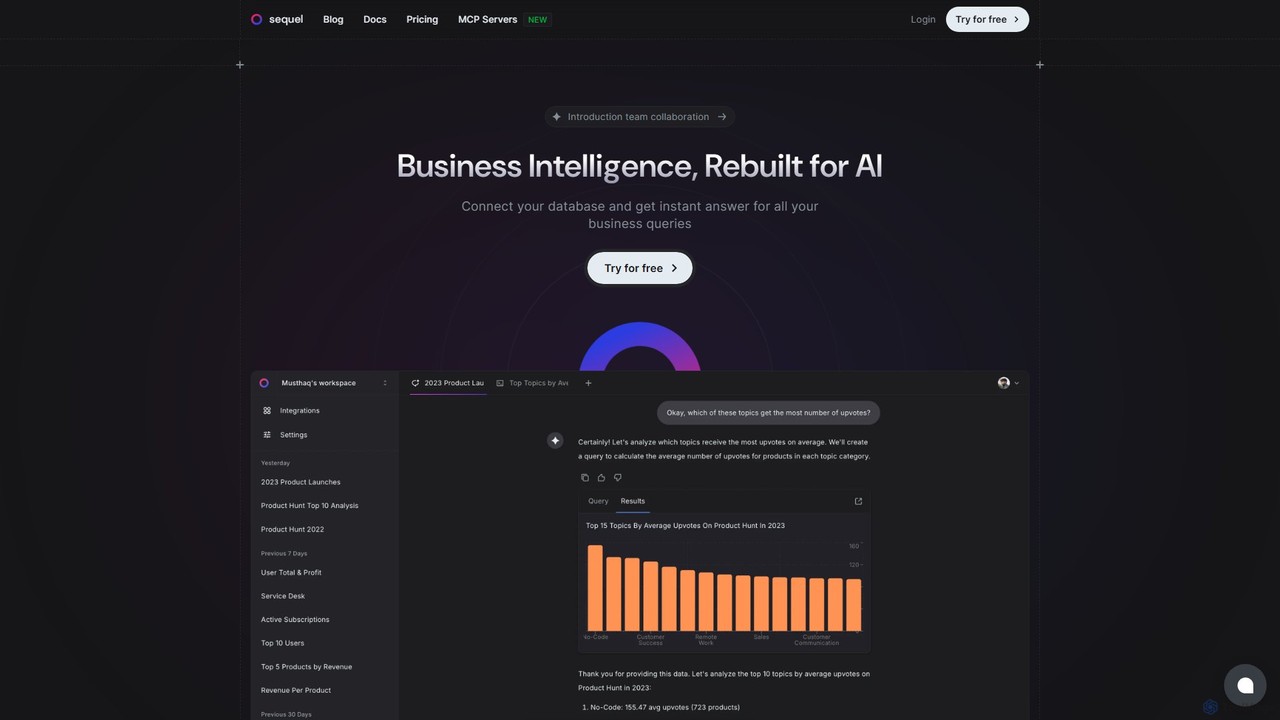
Sequel
Sequel is an AI-powered Business Intelligence platform that allows you to interact with your databases using natural language. Connect your data, ask questions in plain English, and instantly receive reports, visualizations, and insights without writing a single line of SQL.
Business Intelligence
Arcwise
Arcwise is an AI copilot for Google Sheets that supercharges your spreadsheet workflows. It connects directly to your data warehouses and BI tools, allowing you to query, analyze, and visualize complex data using natural language, all within the familiar spreadsheet environment.
Business Intelligence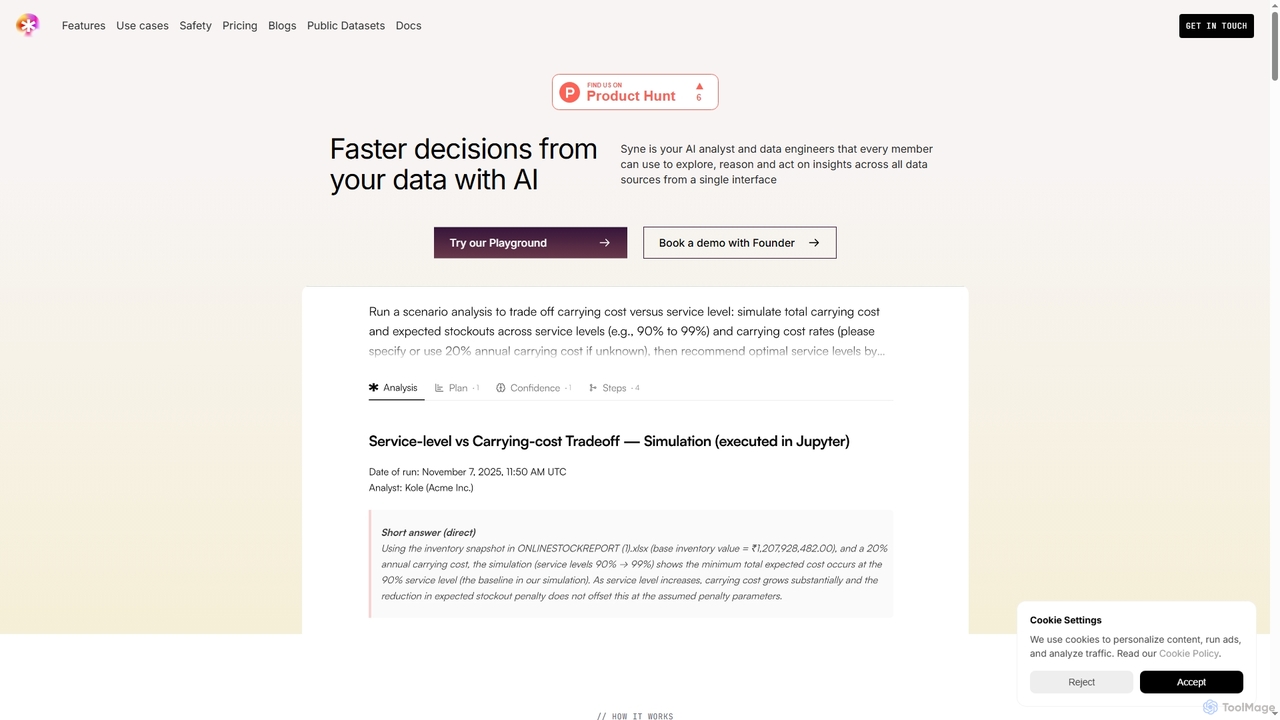
Syne
Syne is an AI-powered data analytics platform that functions as an AI analyst and data engineer. It enables all team members to explore, analyze, and act on insights from over 100 data sources using natural language queries through a single interface, eliminating the need for complex SQL knowledge for basic inquiries.
Business Intelligence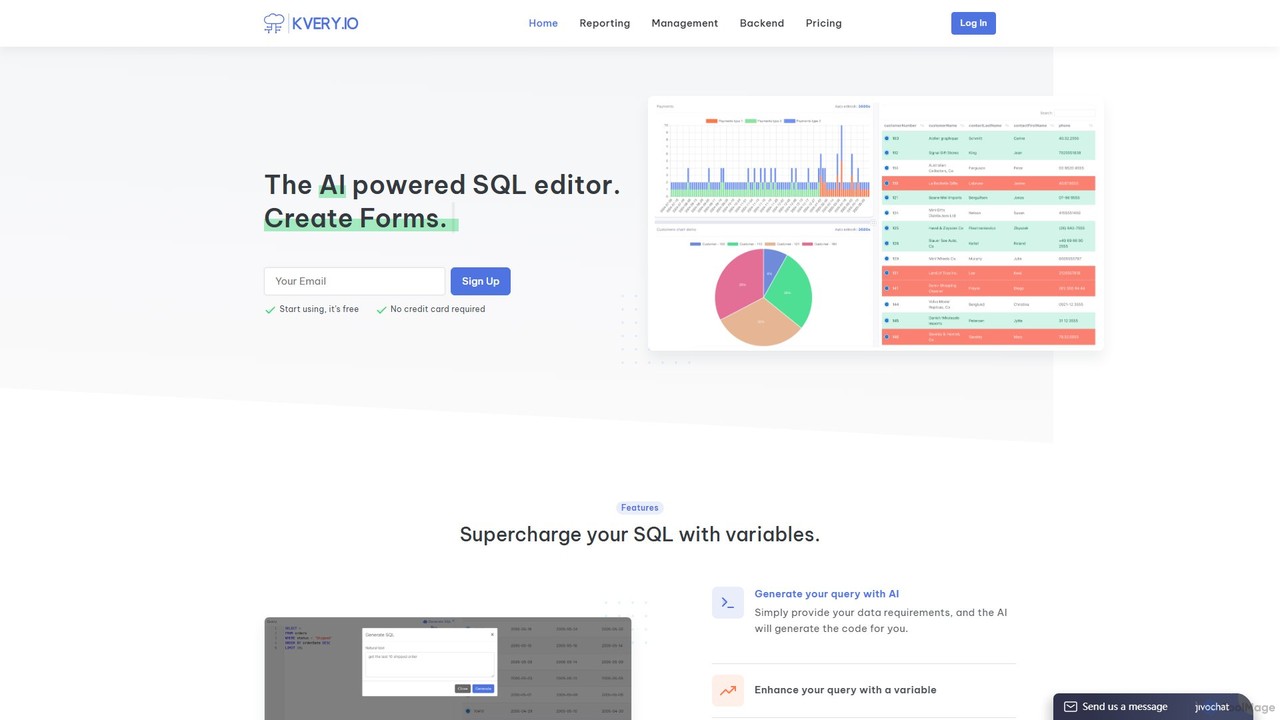
Kvery
Kvery is an AI-powered SQL editor and database analytics platform designed to streamline data workflows. It enables users to generate complex SQL queries using natural language, create interactive reports and dashboards, and visualize data with various chart types. Kvery aims to boost productivity and reduce development costs for both startups and enterprises by making database management intuitive and efficient.
Business Intelligence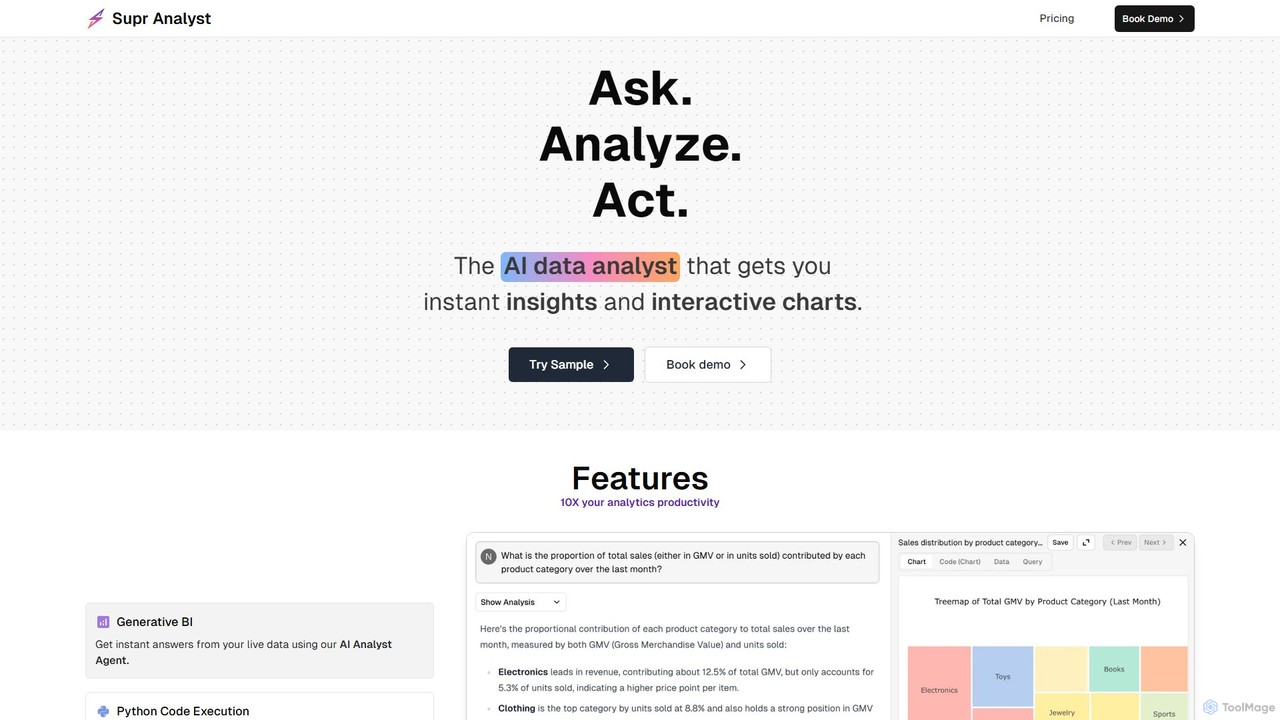
Supranalyst
Supranalyst is an AI-powered data analyst that lets you chat with your data directly in Slack. Connect to various data sources like PostgreSQL, Snowflake, and Google Sheets, ask questions in plain English, and receive instant insights and interactive charts. It streamlines data analysis for both technical and non-technical teams, boosting productivity by 10x.
Business Intelligence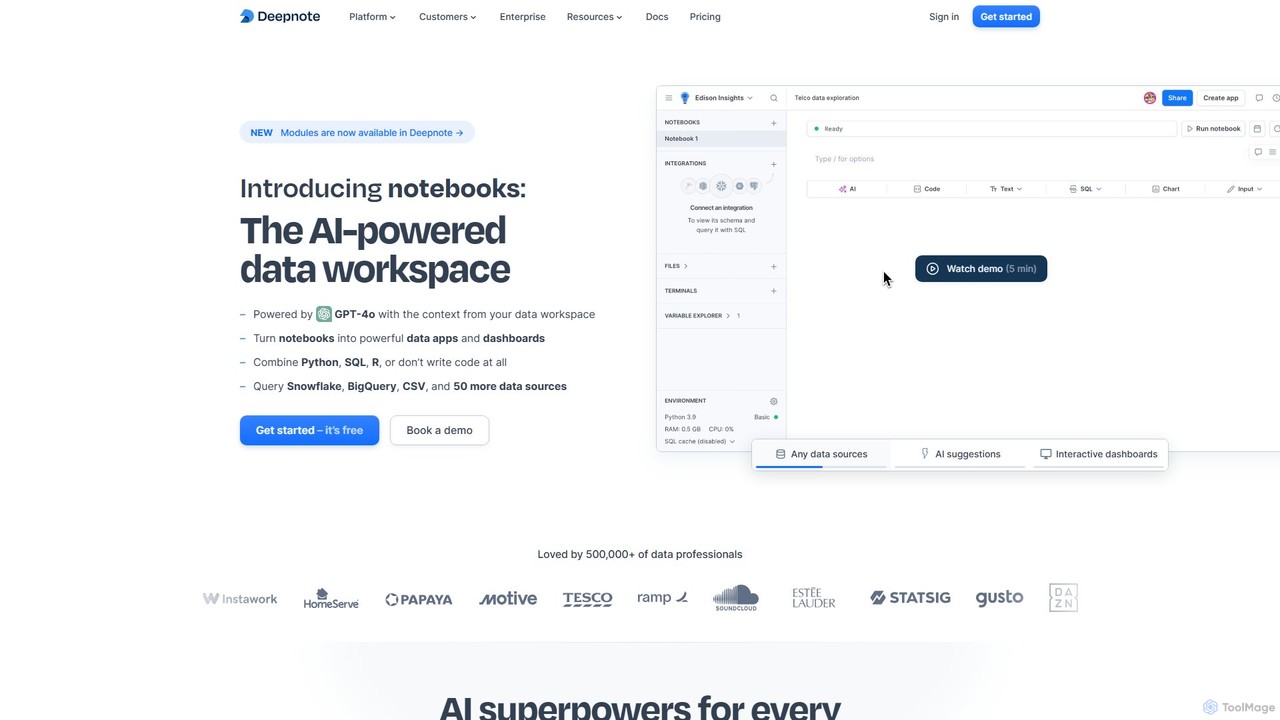
Deepnote
Deepnote is an AI-powered, collaborative data science notebook for teams. It unifies Python, SQL, and R in a single cloud-based workspace, enabling users to explore data, build machine learning models, and create interactive dashboards and apps with ease. Powered by GPT-4o, it automates analysis and code generation, making data science accessible to all skill levels.
Business Intelligence
Sourcetable
Sourcetable is an AI-powered spreadsheet that combines the functionality of traditional spreadsheets with an AI data analyst. It allows users to connect to live data sources, ask questions in plain English, generate formulas, create charts, and automate reports. By integrating AI, Python, and SQL capabilities directly into the spreadsheet interface, Sourcetable empowers users of all skill levels to perform complex data analysis, cleaning, and visualization tasks effortlessly, turning raw data into actionable insights in seconds.
No Code
table.studio
table.studio is an AI-powered data workspace that combines the simplicity of a spreadsheet with the power of a database and AI. Use natural language to query, analyze, and visualize your data, automating tedious tasks and uncovering insights instantly. It's designed for teams to collaborate on data projects in real-time.
Database Management
Quadratic Comments (0)
Sign in to comment.
Sign inNo comments yet.