
ToolMage
Sign in

AI TOOL COMPARISON

draxlr vs Explo

What is the difference, and which fits your workflow? Compare features, usage, pricing models and traffic side by side.

Jump to key differences

Product overview

draxlr Product overview

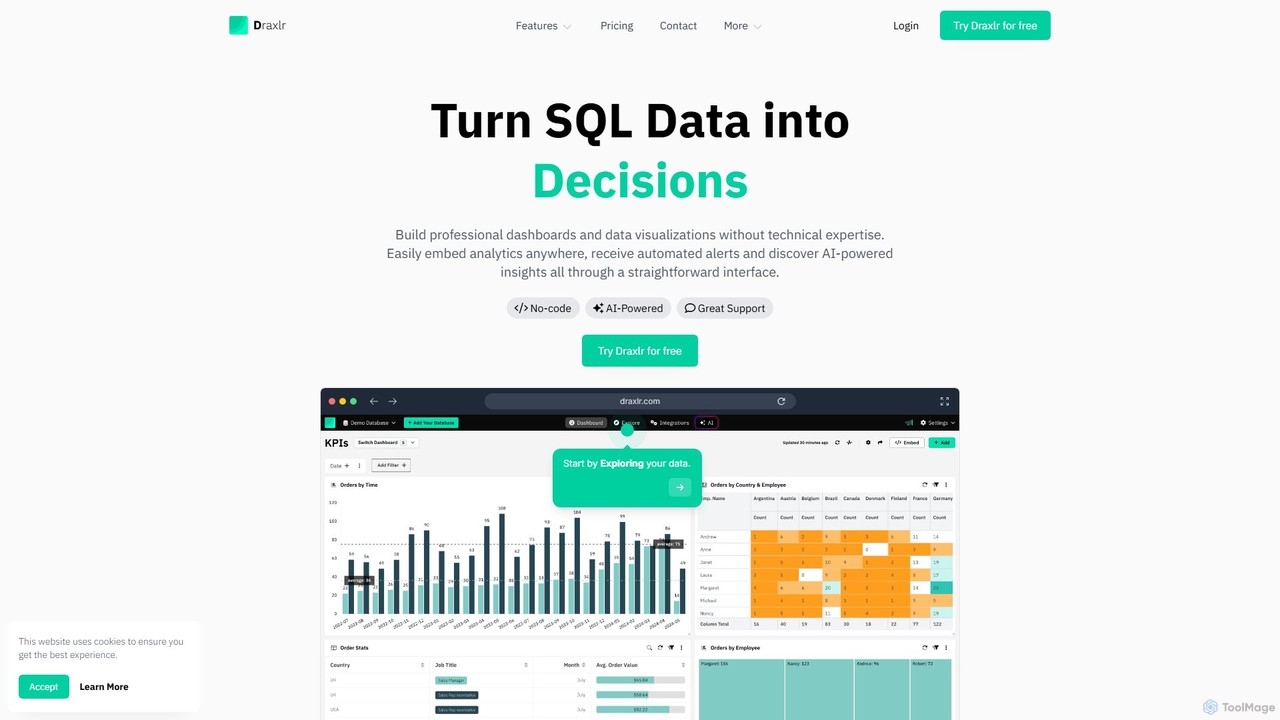
Draxlr is an AI-powered business intelligence platform that enables users to build professional dashboards and data visualizations from SQL databases without technical expertise. It offers a no-code query builder, embeddable analytics, and automated alerts to transform raw data into actionable decisions.

Preview

Explo Product overview

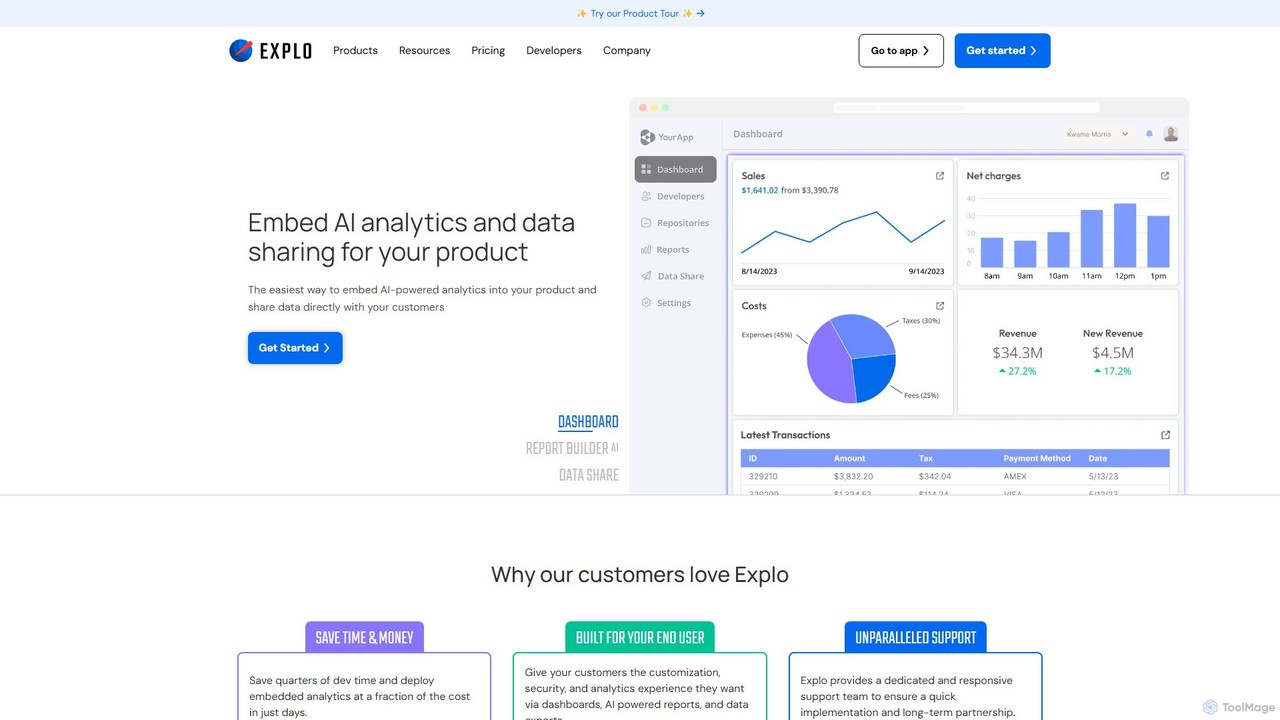
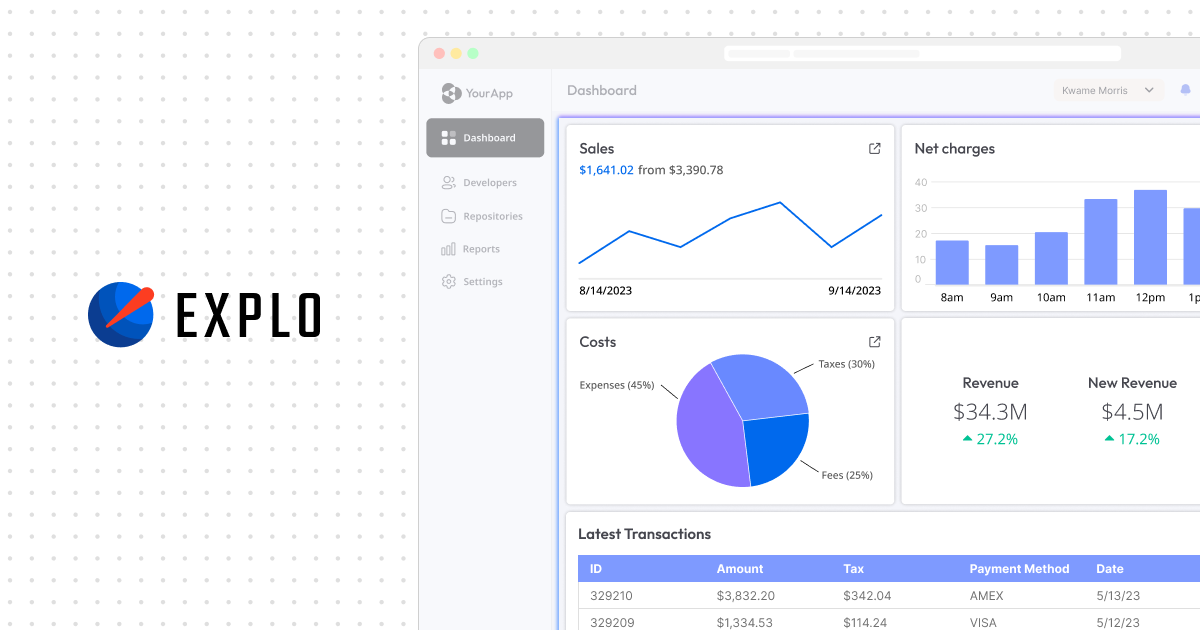
Explo is a powerful platform for creating and embedding customer-facing analytics and dashboards directly into any application. It allows businesses to connect their databases, build beautiful, customizable data visualizations, and share insights with their users seamlessly. With AI-powered features like a dashboard builder and reporting, Explo helps SaaS, E-commerce, and Fintech companies enhance their product value by providing native, white-labeled analytics experiences without extensive development effort.

Preview

Quick facts

Compare product focus, pricing models and audiences. Highlighted rows indicate different listed information; unknown pricing does not mean free.

draxlr VS Explo — Quick facts
Quick factsdraxlrExplo
Pricing modelFreemiumFreemium
Product typeWebWeb
Primary focusBusiness IntelligenceBusiness Intelligence
Audience and rolesNo data availableNo data available
CategoriesBusiness Intelligence · Database · Analytics · Data AnalysisBusiness Intelligence · Embedded Analytics · Data Visualization · Dashboard
AddedAug 10, 2025Aug 8, 2025
UpdatedNov 19, 2026Nov 19, 2026

Features, usage and use cases

Explore the listed product descriptions, features and workflows. Taxonomy labels alone are not feature evaluations.

draxlr

Draxlr is a comprehensive, AI-powered business intelligence (BI) and data analytics platform designed to empower teams to make data-driven decisions. It allows users, regardless of their technical background, to connect directly to their SQL databases and transform complex data into clear, interactive, and professional dashboards. The platform's core philosophy is to simplify data access and analysis, eliminating the need for constant developer intervention for reporting tasks.

With a user-friendly, no-code interface, Draxlr enables anyone to build queries, visualize data, and discover insights. It supports a wide array of popular SQL databases, including PostgreSQL, MySQL, BigQuery, Snowflake, Supabase, and many more, ensuring seamless integration with your existing data infrastructure. The platform is built to solve common business challenges, such as freeing up developer resources, providing customers with embedded analytics, and ensuring critical business events are never missed.

How to use draxlr

Using Draxlr is a straightforward, three-step process designed for efficiency and ease of use:

  1. Connect Your Database: Simply sign up for a Draxlr plan, and connect to one or more of your SQL databases. The platform provides secure and easy-to-configure connections. You can also upload data from Excel/CSV files or connect to Airtable.
  2. Build Queries: Utilize the intuitive Visual SQL Query Builder to filter, sort, join, and summarize your data with just a few clicks. For more complex needs, you can switch to the SQL editor. The AI-powered features allow you to ask questions in natural language to get insights from your data.
  3. Build and Share Dashboards: Drag and drop your query results to create beautiful and interactive dashboards. Customize them with various charts, pivot tables, and cards. You can then share these dashboards via secure public links, embed them directly into your application for your customers, or set up scheduled reports via email.

Core Features of draxlr

  • AI-Powered Insights: Use AI Chat to ask questions about your data in plain English and receive instant answers, charts, and insights.
  • Visual SQL Query Builder: A no-code interface that allows non-technical users to build complex queries through clicks, with features like multi-level aggregation, virtual columns, and live data previews.
  • Interactive Dashboards: Create, customize, and share dynamic dashboards with a variety of visualization options, including charts, pivot tables, and compute cards.
  • Embeddable Analytics: Easily embed responsive, white-label dashboards into your own applications, providing valuable analytics to your customers with multi-tenant support.
  • Automated Data Alerts: Set up alerts on your key metrics to receive notifications via Email or Slack when data changes, crosses a specific threshold, or on a schedule.
  • Broad Database Connectivity: Connects to over 10 SQL databases like PostgreSQL, MySQL, Redshift, BigQuery, Snowflake, and more.
  • Query Version Control: Automatically tracks changes to every query, allowing you to review history, compare edits, and revert to previous versions.
  • Data Export and Integration: Export query results to CSV/Excel, and integrate with other tools like Google Sheets and through a dedicated API.

Use Cases for draxlr

Draxlr is versatile and can be used by various teams and industries:

  • Business Teams: Marketing, sales, and operations teams can self-serve their data needs, creating reports and monitoring KPIs without relying on the engineering team.
  • SaaS Companies: Product managers and developers can embed analytics directly into their applications, offering a better user experience and new value to their customers.
  • Developers: Use Draxlr as a powerful SQL client and query builder to speed up development and data exploration tasks.
  • Executives & Managers: Get a high-level overview of business performance through real-time dashboards and receive critical alerts on key business events.

Advantages of draxlr

Draxlr stands out with its modern interface, ease of use, and powerful features. Its primary advantage is democratizing data access, enabling non-technical users to perform complex data analysis. The AI-powered query builder significantly lowers the barrier to entry. The platform's flexibility, with options for cloud or self-hosting, and its robust embedding capabilities make it a scalable solution for businesses of all sizes. Excellent customer support is frequently highlighted by users as a key benefit.

Pricing and Plans

Draxlr offers a flexible pricing structure with a 14-day free trial of the Power plan (no credit card required).

  • Premium Plan: $75/month. Includes 2 databases, 20 users, and 100 AI credits/month.
  • Power Plan: $125/month. Includes 5 databases, 50 users, 300 AI credits/month, and more frequent alert scheduling (from 15 mins).
  • Custom Plan: Custom pricing for larger enterprises, offering features like Single Sign-On (SSO), audit logs, and custom development.
  • Self-Host Plan: Starts at $500/month (billed annually). Allows you to run Draxlr on your own servers for full data control.
  • Add-ons: Extra AI Credits can be purchased at $10/month for 100 credits.

Explo

Explo is a leading customer-facing analytics platform designed to empower businesses by embedding beautiful, interactive, and AI-powered dashboards directly into their own applications. It provides a comprehensive solution for companies in sectors like SaaS, E-commerce, Ed-tech, and Fintech to offer valuable data insights to their end-users, enhancing product stickiness and user engagement. Instead of spending months on building an in-house analytics solution, Explo enables you to launch a fully functional, white-labeled analytics experience in a fraction of the time.

The platform is built on the principle of simplicity and power, allowing both technical and non-technical users to create sophisticated data visualizations. With its AI-driven capabilities, Explo streamlines the process of turning raw data into actionable insights, making data more accessible and understandable for your customers.

How to use Explo

Explo simplifies the process of embedding analytics into a few straightforward steps:

  1. CONNECT: Directly connect your relational databases or data warehouses (like PostgreSQL, MySQL, Snowflake, BigQuery, etc.) to Explo. This process is secure and doesn't require data replication or complex ETL pipelines, ensuring your data remains in your environment.
  2. BUILD: Utilize Explo's intuitive, AI-powered dashboard builder. Drag and drop various components like tables, charts, KPIs, and filters to construct the perfect analytics interface for your customers. The AI assistant can help generate queries and suggest visualizations.
  3. STYLE: Customize every aspect of your dashboards to match your application's native look and feel. The style configurator gives you granular control over fonts, colors, borders, shadows, and more, ensuring a seamless, white-labeled user experience.
  4. EMBED: Instantly embed the created dashboards and reports directly into your application using a simple code snippet. Explo also offers various sharing options, including secure shareable links, scheduled email reports, and direct data delivery to customers.

Core Features of Explo

  • Embedded Analytics: Seamlessly integrate fully interactive dashboards and reports into your web application.
  • AI-Powered Dashboard Builder: Accelerate the creation of insightful dashboards with AI assistance for query generation and visualization.
  • Direct Database Connection: Supports all major relational databases and warehouses, eliminating the need for a separate data pipeline.
  • Full Customization & White-Labeling: Complete control over styling to perfectly match your brand identity for a native feel.
  • Rich Component Library: A wide array of components including various chart types, tables, KPIs, filters, and share buttons.
  • Report Builder & Scheduler: Automate and send customized reports to customers on a recurring schedule via email.
  • Data Share: Securely deliver raw data to customers through various channels like Email, S3, and SFTP.
  • Developer-Friendly: Offers robust documentation, APIs, and integrations to support custom development and workflows.
  • Enterprise-Ready Security: Features like SAML SSO, custom deployments, and dedicated support channels to meet enterprise requirements.

Use Cases for Explo

Explo is versatile and can be applied across numerous industries:

  • SaaS Platforms: Provide in-app usage analytics, performance metrics, and ROI dashboards to customers.
  • E-commerce Marketplaces: Show vendors their sales performance, inventory levels, and customer demographics.
  • Fintech Applications: Offer clients personalized financial dashboards, transaction histories, and investment performance reports.
  • Ed-tech Platforms: Display student progress, course engagement, and learning outcomes to educators and institutions.
  • Healthcare Systems: Share operational analytics with partner clinics or patient outcome data in a secure portal.
  • Logistics & Transportation: Provide clients with real-time shipment tracking, delivery performance, and supply chain efficiency dashboards.

Advantages of Explo

Explo offers significant advantages over building an analytics solution from scratch:

  • Speed to Market: Launch sophisticated customer-facing analytics in days or weeks, not months or years.
  • Reduced Engineering Overhead: Frees up your development team to focus on core product features instead of maintaining a complex analytics infrastructure.
  • Enhanced User Experience: Increases product value and stickiness by providing actionable data insights directly within your platform.
  • Scalability: The architecture is designed to scale with your user base, from a handful of customer groups to thousands.
  • Cost-Effective: Avoids the high upfront and ongoing costs associated with developing and maintaining a custom analytics solution.

Pricing and Plans

Explo offers a range of plans to suit different needs:

  • LAUNCH (Free): Ideal for internal Business Intelligence. Includes unlimited internal dashboards and users, plus access to the AI-powered dashboard builder.
  • GROWTH ($795+/month): A starting point for embedding analytics. Includes everything in the Launch plan, plus 3 embedded dashboard templates and 25 customer groups.
  • PRO ($2,195+/month): For scaling businesses. Offers everything in Growth, plus unlimited embedded dashboard templates, tiered pricing that scales with customer groups, and fully white-labeled dashboards.
  • ENTERPRISE (Custom Pricing): The complete, all-inclusive solution. Includes all Pro features, custom visualizations, dedicated Slack support, SAML SSO, and the Report Builder and Email add-ons.
  • DATA SHARE (Custom Pricing): An add-on service for scheduling and delivering data exports to customers via email, S3, SFTP, and more.

Positioning

Their taxonomy shows where the products overlap and where each one has a more distinct focus. Unknown fields are shown explicitly and are never filled with assumptions.

Categories

Shared
Business Intelligence
Only draxlr
DatabaseAnalyticsData Analysis
Only Explo
Embedded AnalyticsData VisualizationDashboard

Tags

Shared
business intelligencedashboarddata visualizationembedded analyticsno-codereporting
Only draxlr
AI querydata alertsdatabaseSQL
Only Explo
AI dashboardcustomer-facing analyticsdeveloper toolsSaaSwhite-label

Audience and roles

Shared
No listed items
Only draxlr
No listed items
Only Explo
No listed items

Traffic comparison

Traffic is shown on the same scale so differences in market visibility are not visually understated.

How to interpret the traffic data

Both charts share the same months and vertical scale. Each tool identifies its latest reporting month; missing months are left blank, not counted as zero. Regional and source visit counts are estimates calculated from the reported shares.

draxlr monthly traffic:

Latest traffic · 2026-05

Monthly visits
37.4K
Avg. visit duration
0:13
Pages per visit
1.76
Bounce rate
38.15%
Data updated 2026-06-15

Monthly traffic trend

  • 2025-09: 263.8K
  • 2026-01: 198.6K
  • 2026-02: 166.4K
  • 2026-03: 157.5K
  • 2026-04: 85.9K
  • 2026-05: 37.4K

Top regions

Top 5 countries/regions
Country/regionPercentageEstimated visits
🇺🇸United States34.46%12.9K
🇻🇳Vietnam18.53%6.9K
🇮🇳India16.78%6.3K
🇸🇻El Salvador16.65%6.2K
🇷🇺Russia13.58%5.1K

Search keywords

draxlr bar chartneondbradar chart makersql query generatorwhich one is better for ui charts or dashboard apart from superset

Explo monthly traffic:

Latest traffic · 2026-05

Monthly visits
57.8K
Avg. visit duration
0:26
Pages per visit
1.71
Bounce rate
41.15%
Data updated 2026-06-15

Monthly traffic trend

  • 2025-09: 66.8K
  • 2026-01: 63.1K
  • 2026-02: 53.5K
  • 2026-03: 59.3K
  • 2026-04: 52K
  • 2026-05: 57.8K

Top regions

Top 5 countries/regions
Country/regionPercentageEstimated visits
🇺🇸United States44.52%25.8K
🇮🇳India17.96%10.4K
🇧🇷Brazil17.75%10.3K
🇻🇳Vietnam11.79%6.8K
🇮🇩Indonesia7.98%4.6K

Traffic sources

Source typePercentageEstimated visits
Direct94.21%54.5K
Email3.9%2.3K
Referral1.89%1.1K

Search keywords

data generator for traning ai modelsembedded analytics company exploexplohr dashboardmake dataset ai

Community signals

Ratings, comments, favorites, and likes are community signals—not a substitute for product fit.

draxlr

Rating
No data available
Comments
0
Favorites
158
Likes
153

Explo

Rating
No data available
Comments
0
Favorites
166
Likes
164

draxlr vs Explo · Comparison FAQ

What do draxlr and Explo have in common?
Both tools are listed under Business Intelligence. These categories indicate overlapping use cases; compare their detailed descriptions for workflows, capabilities and limitations.
Are draxlr and Explo free?
Listed pricing models: draxlr — Freemium; Explo — Freemium. Missing pricing is not proof of a free plan, and freemium does not mean every feature is free. Check official sites for current plans, limits and trials.
How should I choose between draxlr and Explo?
The primary listed category is Business Intelligence for draxlr, and Business Intelligence for Explo. Compare features, steps and use cases, then verify pricing, data permissions and deployment needs. This page does not include hands-on testing and does not declare a winner from traffic or tags.

Sources and comparison methodology

This page is assembled from ToolMage product listings, taxonomy, traffic statistics and on-site user feedback. It is not a hands-on test or an independent review.
  • Feature and plan descriptions reflect information in the listings, not real-time guarantees. Verify pricing, quotas, availability and privacy terms on the official sites.
  • Traffic uses the reporting months shown. Missing statistics do not mean zero visits, and different periods do not establish growth or superiority. Regional and source visit counts are estimates based on shares.
  • Different tags indicate differences in the listings, not proof that the other product lacks a capability. Ratings, favorites and visits are not used to declare a winner.

Related comparisons